The substance of things unseen. Cities, past and future. In Oxford, perhaps we can use Lewis Carroll and look in the looking glass that is New York City to try and see our true selves, or perhaps pass through to another world. Or, in the words of F. Scott Fitzgerald, "As the moon rose higher, the inessential houses began to melt away until gradually I became aware of the old island here that once flowered for Dutch sailors' eyes, a fresh green breast of the new world."
Het wezen van het ongeziene. Steden in het verleden en de toekomst. In Oxford kunnen we misschien Lewis Carroll gebruiken en in de spiegel kijken die de stad New York is om te proberen ons echte zelf te zien, of misschien een andere wereld binnen te gaan. Of, met de woorden van F. Scott Fitzgerald: "Bij het hoger klimmen van de maan, smolten de bijkomstige huizen weg tot ik het oude eiland gewaar werd, dat hier ooit bloeide voor Hollandse zeemansogen; een frisgroene borst van de Nieuwe Wereld."
My colleagues and I have been working for 10 years to rediscover this lost world in a project we call The Mannahatta Project. We're trying to discover what Henry Hudson would have seen on the afternoon of September 12th, 1609, when he sailed into New York harbor. And I'd like to tell you the story in three acts, and if I have time still, an epilogue.
Met mijn collega's heb ik 10 jaar gewerkt aan het herontdekken van deze verloren wereld, in een project dat we het Mannahattaproject noemen. We proberen te ontdekken wat Henry Hudson zag op de middag van 12 september 1609, toen hij de haven van New York binnenvoer. Ik zou het verhaal graag in drie bedrijven vertellen, en als ik nog tijd heb, een nawoord.
So, Act I: A Map Found. So, I didn't grow up in New York. I grew up out west in the Sierra Nevada Mountains, like you see here, in the Red Rock Canyon. And from these early experiences as a child I learned to love landscapes. And so when it became time for me to do my graduate studies, I studied this emerging field of landscape ecology. Landscape ecology concerns itself with how the stream and the meadow and the forest and the cliffs make habitats for plants and animals. This experience and this training lead me to get a wonderful job with the Wildlife Conservation Society, which works to save wildlife and wild places all over the world. And over the last decade, I traveled to over 40 countries to see jaguars and bears and elephants and tigers and rhinos.
Bedrijf I: Een gevonden kaart. Ik ben niet in New York opgegroeid, maar in het westen, in de Sierra Nevada, zoals je hier ziet, in de Red Rock Canyon. Door deze vroege ervaringen als kind leerde ik van landschappen houden. Toen het tijd werd voor mijn promotieonderzoek, koos ik het nieuwe veld van de landschapsecologie. Landschapsecologie gaat over de vraag hoe het beekje en de wei en het bos en de kliffen een woonplaats vormen voor planten en dieren. Deze ervaring en scholing leidden tot een prachtige baan bij de Wildlife Conservation Society, die overal ter wereld wilde dieren en plekken beschermt. Gedurende de laatste tien jaar ben ik naar meer dan 40 landen gereisd om jaguars en beren en olifanten en tijgers en neushoorns te zien.
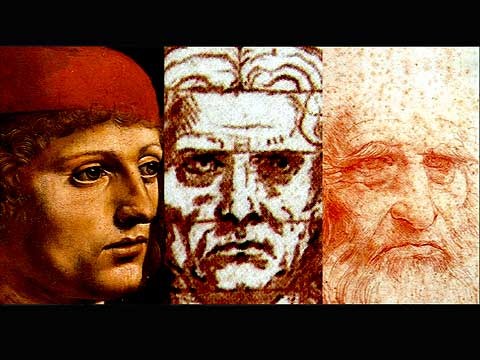
But every time I would return from my trips I'd return back to New York City. And on my weekends I would go up, just like all the other tourists, to the top of the Empire State Building, and I'd look down on this landscape, on these ecosystems, and I'd wonder, "How does this landscape work to make habitat for plants and animals? How does it work to make habitat for animals like me?" I'd go to Times Square and I'd look at the amazing ladies on the wall, and wonder why nobody is looking at the historical figures just behind them. I'd go to Central Park and see the rolling topography of Central Park come up against the abrupt and sheer topography of midtown Manhattan.
Maar elke keer kwam ik van mijn reizen terug naar New York. In de weekends ging ik, net als alle andere toeristen, naar de top van het Empire State Building, en keek ik omlaag naar dit landschap, naar deze ecosystemen, en vroeg ik me af: "Hoe vormt dit landschap een leefomgeving voor planten en dieren? Hoe vormt het een leefomgeving voor dieren zoals ik?" Ik ging naar Times Square en keek naar de wondere dames op de muur, en vroeg me af waarom niemand de historische figuren erachter bekeek. Ik ging naar Central Park en zag de heuvels van dat park afsteken tegen de steile en hoekige topografie van Manhattan.
I started reading about the history and the geography in New York City. I read that New York City was the first mega-city, a city of 10 million people or more, in 1950. I started seeing paintings like this. For those of you who are from New York, this is 125th street under the West Side Highway. (Laughter) It was once a beach. And this painting has John James Audubon, the painter, sitting on the rock. And it's looking up on the wooded heights of Washington Heights to Jeffrey's Hook, where the George Washington Bridge goes across today.
Ik begon te lezen over de geschiedenis en geografie van de stad New York. Ik las dat New York de eerste megastad was, een stad met meer dan 10 miljoen mensen, in 1950. Ik begon schilderijen als deze te zien. Voor diegenen onder jullie uit New York, dit is 125th street onder de West Side Highway. (Gelach) Het was ooit een strand. En op dit schilderij zit John James Audubon, de schilder, op een rots. Het kijkt uit op de beboste hoogten van Washington Heights naar Jeffrey's Hook, waar tegenwoordig de George Washington Bridge overheen gaat.
Or this painting, from the 1740s, from Greenwich Village. Those are two students at King's College -- later Columbia University -- sitting on a hill, overlooking a valley. And so I'd go down to Greenwich Village and I'd look for this hill, and I couldn't find it. And I couldn't find that palm tree. What's that palm tree doing there? (Laughter)
Of dit schilderij, uit de jaren 1740, van Greenwich Village. Dit zijn twee studenten van King's College -- het latere Columbia University -- die op een heuvel zitten en uitkijken op een vallei. Dus ging ik naar Greenwich Village en zocht naar deze heuvel. Ik kon hem niet vinden. En ik kon de palmboom niet vinden. Wat doet die palmboom daar? (Gelach)
So, it was in the course of these investigations that I ran into a map. And it's this map you see here. It's held in a geographic information system which allows me to zoom in. This map isn't from Hudson's time, but from the American Revolution, 170 years later, made by British military cartographers during the occupation of New York City. And it's a remarkable map. It's in the National Archives here in Kew. And it's 10 feet long and three and a half feet wide.
Tijdens deze onderzoekingen vond ik een kaart. Het is deze kaart hier. Ze zit in een geografisch informatiesysteem waardoor ik kan inzoomen. Deze kaart is niet uit de tijd van Hudson, maar uit de Amerikaanse revolutie 170 jaar later, gemaakt door Britse militaire cartografen tijdens de bezetting van de stad New York. Het is een opmerkelijke kaart. Ze ligt in de National Archives hier in Kew. Ze is drie meter lang en één meter breed.
And if I zoom in to lower Manhattan you can see the extent of New York City as it was, right at the end of the American Revolution. Here's Bowling Green. And here's Broadway. And this is City Hall Park. So the city basically extended to City Hall Park. And just beyond it you can see features that have vanished, things that have disappeared. This is the Collect Pond, which was the fresh water source for New York City for its first 200 years, and for the Native Americans for thousands of years before that. You can see the Lispenard Meadows draining down through here, through what is TriBeCa now, and the beaches that come up from the Battery, all the way to 42nd St.
Als ik inzoom op lower Manhattan kun je zien hoe groot New York was aan het eind van de Amerikaanse Revolutie. Hier is Bowling Green. En hier is Broadway. Dit is City Hall Park. Dus de stad reikte eigenlijk tot City Hall Park. Daar net voorbij kun je zaken zien die verdwenen zijn, dingen die niet meer bestaan. Dit is de Collect Pond, de zoetwaterbron van New York tijdens de eerste 200 jaar van haar bestaan en voor de indianen gedurende duizenden jaren daarvoor. Je kan de Lispenard Meadows zien die hier afwateren, door wat nu Tribeca is, en de stranden die omhoog lopen vanaf The Battery, helemaal naar 42nd St.
This map was made for military reasons. They're mapping the roads, the buildings, these fortifications that they built. But they're also mapping things of ecological interest, also military interest: the hills, the marshes, the streams. This is Richmond Hill, and Minetta Water, which used to run its way through Greenwich Village. Or the swamp at Gramercy Park, right here. Or Murray Hill. And this is the Murrays' house on Murray Hill, 200 years ago. Here is Times Square, the two streams that came together to make a wetland in Times Square, as it was at the end of the American Revolution.
Deze kaart is gemaakt voor militaire doeleinden. Ze brengt de wegen in kaart, de gebouwen en deze versterkingen die ze bouwden. Maar ze brengen ook zaken van ecologisch belang in kaart die tevens militair belangrijk zijn: de heuvels, de moerassen, de beekjes. Dit is Richmond Hill, en Minetta Water dat vroeger door Greenwich Village liep. Of het moeras in Gramercy Park, hier. Of Murray Hill. En dit is het huis van Murray op Murray Hill, 200 jaar geleden. Hier is Times Square, de beide beekjes die hier samenkwamen vormden een drasland op Times Square, zoals het was aan het eind van de Amerikaanse revolutie.
So I saw this remarkable map in a book. And I thought to myself, "You know, if I could georeference this map, if I could place this map in the grid of the city today, I could find these lost features of the city, in the block-by-block geography that people know, the geography of where people go to work, and where they go to live, and where they like to eat." So, after some work we were able to georeference it, which allows us to put the modern streets on the city, and the buildings, and the open spaces, so that we can zoom in to where the Collect Pond is. We can digitize the Collect Pond and the streams, and see where they actually are in the geography of the city today. So this is fun for finding where things are relative to the old topography.
Ik zag dus deze opmerkelijke kaart in een boek, en ik dacht bij mezelf: "Als ik deze kaart kon georefereren, als ik haar over het raster van de huidige stad kon leggen, zou ik deze verloren kenmerken van de stad kunnen vinden, in de ruimtelijke structuur die mensen kennen, de geografie waarin mensen werken, wonen en waar ze graag eten. Na wat werk konden we haar georefereren, waardoor we de huidige straten erin kunnen zetten, en de gebouwen, en de open ruimten zodat we kunnen inzoomen op de Collect Pond. We kunnen de Collect Pond en de beekjes digitaliseren, en zien waar die zich bevinden in de geografie van de huidige stad. Dat is leuk om uit te vinden waar dingen zijn ten opzichte van de oude topografie.
But I had another idea about this map. If we take away the streets, and if we take away the buildings, and if we take away the open spaces, then we could take this map. If we pull off the 18th century features we could drive it back in time. We could drive it back to its ecological fundamentals: to the hills, to the streams, to the basic hydrology and shoreline, to the beaches, the basic aspects that make the ecological landscape.
Maar ik had nog een idee met deze kaart. Als we de straten weglaten, en de gebouwen, en de open ruimten, dan konden we deze kaart gebruiken. Als we de 18e-eeuwse zaken weglaten kunnen we terug in de tijd gaan. We kunnen het terugbrengen tot de ecologische basis: tot de heuvels, de beekjes, tot de gegevens over het water en de kustlijn, de stranden, de basisaspecten van het ecologische landschap.
Then, if we added maps like the geology, the bedrock geology, and the surface geology, what the glaciers leave, if we make the soil map, with the 17 soil classes, that are defined by the National Conservation Service, if we make a digital elevation model of the topography that tells us how high the hills were, then we can calculate the slopes. We can calculate the aspect. We can calculate the winter wind exposure -- so, which way the winter winds blow across the landscape. The white areas on this map are the places protected from the winter winds.
Als we dan de geologie toevoegen, gesteenten, de oppervlaktegeologie -- wat de gletsjers achterlaten -- als we een grondsoorten-kaart maken met de 17 bodemsoorten die door de National Soil Conservation Service gedefinieerd zijn, als we een digitaal hoogtemodel maken van de topografie, dat ons vertelt hoe hoog de heuvels waren, dan kunnen we de hellingen berekenen. We kunnen ligging berekenen. We kunnen de blootstelling aan winterwind berekenen -- hoe woei de wind over het landschap? De witte gebieden lagen 's winters in de luwte.
We compiled all the information about where the Native Americans were, the Lenape. And we built a probability map of where they might have been. So, the red areas on this map indicate the places that are best for human sustainability on Manhattan, places that are close to water, places that are near the harbor to fish, places protected from the winter winds. We know that there was a Lenape settlement down here by the Collect Pond. And we knew that they planted a kind of horticulture, that they grew these beautiful gardens of corn, beans, and squash, the "Three Sisters" garden.
We verzamelden alle informatie over de verblijfplaatsen van de indianen, de Lenape. We onderzochten waar zij waarschijnlijk leefden. De rode gebieden op deze kaart markeren de beste plekken voor menselijke bewoning op Manhattan; plekken dicht bij het water, plekken dicht bij de haven om te vissen, plekken beschermd tegen de winterwind. We weten dat er een Lenape-nederzetting was hier bij de Collect Pond, en dat ze aan tuinbouw deden, en prachtige tuinen hadden met mais, bonen en kalebassen, de tuinen van de "Drie Zusters".
So, we built a model that explains where those fields might have been. And the old fields, the successional fields that go. And we might think of these as abandoned. But, in fact, they're grassland habitats for grassland birds and plants. And they have become successional shrub lands, and these then mix in to a map of all the ecological communities. And it turns out that Manhattan had 55 different ecosystem types. You can think of these as neighborhoods, as distinctive as TriBeCa and the Upper East Side and Inwood -- that these are the forest and the wetlands and the marine communities, the beaches.
We hebben een model gemaakt dat aangeeft waar deze velden misschien waren. En de oude velden, de voorgangers van de toenmalige velden. We kunnen deze zien als verlaten... maar in feite zijn het grasland-habitats voor vogels en planten. Het werd vervolgens land met struikgewas, binnen het totaal van ecologische gemeenschappen. Het blijkt dat Manhattan 55 verschillende typen ecosystemen had. Die kun je zien als buurten, zo verscheiden als Tribeca, de Upper East Side en Inwood -- dat zijn de bossen en draslanden, watergemeenschappen, stranden.
And 55 is a lot. On a per-area basis, Manhattan had more ecological communities per acre than Yosemite does, than Yellowstone, than Amboseli. It was really an extraordinary landscape that was capable of supporting an extraordinary biodiversity.
En 55 is veel. Op basis van grondgebied, had Manhattan meer ecologische gemeenschappen per hectare dan Yosemite heeft, of Yellowstone, of Amboseli. Het was echt een buitengewoon landschap, in staat om een buitengewone biodiversiteit te herbergen.
So, Act II: A Home Reconstructed. So, we studied the fish and the frogs and the birds and the bees, the 85 different kinds of fish that were on Manhattan, the Heath hens, the species that aren't there anymore, the beavers on all the streams, the black bears, and the Native Americans, to study how they used and thought about their landscape. We wanted to try and map these. And to do that what we did was we mapped their habitat needs.
Tweede bedrijf: Een gereconstrueerd thuis. We bestudeerden de vissen en kikkers en vogels en bijen, de 85 verschillende soorten vis op Manhattan, de Heath-hoenders, de verdwenen soorten, de bevers in alle stroompjes, de zwarte beren, en de indianen, om te bestuderen hoe zij hun landschap gebruikten en erover dachten. We wilden proberen dit in kaart te brengen. Daarom brachten we hun habitat-behoeften in kaart.
Where do they get their food? Where do they get their water? Where do they get their shelter? Where do they get their reproductive resources? To an ecologist, the intersection of these is habitat, but to most people, the intersection of these is their home. So, we would read in field guides, the standard field guides that maybe you have on your shelves, you know, what beavers need is, "A slowly meandering stream with aspen trees and alders and willows, near the water." That's the best thing for a beaver.
Waar vonden ze hun voedsel? Waar vonden ze hun water? Waar hun beschutting? Waar vonden ze hun mogelijkheden tot voortplanting? Voor een ecoloog is het snijpunt van dit alles de habitat. Maar voor de meeste mensen is dit snijpunt hun thuis. We lazen in veldgidsen, standaard veldgidsen zoals je wellicht op je boekenplank hebt staan. Wat bevers nodig hebben, is "een langzaam kronkelend beekje met espen en elzen en wilgen, vlakbij het water". Dat is het beste voor een bever.
So we just started making a list. Here is the beaver. And here is the stream, and the aspen and the alder and the willow. As if these were the maps that we would need to predict where you would find the beaver. Or the bog turtle, needing wet meadows and insects and sunny places. Or the bobcat, needing rabbits and beavers and den sites. And rapidly we started to realize that beavers can be something that a bobcat needs. But a beaver also needs things. And that having it on either side means that we can link it together, that we can create the network of the habitat relationships for these species.
Dus we maakten een lijst. Hier is de bever. Hier is de stroom, en de espen en elzen en wilgen. Alsof dit de kaarten zijn om te voorspellen waar je de bever zou kunnen vinden. Of de Muhlenbergs schildpad, die natte weiden, insecten en zonnige plekken nodig heeft. Of de rode lynx, die konijnen, bevers en beschutte plekken nodig heeft. Al snel realiseerden we ons dat bevers een behoefte kunnen zijn van een lynx. Maar een bever heeft ook dingen nodig. Dat betekent dat we die twee kunnen linken, een netwerk kunnen creëren van de habitat-relaties van deze soorten.
Moreover, we realized that you can start out as being a beaver specialist, but you can look up what an aspen needs. An aspen needs fire and dry soils. And you can look at what a wet meadow needs. And it need beavers to create the wetlands, and maybe some other things. But you can also talk about sunny places. So, what does a sunny place need? Not habitat per se. But what are the conditions that make it possible? Or fire. Or dry soils. And that you can put these on a grid that's 1,000 columns long across the top and 1,000 rows down the other way. And then we can visualize this data like a network, like a social network.
Bovendien beseften we dat je kunt beginnen als beverspecialist, maar kunt kijken naar wat een esp nodig heeft. Een esp heeft vuur en droge grond nodig. Ook kun je kijken naar wat een natte weide nodig heeft. Ze heeft bevers nodig om draslanden te creëren, en misschien wat andere dingen. Maar je kunt ook praten over zonnige plekken. Wat heeft een zonnige plek nodig? Niet echt habitat. Maar wat zijn de omstandigheden die het mogelijk maken? Of vuur. Of droge grond. Dat kun je op een raster zetten met 1000 kolommen horizontaal en 1000 kolommen vertikaal. Dan kunnen we deze data visualiseren als een netwerk, als een sociaal netwerk.
And this is the network of all the habitat relationships of all the plants and animals on Manhattan, and everything they needed, going back to the geology, going back to time and space at the very core of the web. We call this the Muir Web. And if you zoom in on it it looks like this. Each point is a different species or a different stream or a different soil type. And those little gray lines are the connections that connect them together. They are the connections that actually make nature resilient. And the structure of this is what makes nature work, seen with all its parts. We call these Muir Webs after the Scottish-American naturalist John Muir, who said, "When we try to pick out anything by itself, we find that it's bound fast by a thousand invisible cords that cannot be broken, to everything in the universe."
Dit is het netwerk van alle habitat-relaties van alle planten en dieren op Manhattan, en al hun behoeften, door terug te gaan naar de geologie, naar tijd en ruimte aan de basis van het web. We noemen dit het Muir Web. Als je erop inzoomt, ziet het er zo uit. Elk punt is een andere soort, of een andere beek, of een ander bodemtype. Die kleine grijze lijnen zijn de connecties tussen hen. Deze connecties maken de natuur veerkrachtig. Deze structuur is wat de natuur doet functioneren, als je alle delen beschouwt. We noemen dit Muir Webs, naar de Schots-Amerikaanse natuurvorser John Muir, die zei: "Wanneer we iets proberen eruit te lichten, zien we dat het stevig verbonden is -- door duizend onzichtbare, onverbrekelijke koorden -- met alles in het universum".
So then we took the Muir webs and we took them back to the maps. So if we wanted to go between 85th and 86th, and Lex and Third, maybe there was a stream in that block. And these would be the kind of trees that might have been there, and the flowers and the lichens and the mosses, the butterflies, the fish in the stream, the birds in the trees. Maybe a timber rattlesnake lived there. And perhaps a black bear walked by. And maybe Native Americans were there. And then we took this data.
Dan namen we de Muir Webs en we zetten deze op de kaarten. Dus als we tussen 85th en 86th wilden kijken, en Lex en 3rd, was er misschien een beek in dat blok. Deze soort bomen zouden er kunnen zijn geweest, en de bloemen en korstmossen en de mossen, de vlinders, de vissen in de beek, de vogels in de bomen. Misschien leefde er een ratelslang. Misschien liep er een zwarte beer voorbij. Misschien waren er indianen. Dan namen we deze data.
You can see this for yourself on our website. You can zoom into any block on Manhattan, and see what might have been there 400 years ago. And we used it to try and reveal a landscape here in Act III. We used the tools they use in Hollywood to make these fantastic landscapes that we all see in the movies.
Je kunt het voor jezelf zien op onze website. Je kunt inzoomen op ieder blok op Manhattan, en zien wat er wellicht was, 400 jaar geleden. Ook gebruikten we ze om een landschap te onthullen in het derde bedrijf. We gebruikten dezelfde gereedschappen waarmee ze in Hollywood de filmlandschappen maken.
And we tried to use it to visualize Third Avenue. So we would take the landscape and we would build up the topography. We'd lay on top of that the soils and the waters, and illuminate the landscape. We would lay on top of that the map of the ecological communities. And feed into that the map of the species. So that we would actually take a photograph, flying above Times Square, looking toward the Hudson River, waiting for Hudson to come. Using this technology, we can make these fantastic georeferenced views. We can basically take a picture out of any window on Manhattan and see what that landscape looked like 400 years ago.
Wij probeerden 3rd Avenue ermee te visualiseren. Dus we namen het landschap en we bouwden de topografie op. Daar legden we de aarde en het water op, en we belichtten het landschap. Daar bovenop legden we de kaart van de ecologische gemeenschappen, en voegden dan de soorten-kaart eraan toe. Zo konden we werkelijk een foto nemen, vliegend boven Times Square, neerkijkend op de Hudson Rivier, wachtend op Hudson. Met deze technologie kunnen we prachtige onderbouwde uitzichten maken. We kunnen een foto maken vanuit elk raam op Manhattan, en zien hoe dat landschap er 400 jaar geleden uitzag.
This is the view from the East River, looking up Murray Hill at where the United Nations is today. This is the view looking down the Hudson River, with Manhattan on the left, and New Jersey out on the right, looking out toward the Atlantic Ocean. This is the view over Times Square, with the beaver pond there, looking out toward the east. So we can see the Collect Pond, and Lispenard Marshes back behind. We can see the fields that the Native Americans made. And we can see this in the geography of the city today. So when you're watching "Law and Order," and the lawyers walk up the steps they could have walked back down those steps of the New York Court House, right into the Collect Pond, 400 years ago.
Dit is het uitzicht van de East River, als je Murray Hill op kijkt naar waar de VN tegenwoordig is. Dit is het uitzicht over de Hudsonrivier, met Manhattan links, en New Jersey rechts, kijkend richting de Atlantische Oceaan. Dit is het uitzicht over Times Square, met de bevervijver daar, oostwaarts kijkend. We kunnen de Collect Pond zien, en Lispenard Marshes erachter. We kunnen de velden van de indianen zien. We kunnen dit zien in de geografie van de huidige stad. Dus als je Law en Order bekijkt, en de advocaten lopen de trappen op, dan zouden ze die trappen van de New Yorkse rechtbank weer af kunnen lopen, rechtstreeks de Collect Pond in, 400 jaar geleden.
So these images are the work of my friend and colleague, Mark Boyer, who is here in the audience today. And I'd just like, if you would give him a hand, to call out for his fine work. (Applause)
Deze beelden zijn het werk van mijn vriend en collega, Mark Boyer, die hier in het publiek zit. Als jullie hem een applaus zouden willen geven voor zijn fraaie werk. (Applaus)
There is such power in bringing science and visualization together, that we can create images like this, perhaps looking on either side of a looking glass. And even though I've only had a brief time to speak, I hope you appreciate that Mannahatta was a very special place. The place that you see here on the left side was interconnected. It was based on this diversity. It had this resilience that is what we need in our modern world.
Er schuilt zoveel kracht in het samenbrengen van wetenschap en visualisatie, in beelden als deze. Misschien kijken ze aan weerszijden van een spiegel. Ondanks dat mijn spreektijd kort was, hoop ik dat jullie Mannahatta zien als een bijzondere plek. De plek die je hier links ziet, was onderling verbonden. Ze was gebaseerde op diversiteit. Ze had de veerkracht die we in onze huidige wereld nodig hebben.
But I wouldn't have you think that I don't like the place on the right, which I quite do. I've come to love the city and its kind of diversity, and its resilience, and its dependence on density and how we're connected together. In fact, that I see them as reflections of each other, much as Lewis Carroll did in "Through the Looking Glass." We can compare these two and hold them in our minds at the same time, that they really are the same place, that there is no way that cities can escape from nature. And I think this is what we're learning about building cities in the future.
Maar denk alsjeblieft niet dat ik de plek rechts niet zou mogen; dat doe ik wel. Ik hou van de stad met haar eigen soort diversiteit, en haar veerkracht, en haar afhankelijkheid van dichtheid en hoe we onderling verbonden zijn. In feite zie ik ze als reflecties van elkaar. Een beetje als Lewis Carrol deed in "Achter de Spiegel". We kunnen deze twee vergelijken en ze gelijktijdig in gedachten houden, dat ze werkelijk dezelfde plek zijn, dat een stad zich onmogelijk kan losmaken van de natuur. Ik denk dat we dit leren voor het bouwen van steden in de toekomst.
So if you'll allow me a brief epilogue, not about the past, but about 400 years from now, what we're realizing is that cities are habitats for people, and need to supply what people need: a sense of home, food, water, shelter, reproductive resources, and a sense of meaning. This is the particular additional habitat requirement of humanity. And so many of the talks here at TED are about meaning, about bringing meaning to our lives in all kinds of different ways, through technology, through art, through science, so much so that I think we focus so much on that side of our lives, that we haven't given enough attention to the food and the water and the shelter, and what we need to raise the kids.
Dus als je me een kort nawoord toestaat, niet over het verleden, maar over 400 jaar in de toekomst, dan realiseren we ons, dat steden habitats voor mensen zijn, en dat ze moeten leveren wat mensen nodig hebben: een thuis, voedsel, water, beschutting, voortplantingsmogelijkheden... en zingeving. Dat is de specifieke habitat-eis die de mens toevoegt. Zoveel talks hier bij TED gaan over zingeving, over het geven van zin aan ons leven op alle mogelijke manieren, door technologie, door kunst, door wetenschap, zozeer dat ik denk dat we ons zo sterk richten op die kant van onze levens, dat we niet genoeg aandacht geven aan het voedsel, het water, de beschutting, en wat we nodig hebben om kinderen op te voeden.
So, how can we envision the city of the future? Well, what if we go to Madison Square Park, and we imagine it without all the cars, and bicycles instead and large forests, and streams instead of sewers and storm drains? What if we imagined the Upper East Side with green roofs, and streams winding through the city, and windmills supplying the power we need? Or if we imagine the New York City metropolitan area, currently home to 12 million people, but 12 million people in the future, perhaps living at the density of Manhattan, in only 36 percent of the area, with the areas in between covered by farmland, covered by wetlands, covered by the marshes we need.
Dus, hoe stellen we ons de stad van de toekomst voor? Laten we naar Madison Square Park gaan, en het ons voorstellen zonder de auto's, maar met fietsen, en grote bossen, en beken in plaats van riolen en stormwater-afvoeren. Stel je de Upper East Side voor met groene daken, en beken die door de stad kronkelen, en windmolens die ons van energie voorzien. Of we stellen ons de metropool New York voor, met de huidige 12 miljoen mensen, maar dat deze mensen misschien leven met de dichtheid van Manhattan, op slechts 36% van het gebied, met de gebieden daartussen bedekt met akkers, bedekt met draslanden, met de moerassen die we nodig hebben.
This is the kind of future I think we need, is a future that has the same diversity and abundance and dynamism of Manhattan, but that learns from the sustainability of the past, of the ecology, the original ecology, of nature with all its parts. Thank you very much. (Applause)
Dit is de soort toekomst die we nodig hebben, een toekomst met dezelfde diversiteit en overvloed en dynamiek van Manhattan, maar die leert van duurzaamheid van het verleden, van de ecologie, de originele ecologie... de natuur met al haar delen. Mijn hartelijke dank. (Applaus)