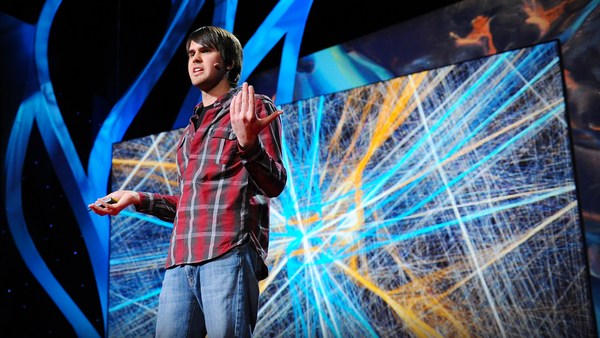
When we think about mapping cities, we tend to think about roads and streets and buildings, and the settlement narrative that led to their creation, or you might think about the bold vision of an urban designer, but there's other ways to think about mapping cities and how they got to be made. Today, I want to show you a new kind of map. This is not a geographic map. This is a map of the relationships between people in my hometown of Baltimore, Maryland, and what you can see here is that each dot represents a person, each line represents a relationship between those people, and each color represents a community within the network.
Now, I'm here on the green side, down on the far right where the geeks are, and TEDx also is down on the far right. (Laughter) Now, on the other side of the network, you tend to have primarily African-American and Latino folks who are really concerned about somewhat different things than the geeks are, but just to give some sense, the green part of the network we call Smalltimore, for those of us that inhabit it, because it seems as though we're living in a very small town. We see the same people over and over again, but that's because we're not really exploring the full depth and breadth of the city. On the other end of the network, you have folks who are interested in things like hip-hop music and they even identify with living in the DC/Maryland/Virginia area over, say, the Baltimore city designation proper. But in the middle, you see that there's something that connects the two communities together, and that's sports. We have the Baltimore Orioles, the Baltimore Ravens football team, Michael Phelps, the Olympian. Under Armour, you may have heard of, is a Baltimore company, and that community of sports acts as the only bridge between these two ends of the network.
Let's take a look at San Francisco. You see something a little bit different happening in San Francisco. On the one hand, you do have the media, politics and news lobe that tends to exist in Baltimore and other cities, but you also have this very predominant group of geeks and techies that are sort of taking over the top half of the network, and there's even a group that's so distinct and clear that we can identify it as Twitter employees, next to the geeks, in between the gamers and the geeks, at the opposite end of the hip-hop spectrum. So you can see, though, that the tensions that we've heard about in San Francisco in terms of people being concerned about gentrification and all the new tech companies that are bringing new wealth and settlement into the city are real, and you can actually see that documented here. You can see the LGBT community is not really getting along with the geek community that well, the arts community, the music community. And so it leads to things like this. ["Evict Twitter"] Somebody sent me this photo a few weeks ago, and it shows what is happening on the ground in San Francisco, and I think you can actually try to understand that through looking at a map like this.
Let's take a look at Rio de Janeiro. I spent the last few weeks gathering data about Rio, and one of the things that stood out to me about this city is that everything's really kind of mixed up. It's a very heterogenous city in a way that Baltimore or San Francisco is not. You still have the lobe of people involved with government, newspapers, politics, columnists. TEDxRio is down in the lower right, right next to bloggers and writers. But then you also have this tremendous diversity of people that are interested in different kinds of music. Even Justin Bieber fans are represented here. Other boy bands, country singers, gospel music, funk and rap and stand-up comedy, and there's even a whole section around drugs and jokes. How cool is that? And then the Flamengo football team is also represented here. So you have that same kind of spread of sports and civics and the arts and music, but it's represented in a very different way, and I think that maybe fits with our understanding of Rio as being a very multicultural, musically diverse city.
So we have all this data. It's an incredibly rich set of data that we have about cities now, maybe even richer than any data set that we've ever had before. So what can we do with it? Well, I think the first thing that we can try to understand is that segregation is a social construct. It's something that we choose to do, and we could choose not to do it, and if you kind of think about it, what we're doing with this data is aiming a space telescope at a city and looking at it as if was a giant high school cafeteria, and seeing how everybody arranged themselves in a seating chart. Well maybe it's time to shake up the seating chart a little bit.
The other thing that we start to realize is that race is a really poor proxy for diversity. We've got people represented from all different types of races across the entire map here -- only looking at race doesn't really contribute to our development of diversity. So if we're trying to use diversity as a way to tackle some of our more intractable problems, we need to start to think about diversity in a new way.
And lastly, we have the ability to create interventions to start to reshape our cities in a new way, and I believe that if we have that capability, we may even bear some responsibility to do so.
So what is a city? I think some might say that it is a geographical area or a collection of streets and buildings, but I believe that a city is the sum of the relationships of the people that live there, and I believe that if we can start to document those relationships in a real way then maybe we have a real shot at creating those kinds of cities that we'd like to have.
Thank you.
(Applause)


