This is what my last week looked like. What I did, who I was with, the main sensations I had for every waking hour ... If the feeling came as I thought of my dad who recently passed away, or if I could have just definitely avoided the worries and anxieties. And if you think I'm a little obsessive, you're probably right. But clearly, from this visualization, you can learn much more about me than from this other one, which are images you're probably more familiar with and which you possibly even have on your phone right now. Bar charts for the steps you walked, pie charts for the quality of your sleep -- the path of your morning runs.
כך נראה השבוע החולף שלי. מה עשיתי, עם מי נפגשתי, החוויות הגדולות שהיו לי בכל שעה ושעה... אם התחושה נוצרה כשחשבתי על אבי שהלך לעולמו לאחרונה, או אם הצלחתי פשוט להמנע מהדאגות ומהחרדות. ואם אתם חושבים שאני טיפה אובססיבית, אתם בוודאי צודקים. אבל ברור שמההמחשה החזותית הזו תוכלו ללמוד עליי הרבה יותר מאשר מזו, שמורכבת מצורות שאתם כנראה מכירים טוב יותר ושכנראה יש לכם אפילו בטלפון. טבלת עמודות של הצעדים שהלכתם, תרשימי עוגה של איכות השינה שלכם -- מסלול ריצת הבוקר שלכם.
In my day job, I work with data. I run a data visualization design company, and we design and develop ways to make information accessible through visual representations. What my job has taught me over the years is that to really understand data and their true potential, sometimes we actually have to forget about them and see through them instead. Because data are always just a tool we use to represent reality. They're always used as a placeholder for something else, but they are never the real thing.
במקצוע שלי, אני עובדת עם נתונים. אני מנהלת חברה לעיצוב חזותי של נתונים ואנחנו מתכננים ומפתחים דרכים להנגשת נתונים באמצעות ייצוגים חזותיים. מה שלמדתי מהעבודה שלי במהלך השנים הוא שכדי באמת להבין נתונים ואת הפוטנציאל האמיתי שלהם, לפעמים אנחנו צריכים ממש לשכוח אותם ובמקום זאת - לראות דרכם. כי נתונים הם רק כלי שמשמש אותנו כדי לייצג מציאות. הם משמשים תמיד כמצייני מיקום למשהו אחר, אבל הם אף פעם לא הדבר האמיתי.
But let me step back for a moment to when I first understood this personally. In 1994, I was 13 years old. I was a teenager in Italy. I was too young to be interested in politics, but I knew that a businessman, Silvio Berlusconi, was running for president for the moderate right. We lived in a very liberal town, and my father was a politician for the Democratic Party. And I remember that no one thought that Berlusconi could get elected -- that was totally not an option. But it happened. And I remember the feeling very vividly. It was a complete surprise, as my dad promised that in my town he knew nobody who voted for him.
אבל תנו לי לחזור לרגע לרגע שבו אני אישית הבנתי את זה. בשנת 1994 הייתי בת 13, הייתי מתבגרת באיטליה. הייתי צעירה מכדי להתעניין בפוליטיקה, אבל ידעתי שאיש עסקים אחד, סילביו ברלוסקוני, רץ לנשיאות מטעם הימין המתון. גרנו בעיירה ליברלית מאד, ואבי היה פוליטיקאי מטעם המפלגה הדמוקרטית. אני זוכרת שאיש לא חשב שברלוסקוני יכול להיבחר -- זו כלל לא היתה אפשרות. אבל זה קרה. ואני זוכרת את ההרגשה הזו בבהירות. זו היתה הפתעה מוחלטת, כי אבי נשבע שהוא לא הכיר איש בעיירה שלנו שהצביע עבורו.
This was the first time when the data I had gave me a completely distorted image of reality. My data sample was actually pretty limited and skewed, so probably it was because of that, I thought, I lived in a bubble, and I didn't have enough chances to see outside of it.
זו היתה הפעם הראשונה שבה הנתונים שהיו ברשותי סיפקו לי תמונה מעוותת לגמרי של המציאות. מדגם הנתונים שלי היה למעשה די מוגבל ומוטה, וכנראה זו הסיבה, כך חשבתי. חייתי בתוך בועה, ולא הזדמן לי הרבה לצאת ממנה.
Now, fast-forward to November 8, 2016 in the United States. The internet polls, statistical models, all the pundits agreeing on a possible outcome for the presidential election. It looked like we had enough information this time, and many more chances to see outside the closed circle we lived in -- but we clearly didn't. The feeling felt very familiar. I had been there before. I think it's fair to say the data failed us this time -- and pretty spectacularly. We believed in data, but what happened, even with the most respected newspaper, is that the obsession to reduce everything to two simple percentage numbers to make a powerful headline made us focus on these two digits and them alone. In an effort to simplify the message and draw a beautiful, inevitable red and blue map, we lost the point completely. We somehow forgot that there were stories -- stories of human beings behind these numbers.
במעבר מהיר ל-8 בנובמבר 2016 בארצות הברית. הסקרים באינטרנט, המודלים הסטטיסטיים, כל המומחים הסכימו על תוצאה אפשרית בבחירות לנשיאות. היה נראה שהפעם יש לנו מספיק מידע, ושביכולתנו לראות אפשרויות רבות יותר מחוץ למעגל הסגור שחיינו בו -- אבל ברור שלא הצלחנו. התחושה היתה מאד מוכרת. כבר חוויתי את זה. אני חושבת שהוגן לומר שהנתונים הטעו אותנו הפעם -- ובאופן מפואר מאד. אנחנו האמנו בנתונים, אבל מה שקרה, אפילו בעיתון המכובד ביותר, זה שהאובססיה לצמצם כל דבר לשני מספרי אחוזים פשוטים כדי ליצור כותרת עוצמתית גרמה לנו להתמקד בשני המספרים האלו ורק בהם. במאמץ לפשט את המסר ולצייר מפה יפה ובלתי-נמנעת של כחול ואדום, החמצנו לגמרי את העיקר. איכשהו שכחנו שישנם סיפורים -- סיפורים של בני אדם מאחורי המספרים האלו.
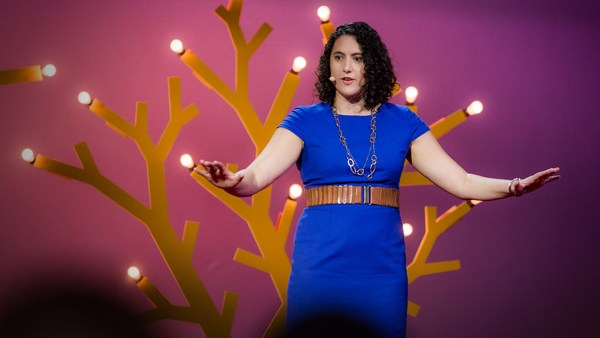
In a different context, but to a very similar point, a peculiar challenge was presented to my team by this woman. She came to us with a lot of data, but ultimately she wanted to tell one of the most humane stories possible. She's Samantha Cristoforetti. She has been the first Italian woman astronaut, and she contacted us before being launched on a six-month-long expedition to the International Space Station. She told us, "I'm going to space, and I want to do something meaningful with the data of my mission to reach out to people." A mission to the International Space Station comes with terabytes of data about anything you can possibly imagine -- the orbits around Earth, the speed and position of the ISS and all of the other thousands of live streams from its sensors. We had all of the hard data we could think of -- just like the pundits before the election -- but what is the point of all these numbers? People are not interested in data for the sake of it, because numbers are never the point. They're always the means to an end. The story we needed to tell is that there is a human being in a teeny box flying in space above your head, and that you can actually see her with your naked eye on a clear night. So we decided to use data to create a connection between Samantha and all of the people looking at her from below. We designed and developed what we called "Friends in Space," a web application that simply lets you say "hello" to Samantha from where you are, and "hello" to all the people who are online at the same time from all over the world. And all of these "hellos" left visible marks on the map as Samantha was flying by and as she was actually waving back every day at us using Twitter from the ISS.
בהקשר אחר, אבל עם מסר דומה מאד, הצוות שלי קיבל אתגר ייחודי מן האישה הזאת. היא הגיעה אלינו עם נתונים רבים, אבל בעצם היא רצתה לספר את אחד הסיפורים האנושיים ביותר. זוהי סמנתה כריסטופורטי. היא היתה האסטרונאוטית האיטלקיה הראשונה, והיא יצרה אתנו קשר לפני שיגורה למסע בן ששה חודשים לתחנת החלל הבינלאומית. היא אמרה לנו "אני טסה לחלל, "ואני רוצה לעשות משהו בעל משמעות עם הנתונים מהמשימה שלי כדי לגעת באנשים". במסע אל תחנת החלל הבינלאומית נוצרים טרה-בייטים של נתונים על כל דבר שרק תוכלו לדמיין -- המסלולים סביב כדור הארץ, המהירות והמיקום של תחנת החלל הבינלאומית וכל יתר אלפי השידורים החיים מהחיישנים שלה. היו לנו את כל הנתונים המוצקים שיכולנו לחשוב עליהם -- בדיוק כמו למומחים לפני הבחירות -- אבל מה הטעם בכל המספרים האלו? אנשים אינם מעוניינים בנתונים רק לשם הנתונים, כי המספרים לעולם אינם העיקר. הם משמשים תמיד אמצעי. ["אני כאן"] הסיפור שהיה עלינו לספר הוא שיש אדם בתוך קופסת פח שמרחפת בחלל מעל לראשיכם, ושבלילה בהיר אפשר לראותה בעין בלתי מזויינת. אז החלטנו להשתמש בנתונים כדי ליצור קשר בין סמנתה לבין כל האנשים שמביטים עליה מלמטה. תכננו ופיתחנו את מה שאנו מכנים: "חברים בחלל", אפליקציית רשת שפשוט מאפשרת לכם לומר "שלום" לסמנתה מהמקום בו אתם נמצאים, ולומר "שלום" לכל האנשים שמחוברים באותו זמן לרשת מכל העולם. וכל אמירות ה"שלום" הללו השאירו סימנים חזותיים על המפה כשסמנתה חלפה מעליהם וכשהיא נופפה אלינו בחזרה כל יום באמצעות טוויטר מתחנת החלל.
This made people see the mission's data from a very different perspective. It all suddenly became much more about our human nature and our curiosity, rather than technology. So data powered the experience, but stories of human beings were the drive. The very positive response of its thousands of users taught me a very important lesson -- that working with data means designing ways to transform the abstract and the uncountable into something that can be seen, felt and directly reconnected to our lives and to our behaviors, something that is hard to achieve if we let the obsession for the numbers and the technology around them lead us in the process. But we can do even more to connect data to the stories they represent. We can remove technology completely.
זה איפשר לראות את הנתונים מהמשימה מזווית שונה לגמרי, פתאום הכל התמקד הרבה יותר בטבע האנושי ובסקרנות שלנו, במקום בטכנולוגיה. הנתונים העצימו את החוויה, אבל סיפורים של אנשים היו המניע. התגובה החיובית של אלפי המשתמשים לימדו אותי לקח חשוב מאד -- שעבודה עם נתונים משמעותה לעצב דרכים להפוך דברים מופשטים ובלתי ניתנים לספירה למשהו שניתן לראות, להרגיש ולקשר באופן מיידי לחיים שלנו ולהתנהגויות שלו, משהו שקשה להשיג כאשר מניחים לכפייתיות בקשר למספרים ולטכנולוגיה סביבם להוביל אותנו בתהליך. אבל אפשר לעשות יותר מכך כדי לחבר את הנתונים לסיפורים שהם מייצגים. אנחנו יכולים לסלק לחלוטין מהתמונה את הטכנולוגיה.
A few years ago, I met this other woman, Stefanie Posavec -- a London-based designer who shares with me the passion and obsession about data. We didn't know each other, but we decided to run a very radical experiment, starting a communication using only data, no other language, and we opted for using no technology whatsoever to share our data. In fact, our only means of communication would be through the old-fashioned post office. For "Dear Data," every week for one year, we used our personal data to get to know each other -- personal data around weekly shared mundane topics, from our feelings to the interactions with our partners, from the compliments we received to the sounds of our surroundings. Personal information that we would then manually hand draw on a postcard-size sheet of paper that we would every week send from London to New York, where I live, and from New York to London, where she lives. The front of the postcard is the data drawing, and the back of the card contains the address of the other person, of course, and the legend for how to interpret our drawing. The very first week into the project, we actually chose a pretty cold and impersonal topic. How many times do we check the time in a week? So here is the front of my card, and you can see that every little symbol represents all of the times that I checked the time, positioned for days and different hours chronologically -- nothing really complicated here. But then you see in the legend how I added anecdotal details about these moments. In fact, the different types of symbols indicate why I was checking the time -- what was I doing? Was I bored? Was I hungry? Was I late? Did I check it on purpose or just casually glance at the clock? And this is the key part -- representing the details of my days and my personality through my data collection. Using data as a lens or a filter to discover and reveal, for example, my never-ending anxiety for being late, even though I'm absolutely always on time.
לפני מספר שנים פגשתי אשה אחרת, סטפני פוזאבק -- מעצבת שחיה בלונדון וחולקת עמי את התשוקה והאובססיה לנתונים. לא הכרנו זו את זו, אבל החלטנו לנהל ניסוי קיצוני מאד, לקיים תקשורת תוך שימוש בנתונים בלבד, ללא אף שפה אחרת, ["נתונים יקרים"] ובחרנו לא להשתמש בשום טכנולוגיה כדי לחלוק את המידע שלנו. למעשה, אמצעי התקשורת היחיד שלנו יהיה דרך שירות הדואר המיושן. ב"נתונים יקרים", מידי שבוע במשך שנה, השתמשנו בנתונים האישיים שלנו כדי להכיר זו את זו -- נתונים אישיים בנוגע לנושאים משותפים רגילים מדי שבוע החל ברגשות שלנו ועד האינטראקציות עם השותפים שלנו, ממחמאות שקיבלנו ועד לצלילי הסביבה שלנו. מידע אישי, שאותו שרטטנו ביד על פיסת נייר בגודל של גלויה ושלחנו מדי שבוע מלונדון לניו יורק, שם אני גרה, ומניו יורק ללונדון, שם היא גרה. חזית הגלויה היא רישום הנתונים, והצד האחורי של הגלויה מכיל כמובן את הכתובת של האדם האחר, ומקרא, כיצד יש לפרש את השרטוט. בשבוע הראשון של הפרויקט, בחרנו נושא קר ולא אישי. כמה פעמים בשבוע אנחנו בודקות מה השעה? זוהי החזית של הגלויה שלי, תוכלו לראות שכל סימון קטן מייצג את כל הפעמים שבהם בדקתי מה השעה, ממוקם לפי ימים ושעות באופן כרונולוגי -- אין כאן שום דבר מסובך. אבל אפשר לראות במקרא שהוספתי פרטים אנקדוטליים על אותן הפעמים. למעשה, הסימונים השונים מסמלים מדוע בדקתי מה השעה -- מה עשיתי אז. האם הייתי משועממת? האם הייתי רעבה? האם איחרתי? האם בדקתי במכוון או רק העפתי מבט בשעון כלאחר יד? וזה החלק החשוב -- ייצגתי את הפרטים אודות הימים שלי ואודות האישיות שלי באמצעות אוסף הנתונים שלי. השתמשתי בנתונים בתור עדשה או פילטר כדי לגלות או לחשוף, למשל, את החרדה התמידית שלי מפני איחור, למרות שאני תמיד מגיעה בזמן.
Stefanie and I spent one year collecting our data manually to force us to focus on the nuances that computers cannot gather -- or at least not yet -- using data also to explore our minds and the words we use, and not only our activities. Like at week number three, where we tracked the "thank yous" we said and were received, and when I realized that I thank mostly people that I don't know. Apparently I'm a compulsive thanker to waitresses and waiters, but I definitely don't thank enough the people who are close to me.
סטפני ואני השקענו שנה באיסוף ידני של הנתונים שלנו כדי לאלץ אותנו להתמקד בדקויות שמחשבים אינם יכולים לאסוף -- או לפחות עדיין אינם יכולים -- השתמשנו בנתונים גם כדי לחקור את החשיבה ואת המילים בהן השתמשנו, ולא רק את הפעילויות שלנו. כמו בשבוע מספר שלוש, שבו עקבנו אחרי ה"תודות" שאמרנו ושקיבלנו, כשהבנתי שאני מודה בעיקר לאנשים שאני לא מכירה. אני כנראה מודה כפייתית למלצריות ולמלצרים, אבל אני בהחלט לא מודה מספיק לאנשים הקרובים אליי.
Over one year, the process of actively noticing and counting these types of actions became a ritual. It actually changed ourselves. We became much more in tune with ourselves, much more aware of our behaviors and our surroundings. Over one year, Stefanie and I connected at a very deep level through our shared data diary, but we could do this only because we put ourselves in these numbers, adding the contexts of our very personal stories to them. It was the only way to make them truly meaningful and representative of ourselves.
במשך שנה שלמה, התהליך של תשומת לב פעילה וספירה של פעולות מסוג זה הפך לטקס. זה שינה אותנו. הפכנו קשובות הרבה יותר לעצמנו, מודעות הרבה יותר להתנהגויות שלנו ולסביבה שלנו. בחלוף שנה, סטפני ואני התחברנו בצורה עמוקה מאד דרך יומן הנתונים המשותף שלנו, אבל יכולנו לעשות זאת בגלל שהבאנו את עצמנו לתוך המספרים האלו, והוספנו את ההקשרים של הסיפורים האישיים שלנו לתוכם. זו היתה הדרך היחידה להפוך אותם למשמעותיים באמת ולמייצגים אותנו.
I am not asking you to start drawing your personal data, or to find a pen pal across the ocean. But I'm asking you to consider data -- all kind of data -- as the beginning of the conversation and not the end. Because data alone will never give us a solution. And this is why data failed us so badly -- because we failed to include the right amount of context to represent reality -- a nuanced, complicated and intricate reality. We kept looking at these two numbers, obsessing with them and pretending that our world could be reduced to a couple digits and a horse race, while the real stories, the ones that really mattered, were somewhere else.
אינני מבקשת מכם להתחיל לצייר את הנתונים האישיים שלכם, או למצוא חבר לעט מעבר לאוקיינוס. אבל אני מבקשת שתראו בנתונים -- כל סוגי הנתונים -- את תחילת השיחה ולא את סופה. מפני שנתונים לבדם לעולם לא יתנו לנו פתרון. זו הסיבה שהנתונים הכשילו אותנו כל כך -- כי לא הצלחנו להכניס את הכמות הנכונה של הקשר שנדרש לייצוגה של המציאות -- מציאות רבת דקויות, מורכבת וסבוכה. הסתכלנו רק על שני המספרים הללו, היינו אובססיביים לגביהם והעמדנו פנים שאפשר לצמצם את העולם שלנו לשני מספרים ולמירוץ סוסים, כאשר הסיפורים האמיתיים, אלו שחשובים באמת, נמצאו במקום אחר.
What we missed looking at these stories only through models and algorithms is what I call "data humanism." In the Renaissance humanism, European intellectuals placed the human nature instead of God at the center of their view of the world. I believe something similar needs to happen with the universe of data. Now data are apparently treated like a God -- keeper of infallible truth for our present and our future.
מה שהחמצנו כשהבטנו בסיפורים האלו רק דרך מודלים ואלגוריתמים הוא מה שאני מכנה "הומניזם של נתונים". בהומניזם של הרנסנס, משכילים אירופאיים הציבו את הטבע האנושי, ולא את אלוהים, במרכז השקפת העולם שלהם. אני מאמינה שמשהו דומה צריך להתרחש עם עולם הנתונים. כיום נראה שמתייחסים לנתונים כמו אל אלוהים -- שומר האמת הוודאית של ההווה והעתיד שלנו.
The experiences that I shared with you today taught me that to make data faithfully representative of our human nature and to make sure they will not mislead us anymore, we need to start designing ways to include empathy, imperfection and human qualities in how we collect, process, analyze and display them. I do see a place where, ultimately, instead of using data only to become more efficient, we will all use data to become more humane.
החוויות שחלקתי עמכם היום לימדו אותי שכדי שהנתונים ייצגו נאמנה את הטבע האנושי שלנו וכדי לוודא שהם לא יוליכו אותנו שולל שוב, עלינו לעצב דרכים לכלול אמפתיה, חוסר שלמות ותכונות אנושיות באופן שבו אנו אוספים, מעבדים, מנתחים ומציגים אותם. אני רואה מקום לכך, שבסופו של דבר, במקום להשתמש בנתונים רק כדי להיות יעילים יותר, כולנו נשתמש בנתונים כדי להיות אנושיים יותר.
Thank you.
תודה רבה.
(Applause)
(מחיאות כפיים)