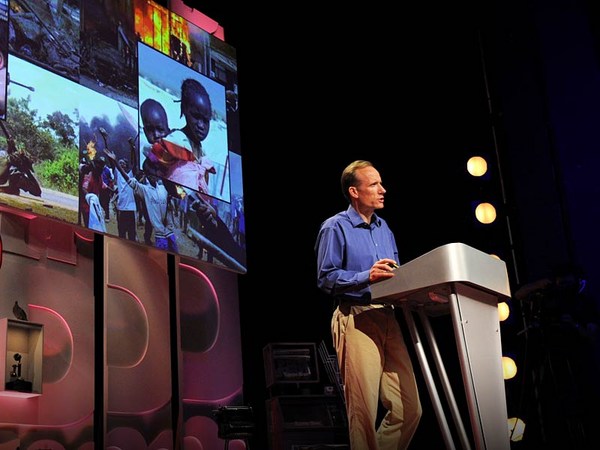
We look around the media, as we see on the news from Iraq, Afghanistan, Sierra Leone, and the conflict seems incomprehensible to us. And that's certainly how it seemed to me when I started this project. But as a physicist, I thought, well if you give me some data, I could maybe understand this. You know, give us a go.
看看我们的媒体,新闻中播放的那些关于伊拉 阿富汗、塞拉立昂 以及那些我们难以理解的冲突战争 当我开始这个项目时,我同样很难理解为什么会这样 但作为一名物理学者 我想,如果给我一些数据的话 我也许会理解。因此,我去尝试了一下
So as a naive New Zealander I thought, well I'll go to the Pentagon. Can you get me some information? (Laughter) No. So I had to think a little harder. And I was watching the news one night in Oxford. And I looked down at the chattering heads on my channel of choice. And I saw that there was information there. There was data within the streams of news that we consume. All this noise around us actually has information. So what I started thinking was, perhaps there is something like open source intelligence here. If we can get enough of these streams of information together, we can perhaps start to understand the war.
那么作为一名新西兰人 我想,应该去五角大楼吧! “能给我一些关于战争的数据吗?” (笑声) 不行?!嗯……看来我要另想办法了 有天晚上,我在牛津大学看新闻的时候 突然注意到电视荧幕下方 有一些滚动的数据信息 是关于当前所播新闻的数据信息 其实所有围绕在在我们身边的声音都是含有信息的 于是我想 或许还有类似“开源”的情报信息 如果我们能够收集到足够的信息 就能够理解战争的原因了
So this is exactly what I did. We started bringing a team together, an interdisciplinary team of scientists, of economists, mathematicians. We brought these guys together and we started to try and solve this. We did it in three steps. The first step we did was to collect. We did 130 different sources of information -- from NGO reports to newspapers and cable news. We brought this raw data in and we filtered it. We extracted the key bits on information to build the database. That database contained the timing of attacks, the location, the size and the weapons used. It's all in the streams of information we consume daily, we just have to know how to pull it out. And once we had this we could start doing some cool stuff. What if we were to look at the distribution of the sizes of attacks? What would that tell us?
以上就是我要做的事情。我们于是开始组建团队 一支跨学科的研究队伍 包括了经济学家以及数学家 我们将这些人组织到一起,开始尝试解决这个问题 我们将问题分成三步 第一步是收集信息。我们从130个不同的信息源 从非官方组织报道到新闻报纸、有线电视 从中提取原始数据并加以过滤 我们提取信息中的关键数据构建数据库 该数据库包括 进攻时间 位置、规模以及武器使用情况 信息全部取自于我们身边的各类媒体报道 我们只是将它们提取并加以总结 一旦我们收集好这些信息后,就可以做一些有趣的分析了 如果我们想看看攻击规模的分布的话 那么这个能告诉我们什么呢?
So we started doing this. And you can see here on the horizontal axis you've got the number of people killed in an attack or the size of the attack. And on the vertical axis you've got the number of attacks. So we plot data for sample on this. You see some sort of random distribution -- perhaps 67 attacks, one person was killed, or 47 attacks where seven people were killed. We did this exact same thing for Iraq. And we didn't know, for Iraq what we were going to find. It turns out what we found was pretty surprising. You take all of the conflict, all of the chaos, all of the noise, and out of that comes this precise mathematical distribution of the way attacks are ordered in this conflict. This blew our mind. Why should a conflict like Iraq have this as its fundamental signature? Why should there be order in war? We didn't really understand that. We thought maybe there is something special about Iraq. So we looked at a few more conflicts. We looked at Colombia, we looked at Afghanistan, and we looked at Senegal.
于是我们就开始了分析,看看大屏幕上这个图吧 在横轴上 显示的是攻击中的死亡人数 或者说是攻击的规模 纵轴上显示的是攻击的频率 我们将一些示例放到上面 看到的是近似于随机的分布 大概死亡人数为1人的攻击有67次 或死亡人数为7人的攻击有47次 我们对伊拉克的战争的数据做了类似的分析 但我们不知道,在关于伊拉克战争的数据中我们会发现什么 结果让我们大吃一惊 如果将所有的冲突 所有的骚乱、暴动 全部提取出 按照攻击规模排列显示,数据呈现出了这种分布 按照攻击规模排列显示,数据呈现出了这种分布 结果令我们非常兴奋 为什么伊拉克的冲突战争 会存在这样的基本特征呢? 为什么会产生如此的排列呢? 我们真的搞不懂了 可能伊拉克战争确实存在一些特殊性吧 我们来看看更多的冲突战争 这是哥伦比亚的情况、阿富汗的 这是塞内加尔的
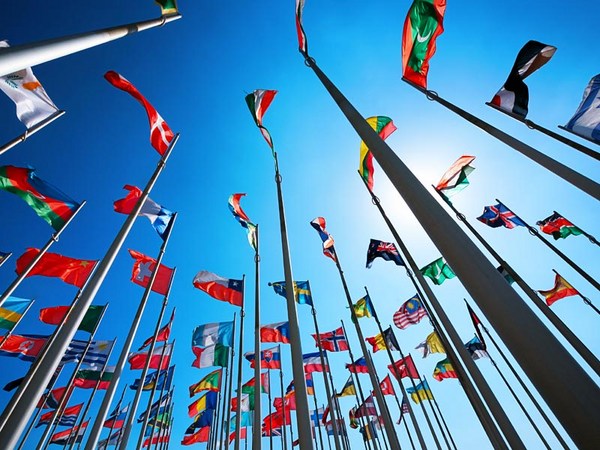
And the same pattern emerged in each conflict. This wasn't supposed to happen. These are different wars, with different religious factions, different political factions, and different socioeconomic problems. And yet the fundamental patterns underlying them are the same. So we went a little wider. We looked around the world at all the data we could get our hands on. From Peru to Indonesia, we studied this same pattern again. And we found that not only were the distributions these straight lines, but the slope of these lines, they clustered around this value of alpha equals 2.5. And we could generate an equation that could predict the likelihood of an attack. What we're saying here is the probability of an attack killing X number of people in a country like Iraq is equal to a constant, times the size of that attack, raised to the power of negative alpha. And negative alpha is the slope of that line I showed you before.
在这些冲突战争中全部呈现出相同的模式 这本是不应该发生的! 这些是不同的战争,不同的信仰冲突 不同的政治斗争,不同的社会经济问题 (所带来的战争) 但这些战争中的潜在的最根本的规率 却是一样的 所以我们要更进一步分析 看看我们周围的世界,我么能够掌握的所有数据 从秘鲁到印度尼西亚 我们发现了同样的规律 结果发现不仅仅 这些直线分布 而且这些线的斜率,都会围绕着 Alpha等于2.5这个值 于是我们可以生成一个等式 来预测攻击的可能性 也就是说 出现造成 X 人死亡的攻击的概率 在类似伊朗这样的国家 它等于一个常量,乘以攻击的规模 的负Alpha次方 负Alpha值就是刚才展示的那条直线的斜率
So what? This is data, statistics. What does it tell us about these conflicts? That was a challenge we had to face as physicists. How do we explain this? And what we really found was that alpha, if we think about it, is the organizational structure of the insurgency. Alpha is the distribution of the sizes of attacks, which is really the distribution of the group strength carrying out the attacks. So we look at a process of group dynamics: coalescence and fragmentation, groups coming together, groups breaking apart. And we start running the numbers on this. Can we simulate it? Can we create the kind of patterns that we're seeing in places like Iraq? Turns out we kind of do a reasonable job. We can run these simulations. We can recreate this using a process of group dynamics to explain the patterns that we see all around the conflicts around the world.
怎么样? 这个数据统计表,能告诉我们什么? 这是我们作为物理学者所面临的挑战 我们该如何解释这个数据? 假如我们真的找出了这个Alpha值 如果我们认真思考下,这是关于 叛乱的组织及结构 Alpha值作为攻击规模的分布 其实反映的是 发动袭击一方的强度分布 我们来看一个集团动态变化的过程 联合统一和各自为政 合久必分,分久必和 于是我们开始加以计算。我们能模拟(出结果)吗? 我们是否能创造出类似于伊拉克战争中 的规律吗? 结果看来我们好像做了一个合理的工作 我们可以模拟这些变化 我们可以使用集团的动态变化过程来重建这一过程 来解释在我们身边的冲突战争中 所显示出的这种基础模式
So what's going on? Why should these different -- seemingly different conflicts have the same patterns? Now what I believe is going on is that the insurgent forces, they evolve over time. They adapt. And it turns out there is only one solution to fight a much stronger enemy. And if you don't find that solution as an insurgent force, you don't exist. So every insurgent force that is ongoing, every conflict that is ongoing, it's going to look something like this. And that is what we think is happening.
那么,结果如何呢? 为什么这些看上去不同的冲突战争 会具有同样的模式呢? 现在我相信为什么了: 叛乱部队,随着时间的推移,他们适应了 结果就只有一种解决方案 就是与更强的敌人战斗 如果你找不到类似于叛乱部队这种敌人的话 那么你根本就不应该存在 因此每支现存的叛乱部队 每场正在进行的冲突战争 最后就会发展成这样 这正是我们通过该模式计算后会预料的。
Taking it forward, how do we change it? How do we end a war like Iraq? What does it look like? Alpha is the structure. It's got a stable state at 2.5. This is what wars look like when they continue. We've got to change that. We can push it up: the forces become more fragmented; there is more of them, but they are weaker. Or we push it down: they're more robust; there is less groups; but perhaps you can sit and talk to them.
如果把眼光放长,我们如何能改变(战争)呢? 我们怎样才能结束伊拉克战争? 看这个像什么? Alpha值是结构中的关键,它的值稳定在2.5 这是如果继续战争后所发生的情况 我们来试着调整这个值 我们将它提高 部队变得更加分散 人数变得更多,但攻击力减弱了 或者我们降低它 他们变得更加强悍,但集团减少了 但是也许可以坐下来和他们谈判
So this graph here, I'm going to show you now. No one has seen this before. This is literally stuff that we've come through last week. And we see the evolution of Alpha through time. We see it start. And we see it grow up to the stable state the wars around the world look like. And it stays there through the invasion of Fallujah until the Samarra bombings in the Iraqi elections of '06. And the system gets perturbed. It moves upwards to a fragmented state. This is when the surge happens. And depending on who you ask, the surge was supposed to push it up even further. The opposite happened. The groups became stronger. They became more robust. And so I'm thinking, right, great, it's going to keep going down. We can talk to them. We can get a solution. The opposite happened. It's moved up again. The groups are more fragmented. And this tells me one of two things. Either we're back where we started and the surge has had no effect; or finally the groups have been fragmented to the extent that we can start to think about maybe moving out. I don't know what the answer is to that. But I know that we should be looking at the structure of the insurgency to answer that question. Thank you. (Applause)
因此这张图表,我将要展示给你们的是 在此之前,没有人看过。 这是我们上周刚刚计算出来的。 我们能够看到Alpha值的演变过程 看开始时候的情况。它一直慢慢增加到稳定到2.5左右 正如同身边战争中的情况 在入侵Falusia期间,Alpha值没有发生变化 直到2006年伊拉克大选时发生的 萨迈拉炸弹袭击事件 整个系统变得越来越不安全,Alpha值 变化到一个分散的状态 此时美国宣布开始向伊拉克派出增援部队 当然这取决谁问你 理论上讲,增援应该将Alpha值进一步增高 结果相反的情况发生 集团变得越来越强大 他们变得越来越野蛮 看来我猜对了。Alpha应该进一步地降低 我们能够与他们对话,能够商讨解决方案。结果相反的情况发生了 Alpha值又上升了,集团变得更加分散 这张图表告诉我两件事情 无论我们返回起点 或派出增援都没有产生预期效果 最终集团都会变得更加分散 我们是否应该开始考虑撤军了 我不知道具体的答案 但我知道我们应该好好看看叛乱的结构 再来回答这个问题 谢谢 (掌声)