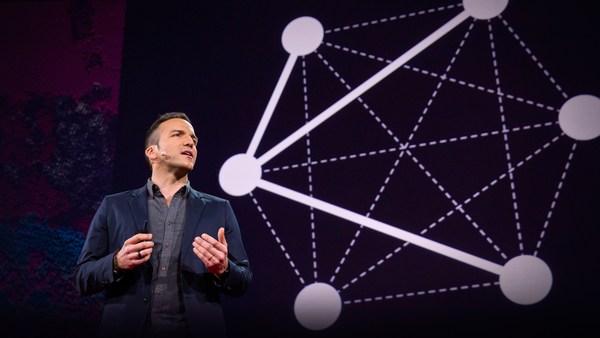
So I'm an artist, but a little bit of a peculiar one. I don't paint. I can't draw. My shop teacher in high school wrote that I was a menace on my report card. You probably don't really want to see my photographs. But there is one thing I know how to do: I know how to program a computer. I can code.
Jag är konstnär, men en lite märklig sådan. Jag målar inte. Jag kan inte rita. Min bildlärare på gymnasiet skrev att jag var en odåga på mitt betyg. Ni vill förmodligen egentligen inte se mina foton. Men det finns en grej jag kan: Jag vet hur man programmerar en dator. Jag kan koda.
And people will tell me that 100 years ago, folks like me didn't exist, that it was impossible, that art made with data is a new thing, it's a product of our age, it's something that's really important to think of as something that's very "now." And that's true.
Och folk säger att för 100 år sedan, fanns inte människor som jag, att det var omöjligt, att konst gjord av data är nåt nytt, en produkt av vår tid, att det är något väldigt viktigt att tänka på som väldigt "nu". Och det är sant.
But there is an art form that's been around for a very long time that's really about using information, abstract information, to make emotionally resonant pieces. And it's called music. We've been making music for tens of thousands of years, right? And if you think about what music is -- notes and chords and keys and harmonies and melodies -- these things are algorithms. These things are systems that are designed to unfold over time, to make us feel. I came to the arts through music. I was trained as a composer, and about 15 years ago, I started making pieces that were designed to look at the intersection between sound and image, to use an image to unveil a musical structure or to use a sound to show you something interesting about something that's usually pictorial.
Men det finns en konstform som funnits väldigt länge, som handlar om att använda information, abstrakt information, för att skapa känsloväckande verk. Den kallas musik. Vi har skapat musik i tiotusentals år, eller hur? Och om du tänker på vad musik är - noter, ackord, tonarter, harmonier och melodier - alla dessa är algoritmer. De är system designade för att utvecklas över tiden, för att få oss att känna. Jag kom till konsten via musik. Jag är utbildad kompositör, och för ungefär 15 år sedan började jag skapa verk som var designade för att titta på korsningen mellan ljud och bild, att använda en bild för att avslöja en musikalisk struktur eller att använda ljud för att visa något intressant med något som vanligtvis är bildligt.
So what you're seeing on the screen is literally being drawn by the musical structure of the musicians onstage, and there's no accident that it looks like a plant, because the underlying algorithmic biology of the plant is what informed the musical structure in the first place. So once you know how to do this, once you know how to code with media, you can do some pretty cool stuff.
Så det ni ser på skärmen ritas bokstavligt talat av den musikaliska strukturen hos musikerna på scenen, och det är ingen slump att det ser ut som en växt, för växtens underliggande algoritmiska biologi är det som präglade den musikaliska strukturen från första början. När man vet hur man gör detta, när man vet hur man kodar med media, kan man göra rätt så häftiga grejer.
This is a project I did for the Sundance Film Festival. Really simple idea: you take every Academy Award Best Picture, you speed it up to one minute each and string them all together. And so in 75 minutes, I can show you the history of Hollywood cinema. And what it really shows you is the history of editing in Hollywood cinema. So on the left, we've got Casablanca; on the right, we've got Chicago. And you can see that Casablanca is a little easier to read. That's because the average length of a cinematic shot in the 1940s was 26 seconds, and now it's around six seconds.
Det här är ett projekt jag gjorde för Sundance Film Festival. En väldigt enkel idé: ta alla filmer som vunnit en Oscar för bästa film, dra upp hastigheten till en minut vardera och länka ihop dem. På 75 minuter kan jag visa er Hollywoods filmhistoria. Och vad ni egentligen ser är klippningens historia i Hollywood. Till vänster har vi Casablanca, till höger har vi Chicago. Ni ser att Casablanca är lite lättare att läsa. Det beror på att medellängden för ett filmklipp på 1940-talet var 26 sekunder, nu är det ungefär sex sekunder.
This is a project that was inspired by some work that was funded by the US Federal Government in the early 2000s, to look at video footage and find a specific actor in any video. And so I repurposed this code to train a system on one person in our culture who would never need to be surveilled in that manner, which is Britney Spears. I downloaded 2,000 paparazzi photos of Britney Spears and trained my computer to find her face and her face alone. I can run any footage of her through it and will center her eyes in the frame, and this sort of is a little double commentary about surveillance in our society. We are very fraught with anxiety about being watched, but then we obsess over celebrity.
Det här är ett projekt inspirerat av arbete som finansierades av den amerikanska regeringen under tidigt 2000-tal, för att se på filmmaterial och hitta en specifik skådespelare i det. Jag omarbetade koden för att lära systemet hitta en person i vår kultur som aldrig skulle behöva bli övervakad på det viset, nämligen Britney Spears. Jag laddade ner 2 000 paparazzifoton på Britney Spears och lärde min dator att hitta hennes ansikte och inget annat. Jag kan köra vilket klipp som helst, hennes ögon kommer att centreras, och det är en slags dubbel kommentar till övervakningen i vårt samhälle. Vi är fyllda av oro över att bli betraktade, men sedan är vi besatta av kändisar.
What you're seeing on the screen here is a collaboration I did with an artist named Lián Amaris. What she did is very simple to explain and describe, but very hard to do. She took 72 minutes of activity, getting ready for a night out on the town, and stretched it over three days and performed it on a traffic island in slow motion in New York City. I was there, too, with a film crew. We filmed the whole thing, and then we reversed the process, speeding it up to 72 minutes again, so it looks like she's moving normally and the whole world is flying by.
Det ni ser på skärmen är ett samarbete jag gjorde med en konstnär vid namn Lián Amaris. Det hon gjorde är väldigt enkelt att förklara och beskriva, men väldigt svårt att göra. Hon tog 72 minuter av aktivitet, att göra sig redo för en kväll på stan, drog ut det över tre dagar och framförde det på en refug i slow motion i New York City. Jag var också där, med ett filmteam. Vi filmade alltihop, och sedan vände vi på processen och drog upp det till 72 minuter igen så att hon ser ut att röra sig normalt medan hela världen rusar förbi.
At a certain point, I figured out that what I was doing was making portraits. When you think about portraiture, you tend to think about stuff like this. The guy on the left is named Gilbert Stuart. He's sort of the first real portraitist of the United States. And on the right is his portrait of George Washington from 1796. This is the so-called Lansdowne portrait. And if you look at this painting, there's a lot of symbolism, right? We've got a rainbow out the window. We've got a sword. We've got a quill on the desk. All of these things are meant to evoke George Washington as the father of the nation.
Vid en viss punkt listade jag ut att det jag gjorde var att skapa porträtt. När man tänker på porträttmålning tänker man ofta på sånt här. Killen till vänster heter Gilbert Stuart. Han var typ den första riktiga porträttmålaren i USA. Till höger är hans porträtt av George Washington, från 1796. Det så kallade Lansdowne-porträttet. Om ni tittar på den här målningen så innehåller den mycket symbolism. Regnbågen utanför fönstret. Ett svärd. En fjäderpenna på skrivbordet. Alla dessa saker ska frammana George Washington som nationens fader.
This is my portrait of George Washington. And this is an eye chart, only instead of letters, they're words. And what the words are is the 66 words in George Washington's State of the Union addresses that he uses more than any other president. So "gentlemen" has its own symbolism and its own rhetoric. And it's really kind of significant that that's the word he used the most. This is the eye chart for George W. Bush, who was president when I made this piece. And how you get there, from "gentlemen" to "terror" in 43 easy steps, tells us a lot about American history, and gives you a different insight than you would have looking at a series of paintings. These pieces provide a history lesson of the United States through the political rhetoric of its leaders. Ronald Reagan spent a lot of time talking about deficits. Bill Clinton spent a lot of time talking about the century in which he would no longer be president, but maybe his wife would be. Lyndon Johnson was the first President to give his State of the Union addresses on prime-time television; he began every paragraph with the word "tonight." And Richard Nixon, or more accurately, his speechwriter, a guy named William Safire, spent a lot of time thinking about language and making sure that his boss portrayed a rhetoric of honesty.
Detta är mitt porträtt av George Washington. Och detta är en syntavla, men istället för bokstäver är det ord. Och orden är de 66 ord i George Washingtons tal till nationen som han använder mer än någon annan president. "Gentlemen" har sin egen symbolik och retorik. Och det är rätt så signifikant att det är det ord han använde mest. Det här är George W. Bushs syntavla, han var president när jag skapade det här verket. Och hur man kommer dit, från "gentlemen" till "terror" med 43 enkla steg, säger en hel del om amerikansk historia, och ger en annan insikt än man skulle få genom att titta på ett antal målningar. Dessa verk ger en amerikansk historielektion genom dess politiska ledares retorik. Ronald Reagan la en hel del tid på att prata om underskott. Bill Clinton pratade mycket om det århundrade då han inte längre skulle vara president, men kanske hans fru. Lyndon Johnson var den första presidenten som höll tal till nationen på bästa TV-tid; han började varje stycke med "ikväll." Och Richard Nixon, eller rättare sagt hans talskrivare, William Safire, la mycket tid på att tänka på språket och försäkra att hans chef förmedlade en ärlig retorik.
This project is shown as a series of monolithic sculptures. It's an outdoor series of light boxes. And it's important to note that they're to scale, so if you stand 20 feet back and you can read between those two black lines, you have 20/20 vision.
Det här projektet visas som en serie monolitiska skulpturer. Det är en rad med ljuslådor utomhus. Och det är viktigt att notera att de är skalenliga, så om man står 20 fot bakom och kan läsa mellan de svarta raderna, har man perfekt syn.
(Laughter)
(Skratt)
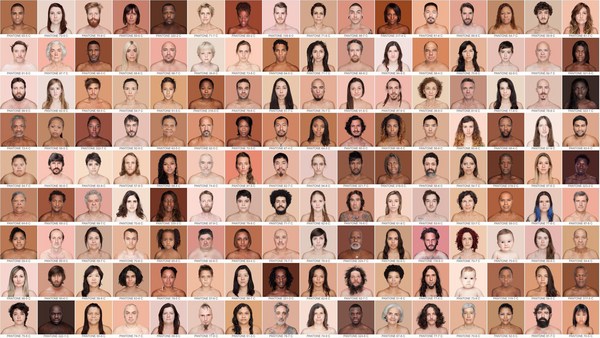
This is a portrait. And there's a lot of these. There's a lot of ways to do this with data. I started looking for a way to think about how I can do a more democratic form of portraiture, something that's more about my country and how it works. Every 10 years, we make a census in the United States. We literally count people, find out who lives where, what kind of jobs we've got, the language we speak at home. And this is important stuff -- really important stuff. But it doesn't really tell us who we are. It doesn't tell us about our dreams and our aspirations.
Detta är ett porträtt. Och det finns många såna. Det finns många sätt att göra detta på med data. Jag började leta ett sätt att fundera på hur jag kan göra ett mer demokratiskt porträtt, något som handlar mer om mitt land och hur det funkar. Vart tionde år gör vi en folkräkning i USA. Vi räknar folk, bokstavligen, tar reda på vem som bor var, vilka jobb vi har, vilket språk vi pratar hemma. Och det är viktiga grejer - riktigt viktiga grejer. Men det säger inte riktigt vilka vi är. Det säger inget om våra drömmar och vår längtan.
And so in 2010, I decided to make my own census. And I started looking for a corpus of data that had a lot of descriptions written by ordinary Americans. And it turns out that there is such a corpus of data that's just sitting there for the taking. It's called online dating.
Så 2010 bestämde jag mig för att göra en egen folkräkning. Jag började leta efter en samling av data som hade många beskrivningar skrivna av vanliga amerikaner. Det visade sig att det finns en sådan datasamling redo att plocka information ur. Den kallas nätdejting.
So in 2010, I joined 21 different online dating services, as a gay man, a straight man, a gay woman and a straight woman, in every zip code in America and downloaded about 19 million people's dating profiles -- about 20 percent of the adult population of the United States. I have obsessive-compulsive disorder. This is going to become really freaking obvious. Just go with me.
Så 2010 registrerade jag mig på 21 olika nätdejtingsidor, som homosexuell man, heteroman, homosexuell kvinna och heterokvinna, i varje postnummer i Amerika, och laddade ner ungefär 19 miljoner dejtingprofiler - ungefär 20 procent av USAs vuxna befolkning. Jag lider av tvångssyndrom. Det kommer att bli väldigt tydligt. Häng bara med.
(Laughter)
(Skratt)
So what I did was I sorted all this stuff by zip code. And I looked at word analysis. These are some dating profiles from 2010 with the word "lonely" highlighted. If you look at these things topographically, if you imagine dark colors to light colors are more use of the word, you can see that Appalachia is a pretty lonely place. You can also see that Nebraska ain't that funny. This is the kinky map, so what this is showing you is that the women in Alaska need to get together with the men in southern New Mexico, and have a good time. And I have this at a pretty granular level, so I can tell you that the men in the eastern half of Long Island are way more interested in being spanked than men in the western half of Long Island. This will be your one takeaway from this whole conference. You're going to remember that fact for, like, 30 years.
Så det jag gjorde var att sortera allt detta på postnummer. Och så gjorde jag en ordanalys. Det här är några profiler från 2010 med ordet "ensam" markerat. Om man tittar på detta topografiskt, och föreställer sig att mörkt till ljust är mer användning av ordet, så ser man att Appalacherna är ett ganska ensamt ställe. Man ser också att Nebraska inte är så himla kul. Det här är kinky-kartan, det den visar är att kvinnorna i Alaska borde träffa männen i södra New Mexico och ha lite kul. Jag har detta på ganska detaljerad nivå, så jag kan säga att männen på östra sidan av Long Island är mycket mer intresserade av smisk än männen på den västra sidan av Long Island. Det kommer vara det enda ni tar med er från hela konferensen. Ni kommer minnas det i typ 30 år.
(Laughter)
(Skratt)
When you bring this down to a cartographic level, you can make maps and do the same trick I was doing with the eye charts. You can replace the name of every city in the United States with the word people use more in that city than anywhere else. If you've ever dated anyone from Seattle, this makes perfect sense. You've got "pretty." You've got "heartbreak." You've got "gig." You've got "cigarette." They play in a band and they smoke. And right above that you can see "email." That's Redmond, Washington, which is the headquarters of the Microsoft Corporation. Some of these you can guess -- so, Los Angeles is "acting" and San Francisco is "gay." Some are a little bit more heartbreaking. In Baton Rouge, they talk about being curvy; downstream in New Orleans, they still talk about the flood. Folks in the American capital will say they're interesting. People in Baltimore, Maryland, will say they're afraid. This is New Jersey. I grew up somewhere between "annoying" and "cynical."
När man tar ner det på kartografisk nivå, kan man göra samma trick som jag gjorde med syntavlorna. Man kan byta ut namnet på varenda stad i USA mot det ord folk använder mer i den staden än någon annanstans. Har du nånsin dejtat någon från Seattle så låter det nog helt logiskt. Vi har "söt," vi har "hjärtesorg." Vi har "gig," vi har "cigarett." De spelar i band och de röker. Och just ovanför ser ni "e-post." Det är Redmond, Washington, huvudkontoret för Microsoft Corporation. En del kan man gissa sig till - Los Angeles är "skådespeleri" och San Francisco är "homosexuell." En del är lite mer hjärtslitande. I Baton Rouge pratar de om att vara kurvig; i New Orleans pratar de fortfarande om översvämningen. Folk i huvudstaden säger att de är intressanta. Folk i Baltimore, Maryland, säger att de är rädda. Detta är New Jersey. Jag växte upp nånstans mellan "irriterande" och "cynisk."
(Laughter) (Applause)
(Skratt) (Applåder)
And New York City's number one word is "now," as in, "Now I'm working as a waiter, but actually I'm an actor."
Och New York Citys främsta ord är "nu," som i "Just nu jobbar jag som servitör, men egentligen är jag skådis."
(Laughter)
(Skratt)
Or, "Now I'm a professor of engineering at NYU, but actually I'm an artist." If you go upstate, you see "dinosaur." That's Syracuse. The best place to eat in Syracuse, New York, is a Hell's Angels barbecue joint called Dinosaur Barbecue. That's where you would take somebody on a date. I live somewhere between "unconditional" and "midsummer," in Midtown Manhattan. And this is gentrified North Brooklyn, so you've got "DJ" and "glamorous" and "hipsters" and "urbane." So that's maybe a more democratic portrait. And the idea was, what if we made red-state and blue-state maps based on what we want to do on a Friday night?
Eller, "Nu är jag professor på NYU, men egentligen är jag konstnär." Går man norrut så ser man "dinosaurie." Det är Syracuse. Det bästa matstället i Syracuse, New York, är ett Hell's Angels-ställe som heter Dinosaur Barbecue. Dit tar man med någon på dejt. Jag bor nånstans mellan "ovillkorlig" och "midsommar", i centrala Manhattan. Och det här är gentrifierade North Brooklyn, så vi har "DJ," och "glamorös" och "hipsters" och "världsvan." Så det är kanske ett mer demokratiskt porträtt. Tanken var att göra kartor av röda och blå stater baserat på vad vi vill göra på en fredagkväll?
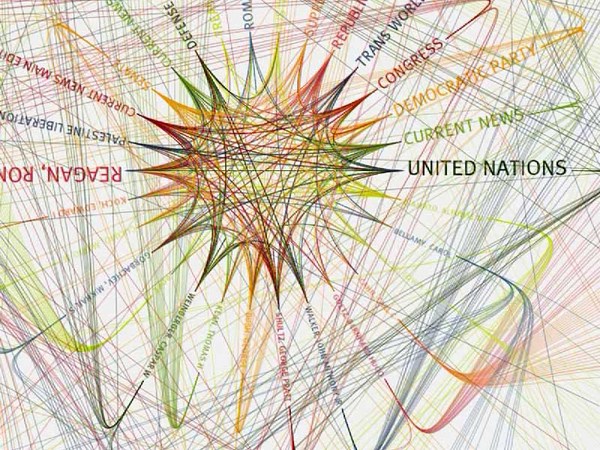
This is a self-portrait. This is based on my email, about 500,000 emails sent over 20 years. You can think of this as a quantified selfie. So what I'm doing is running a physics equation based on my personal data. You have to imagine everybody I've ever corresponded with. It started out in the middle and it exploded with a big bang. And everybody has gravity to one another, gravity based on how much they've been emailing, who they've been emailing with. And it also does sentimental analysis, so if I say "I love you," you're heavier to me. And you attract to my email addresses in the middle, which act like mainline stars. And all the names are handwritten.
Det här är ett självporträtt. Det är baserat på min e-post, ungefär 500 000 e-postmeddelanden skickade under 20 års tid. Se det som en kvantifierad selfie. Det jag gör är att köra en fysikekvation baserat på mina personliga data. Föreställ er alla som jag nånsin har korresponderat med. Det började i mitten och exploderade med en big bang. Och alla graviterar mot varandra, baserat på hur mycket de har e-postat och vem de har e-postat med. Den gör också en känsloanalys, om jag säger "Jag älskar dig" så väger du tyngre. Och du dras till mina adresser i mitten, som fungerar som knutpunkter. Och alla namn är handskrivna.
Sometimes you do this data and this work with real-time data to illuminate a specific problem in a specific city. This is a Walther PPK 9mm semiautomatic handgun that was used in a shooting in the French Quarter of New Orleans about two years ago on Valentine's Day in an argument over parking. Those are my cigarettes. This is the house where the shooting took place. This project involved a little bit of engineering. I've got a bike chain rigged up as a cam shaft, with a computer driving it. That computer and the mechanism are buried in a box. The gun's on top welded to a steel plate. There's a wire going through to the trigger, and the computer in the box is online. It's listening to the 911 feed of the New Orleans Police Department, so that anytime there's a shooting reported in New Orleans,
Ibland gör man data och det här arbetet med realtidsdata för att belysa ett särskilt problem i en specifik stad. Detta är en Walther PPK 9mm halvautomatisk pistol som användes vid en skottlossning i New Orleans franska kvarter för två år sedan på Alla hjärtans dag vid ett bråk om parkering. Det där är mina cigaretter. Detta är huset där skottlossningen ägde rum. Det här projektet krävde lite ingenjörskonst. Jag har en cykelkedja riggad som kamaxel, och en dator som driver den. Datorn och mekanismen är gömda i en låda. Pistolen är ovanpå, fastsvetsad i en stålplatta. En vajer går genom avtryckaren, och datorn i lådan är online. Den lyssnar på nödsamtalen till New Orleans-polisen, så att varje gång en skottlossning rapporteras i New Orleans,
(Gunshot sound)
(Ljud av pistolskott)
the gun fires. Now, there's a blank, so there's no bullet. There's big light, big noise and most importantly, there's a casing. There's about five shootings a day in New Orleans, so over the four months this piece was installed, the case filled up with bullets. You guys know what this is -- you call this "data visualization." When you do it right, it's illuminating. When you do it wrong, it's anesthetizing. It reduces people to numbers. So watch out.
avfyras pistolen. Det är ett löst skott, så det finns ingen kula. Det är ett starkt ljus, högt ljud och viktigast av allt, en hylsa. Det sker fem gånger om dagen i New Orleans, så under de fyra månader som verket var uppställt, fylldes lådan med kulor. Ni vet vad detta är - det kallas "datavisualisering." När man gör det rätt är det upplysande. När man gör det fel är det sövande. Det reducerar människor till siffror. Så se upp.
One last piece for you. I spent the last summer as the artist in residence for Times Square. And Times Square in New York is literally the crossroads of the world. One of the things people don't notice about it is it's the most Instagrammed place on Earth. About every five seconds, someone commits a selfie in Times Square. That's 17,000 a day, and I have them all.
Ett sista verk för er. Jag tillbringade förra sommaren som huskonstnär för Times Square. Times Square i New York är bokstavligt talat världens korsning. En sak folk inte lägger märke till är att det är den mest instagrammade platsen på jorden. Ungefär var femte sekund postar någon en selfie från Times Square. Det är 17 000 om dagen, och jag har dem allihopa.
(Laughter)
(Skratt)
These are some of them with their eyes centered.
Det här är några, med ögonen centrerade.
Every civilization, will use the maximum level of technology available to make art. And it's the responsibility of the artist to ask questions about what that technology means and how it reflects our culture.
Varje civilisation kommer att använda all tillgänglig teknik för att skapa konst. Och det är konstnärens ansvar att ställa frågor om vad den tekniken innebär och hur den speglar vår kultur.
So I leave you with this: we're more than numbers. We're people, and we have dreams and ideas. And reducing us to statistics is something that's done at our peril.
Så jag lämnar er med detta: Vi är mer än bara siffror. Vi är människor, vi har drömmar och idéer. Att reducera oss till statistik är något som görs på vår egen risk.
Thank you very much.
Tack så mycket.
(Applause)
(Applåder)