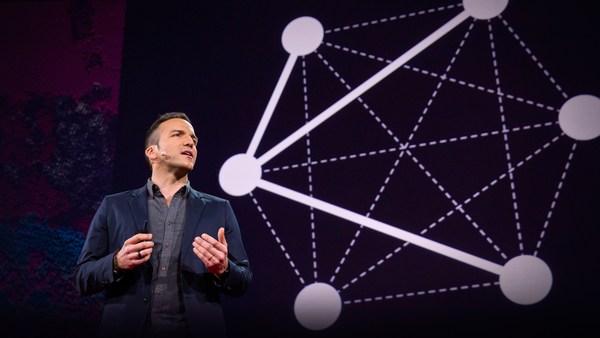
So I'm an artist, but a little bit of a peculiar one. I don't paint. I can't draw. My shop teacher in high school wrote that I was a menace on my report card. You probably don't really want to see my photographs. But there is one thing I know how to do: I know how to program a computer. I can code.
Ik ben een kunstenaar, maar een beetje een bijzondere. Ik schilder niet. Ik kan niet tekenen. Op de middelbare school schreef mijn leraar Tecniek op mijn rapport dat ik een gevaar was. Je wilt de foto's die ik maak waarschijnlijk ook niet echt zien. Maar er is één ding dat ik goed kan: een computer programmeren. Ik kan coderen.
And people will tell me that 100 years ago, folks like me didn't exist, that it was impossible, that art made with data is a new thing, it's a product of our age, it's something that's really important to think of as something that's very "now." And that's true.
En mensen zullen zeggen dat 100 jaar geleden mensen als ik niet bestonden, dat het onmogelijk was, dat kunst maken met data iets nieuws is, een product van onze tijd, iets waarvan het erg belangrijk is om het te zien als iets dat erg 'nu' is. En dat is waar.
But there is an art form that's been around for a very long time that's really about using information, abstract information, to make emotionally resonant pieces. And it's called music. We've been making music for tens of thousands of years, right? And if you think about what music is -- notes and chords and keys and harmonies and melodies -- these things are algorithms. These things are systems that are designed to unfold over time, to make us feel. I came to the arts through music. I was trained as a composer, and about 15 years ago, I started making pieces that were designed to look at the intersection between sound and image, to use an image to unveil a musical structure or to use a sound to show you something interesting about something that's usually pictorial.
Maar er is een kunstvorm die al erg lang bestaat die draait om het gebruiken van informatie, abstracte informatie, om daar stukken mee te maken met een emotionele weerklank. Dat is muziek. We maken al tienduizenden jaren muziek, nietwaar? En als je je bedenkt wat muziek is -- noten en akkoorden en sleutels en harmonieën en melodieën -- het zijn algoritmes. Het zijn systemen die gemaakt zijn om zich in de tijd te ontvouwen om ons iets te laten voelen. Muziek bracht me bij kunst. Ik ben opgeleid als componist en 15 jaar geleden begon ik stukken te maken die het snijpunt tussen beeld en geluid zouden moeten belichten, waarin ik beeld gebruikte om een muzikale structuur bloot te leggen of een geluid gebruikte om iets interessants te laten zien van iets dat meestal een illustratie is.
So what you're seeing on the screen is literally being drawn by the musical structure of the musicians onstage, and there's no accident that it looks like a plant, because the underlying algorithmic biology of the plant is what informed the musical structure in the first place. So once you know how to do this, once you know how to code with media, you can do some pretty cool stuff.
Wat je op het scherm ziet, wordt letterlijk getekend door de muzikale constructie van de musici op het toneel en het is geen toeval dat het er als een plant uitziet, want de onderliggende algoritmische biologie van de plant vormde ook de oorspronkelijke inspiratie voor dit stuk muziek. Als je eenmaal weet hoe je dit moet doen, als je weet hoe je met media kan coderen, kan je gave dingen doen.
This is a project I did for the Sundance Film Festival. Really simple idea: you take every Academy Award Best Picture, you speed it up to one minute each and string them all together. And so in 75 minutes, I can show you the history of Hollywood cinema. And what it really shows you is the history of editing in Hollywood cinema. So on the left, we've got Casablanca; on the right, we've got Chicago. And you can see that Casablanca is a little easier to read. That's because the average length of a cinematic shot in the 1940s was 26 seconds, and now it's around six seconds.
Dit is een project dat ik voor het Sundance Film Festival uitvoerde. Het idee was simpel: je neemt elke winnaar van de Academy Award Best Picture, je versnelt het tot een minuut per film en rijgt ze allemaal aan elkaar. Zo kan ik je in 75 minuten de geschiedenis van Hollywoodfilms tonen. Wat het erg duidelijk laat zien is de geschiedenis van montage in Hollywoodfilms. Links zie je Casablanca; rechts zie je Chicago. Je ziet dat Casablanca veel makkelijker te bekijken is. Dat komt omdat de gemiddelde lengte van cinematografische shots in de jaren 40 26 seconden was, terwijl het nu rond de zes seconden is.
This is a project that was inspired by some work that was funded by the US Federal Government in the early 2000s, to look at video footage and find a specific actor in any video. And so I repurposed this code to train a system on one person in our culture who would never need to be surveilled in that manner, which is Britney Spears. I downloaded 2,000 paparazzi photos of Britney Spears and trained my computer to find her face and her face alone. I can run any footage of her through it and will center her eyes in the frame, and this sort of is a little double commentary about surveillance in our society. We are very fraught with anxiety about being watched, but then we obsess over celebrity.
Dit project werd geïnspireerd door werk dat was gefiancieerd door de Amerikaanse overheid in het begin van 2000, om naar videomateriaal te kijken en er een specifieke acteur in te vinden. Ik gaf deze code een nieuwe functie om een systeem op te zetten dat zich op een persoon zou richten die je nooit hoeft te zoeken: Britney Spears. Ik downloadde 2.000 paparazzifoto's van Britney Spears en trainde mijn computer haar gezicht te vinden, niemand anders. Ik kan elk materiaal van haar invoeren en het centreert haar ogen in het frame; het is een soort dubbel commentaar op surveillance in onze maatschappij. We zijn doodsbang dat we bekeken worden, maar we zijn geobsedeerd door beroemdheden.
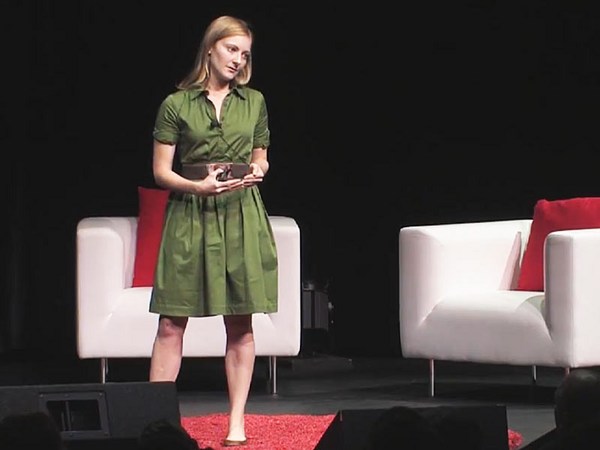
What you're seeing on the screen here is a collaboration I did with an artist named Lián Amaris. What she did is very simple to explain and describe, but very hard to do. She took 72 minutes of activity, getting ready for a night out on the town, and stretched it over three days and performed it on a traffic island in slow motion in New York City. I was there, too, with a film crew. We filmed the whole thing, and then we reversed the process, speeding it up to 72 minutes again, so it looks like she's moving normally and the whole world is flying by.
Wat je nu ziet is een samenwerking van mij en een kunstenaar genaamd Lián Amaris. Zij deed iets dat heel makkelijk uit te leggen en te beschrijven is, maar moeilijk is om te doen. Ze nam 72 minuten activiteit -- zich klaarmaken voor een date, voor een avond uit -- en spreidde dit uit over drie dagen en voerde dit in slow motion op op een verkeerseiland in New York. Ik was daar ook, met een filmploeg. We filmden alles en draaiden het proces om, zodat het weer 72 minuten in beslag nam, waardoor het lijkt alsof ze normaal beweegt en de hele wereld langs haar heen vliegt.
At a certain point, I figured out that what I was doing was making portraits. When you think about portraiture, you tend to think about stuff like this. The guy on the left is named Gilbert Stuart. He's sort of the first real portraitist of the United States. And on the right is his portrait of George Washington from 1796. This is the so-called Lansdowne portrait. And if you look at this painting, there's a lot of symbolism, right? We've got a rainbow out the window. We've got a sword. We've got a quill on the desk. All of these things are meant to evoke George Washington as the father of the nation.
Op een gegeven moment kreeg ik door dat ik portretten aan het maken was. Als je aan portretten denkt, ben je geneigd aan deze dingen te denken. De man links is Gilbert Stuart. Hij is de eerste echte portretschilder van de Verenigde Staten. En rechts zie je zijn portret van George Washington in 1796. Dit is het zogenaamde Landsdowne-portret. Als je naar dit schilderij kijkt, zie je een hoop symbolisme, zie je? We hebben een regenboog buiten. We hebben een zwaard. Een ganzenveer op het bureau. Al deze dingen hebben tot doel George Washington tot vader van de natie uit te roepen.
This is my portrait of George Washington. And this is an eye chart, only instead of letters, they're words. And what the words are is the 66 words in George Washington's State of the Union addresses that he uses more than any other president. So "gentlemen" has its own symbolism and its own rhetoric. And it's really kind of significant that that's the word he used the most. This is the eye chart for George W. Bush, who was president when I made this piece. And how you get there, from "gentlemen" to "terror" in 43 easy steps, tells us a lot about American history, and gives you a different insight than you would have looking at a series of paintings. These pieces provide a history lesson of the United States through the political rhetoric of its leaders. Ronald Reagan spent a lot of time talking about deficits. Bill Clinton spent a lot of time talking about the century in which he would no longer be president, but maybe his wife would be. Lyndon Johnson was the first President to give his State of the Union addresses on prime-time television; he began every paragraph with the word "tonight." And Richard Nixon, or more accurately, his speechwriter, a guy named William Safire, spent a lot of time thinking about language and making sure that his boss portrayed a rhetoric of honesty.
Dit is mijn portret van George Washington. Het is een letterbord, met woorden in plaats van letters. En deze woorden zijn de 66 woorden uit George Washington's State of the Union toespraken die hij vaker gebruikte dan welke president ook. 'Gentlemen' heeft zijn eigen symboliek en retoriek. En het is van belang dat hij dat woord het meest gebruikte. Dit is het letterbord voor George W. Bush, die president was toen ik dit maakte. En hoe je daar komt, in 43 makkelijke stappen van 'gentlemen' tot 'terreur', vertelt een hoop over de Amerikaanse geschiedenis en geeft je andere inzichten dan wanneer je naar een serie schilderijen kijkt. Deze werken zijn een geschiedenisles over de Verenigde Staten langs de politieke retoriek van diens leiders. Ronald Reagan besteedde veel tijd aan het praten over tekorten. Bill Clinton sprak vaak over de eeuw waarin hij geen president meer zou zijn, maar zijn vrouw misschien wel. Lyndon Jonson was de eerste president die zijn State of the Union-toespraak live op televisie hield; hij begon elke paragraaf met het woord 'vanavond'. En Richard Nixon, of eigenlijk zijn schrijver, een man genaamd William Safire, dacht veel over de taal na om er zeker van te zijn dat zijn baas eerlijk overkwam.
This project is shown as a series of monolithic sculptures. It's an outdoor series of light boxes. And it's important to note that they're to scale, so if you stand 20 feet back and you can read between those two black lines, you have 20/20 vision.
Dit project is tentoongesteld als een serie monolitische sculpturen. Het is een serie van lichtkasten die buiten staan. Merk op dat ze op maat zijn, dus als je er 6 meter af staat en tussen de twee zwarte lijnen kan lezen, heb je een normaal gezichtsvermogen.
(Laughter)
(Gelach)
This is a portrait. And there's a lot of these. There's a lot of ways to do this with data. I started looking for a way to think about how I can do a more democratic form of portraiture, something that's more about my country and how it works. Every 10 years, we make a census in the United States. We literally count people, find out who lives where, what kind of jobs we've got, the language we speak at home. And this is important stuff -- really important stuff. But it doesn't really tell us who we are. It doesn't tell us about our dreams and our aspirations.
Dit is een portret. En daar zijn er een hoop van. Er zijn een hoop manieren om dit met data te doen. Ik zocht naar een manier om te bedenken hoe ik een meer democratisch portret kon maken, iets dat meer over mijn land gaat en over hoe het werkt. Elke 10 jaar wordt er in Amerika een volkstelling gehouden. We tellen letterlijk mensen, zien wie hier wonen, wat voor banen we hebben, welke taal we thuis spreken. Dit is belangrijk -- erg belangrijk. Maar het vertelt ons niet wie we zijn. Het vertelt niets over onze dromen en ambities.
And so in 2010, I decided to make my own census. And I started looking for a corpus of data that had a lot of descriptions written by ordinary Americans. And it turns out that there is such a corpus of data that's just sitting there for the taking. It's called online dating.
Dus besloot ik in 2010 mijn eigen volkstelling te houden. Ik begon naar een set gegevens te zoeken met een hoop beschrijvingen geschreven door gewone Amerikanen. En het bleek dat er zo'n set gegevens bestaat die gewoon voor het oprapen ligt. En dat is online dating.
So in 2010, I joined 21 different online dating services, as a gay man, a straight man, a gay woman and a straight woman, in every zip code in America and downloaded about 19 million people's dating profiles -- about 20 percent of the adult population of the United States. I have obsessive-compulsive disorder. This is going to become really freaking obvious. Just go with me.
Dus in 2010 sloot ik me aan bij 21 online dating services, als een homo- en heteroseksuele man, als een homo- en heteroseksuele vrouw, in elke postcode in Amerika en downloadde zo'n 19 miljoen dating-profielen van mensen -- dat is ongeveer 20 procent van de volwassen populatie in Amerika. Ik heb 'n obsessieve-compulsieve stoornis. Dat wordt zometeen heel duidelijk. Let op.
(Laughter)
(Gelach)
So what I did was I sorted all this stuff by zip code. And I looked at word analysis. These are some dating profiles from 2010 with the word "lonely" highlighted. If you look at these things topographically, if you imagine dark colors to light colors are more use of the word, you can see that Appalachia is a pretty lonely place. You can also see that Nebraska ain't that funny. This is the kinky map, so what this is showing you is that the women in Alaska need to get together with the men in southern New Mexico, and have a good time. And I have this at a pretty granular level, so I can tell you that the men in the eastern half of Long Island are way more interested in being spanked than men in the western half of Long Island. This will be your one takeaway from this whole conference. You're going to remember that fact for, like, 30 years.
Ik sorteerde al deze data op postcode. En keek naar woordanalyses. Dit zijn enkele dating-profielen uit 2010 met het woord 'eenzaam' uitgelicht. Als je hier topografisch naar kijkt en bedenkt dat van donker naar licht de frequentie van het woord weerspiegelt, zie je dat Appalachia een vrij eenzame plek is. Je kunt ook zien dat Nebraska niet zo gezellig is. Dit is de kinky kaart en wat dit je toont, is dat vrouwen in Alaska langs moeten gaan bij de mannen in zuidelijk New Mexico om zich te vermaken. Ik heb dit op een vrij gedetailleerd niveau, dus ik kan je vertellen dat de mannen op de oostelijke helft van Long Island liever een klap op de billen krijgen dan de mannen op de westelijke helft van Long Island. Dit is het belangrijkste feitje dat je oppikt op deze conferentie. Je gaat je dit feit voor de komende 30 jaar herinneren.
(Laughter)
(Gelach)
When you bring this down to a cartographic level, you can make maps and do the same trick I was doing with the eye charts. You can replace the name of every city in the United States with the word people use more in that city than anywhere else. If you've ever dated anyone from Seattle, this makes perfect sense. You've got "pretty." You've got "heartbreak." You've got "gig." You've got "cigarette." They play in a band and they smoke. And right above that you can see "email." That's Redmond, Washington, which is the headquarters of the Microsoft Corporation. Some of these you can guess -- so, Los Angeles is "acting" and San Francisco is "gay." Some are a little bit more heartbreaking. In Baton Rouge, they talk about being curvy; downstream in New Orleans, they still talk about the flood. Folks in the American capital will say they're interesting. People in Baltimore, Maryland, will say they're afraid. This is New Jersey. I grew up somewhere between "annoying" and "cynical."
Als je dit naar een cartografisch niveau brengt, kan je kaarten maken en hetzelfde doen als bij de letterborden. Je kan de naam van elke stad in de Verenigde Staten vervangen door het woord dat er meer gebruikt wordt dan elders. Als je ooit met iemand uit Seattle hebt gedate, klinkt dit bekend voor je. Je hebt 'mooi'. Je hebt 'gebroken hart'. Je hebt 'optreden'. Je hebt 'sigaret'. Ze spelen in een band en ze roken. En recht daarboven zie je 'e-mail'. Dat is Redmond, Washington, waar het hoofdkwartier van Microsoft zich bevindt. Sommigen van deze kun je wel raden -- Los Angeles is 'acteren' en San Francisco is 'homo'. Sommige zijn schrijnender. In Baton Rouge spreken ze over mollig zijn; stroomafwaarts in New Orleans gaat het nog over de overstroming. Mensen in de Amerikaanse hoofdstad zeggen dat ze interessant zijn. Mensen in Baltimore, Maryland, zeggen dat ze bang zijn. Dit is New Jersey. Ik groeide ergens op tussen 'vervelend' en 'cynisch'.
(Laughter) (Applause)
(Gelach) (Applaus)
And New York City's number one word is "now," as in, "Now I'm working as a waiter, but actually I'm an actor."
En het woord van New York City is 'nu', als in: "Nu werk ik als ober, maar eigenlijk ben ik een acteur."
(Laughter)
(Gelach)
Or, "Now I'm a professor of engineering at NYU, but actually I'm an artist." If you go upstate, you see "dinosaur." That's Syracuse. The best place to eat in Syracuse, New York, is a Hell's Angels barbecue joint called Dinosaur Barbecue. That's where you would take somebody on a date. I live somewhere between "unconditional" and "midsummer," in Midtown Manhattan. And this is gentrified North Brooklyn, so you've got "DJ" and "glamorous" and "hipsters" and "urbane." So that's maybe a more democratic portrait. And the idea was, what if we made red-state and blue-state maps based on what we want to do on a Friday night?
Of: "Nu ben ik professor aan NYU, maar eigenlijk ben ik een kunstenaar." Als je omhoog gaat, zie je 'dinosaurus'. Dat is Syracuse. De beste plek om te eten in Syracuse, New York, is Hells Angels' barbecue keten Dinosaur Barbecue. Dat is de plek waar je iemand meeneemt op een date. Ik woon ergens tussen 'onvoorwaardelijk' en 'midzomer', middenin Manhattan. En dit is het verbeterde North Brooklyn, dus je hebt 'DJ' en 'glamoreus' en 'hipsters' en 'urban'. Dat is dus misschien een democratischer portret. Het idee ontstond voor een kaart met rode en blauwe staten gebaseerd op wat we willen doen op een vrijdagavond.
This is a self-portrait. This is based on my email, about 500,000 emails sent over 20 years. You can think of this as a quantified selfie. So what I'm doing is running a physics equation based on my personal data. You have to imagine everybody I've ever corresponded with. It started out in the middle and it exploded with a big bang. And everybody has gravity to one another, gravity based on how much they've been emailing, who they've been emailing with. And it also does sentimental analysis, so if I say "I love you," you're heavier to me. And you attract to my email addresses in the middle, which act like mainline stars. And all the names are handwritten.
Dit is een zelfportret. Dat is gebaseerd op mijn e-mail, ongeveer 500.000 e-mails over 20 jaar. Je kan dit zien als een kwantitatieve selfie. Wat ik doe, is het toepassen van een natuurkundige vergelijking gebaseerd op mijn persoonlijke gegevens. Je moet je iedereen voorstellen die ik ooit geschreven heb. Het begon in het midden en explodeerde met een grote knal. En iedereen is verbonden met elkaar, gebaseerd op hoe vaak ze hebben gemaild, met wie ze hebben gemaild. En het maakt ook sentimentele analyses, als ik zeg "ik hou van je" hebben we een diepere band en kom je dichter tot mijn emailadressen in het midden die als centrale sterren fungeren. Alle namen zijn handgeschreven.
Sometimes you do this data and this work with real-time data to illuminate a specific problem in a specific city. This is a Walther PPK 9mm semiautomatic handgun that was used in a shooting in the French Quarter of New Orleans about two years ago on Valentine's Day in an argument over parking. Those are my cigarettes. This is the house where the shooting took place. This project involved a little bit of engineering. I've got a bike chain rigged up as a cam shaft, with a computer driving it. That computer and the mechanism are buried in a box. The gun's on top welded to a steel plate. There's a wire going through to the trigger, and the computer in the box is online. It's listening to the 911 feed of the New Orleans Police Department, so that anytime there's a shooting reported in New Orleans,
Soms doe je dit werk met real-time data om een specifiek probleem in een stad aan het licht te brengen. Dit is een Walther PPK 9mm semiautomatisch handwapen dat werd gebruikt in de schietpartij in de Franse wijk van New Orleans zo'n twee jaar geleden op Valentijnsdag, tijdens een parkeerruzie. Dit zijn mijn sigaretten. Dit is het huis waar de schietpartij plaatsvond. Dit project had wat constructie nodig. Ik heb een fietsketting om een as getakeld, terwijl een computer het bestuurde. De computer en het mechanisme zijn verstopt in een doos. Het geweer is op een stalen plaat gelast. Er loopt een draad door naar de trekker en de computer in de doos is online. Het luistert naar de 911 gegevens van de politie in New Orleans en elke keer als er een schietpartij wordt doorgegeven in New Orleans
(Gunshot sound)
(Geweerschot)
the gun fires. Now, there's a blank, so there's no bullet. There's big light, big noise and most importantly, there's a casing. There's about five shootings a day in New Orleans, so over the four months this piece was installed, the case filled up with bullets. You guys know what this is -- you call this "data visualization." When you do it right, it's illuminating. When you do it wrong, it's anesthetizing. It reduces people to numbers. So watch out.
gaat het geweer af. Er zit een losse flodder in, dus er is geen kogel. Er is veel licht, een harde knal en het belangrijkste: er is een huls. Er zijn zo'n vijf schietpartijen per dag in New Orleans, dus tijdens de vier maanden dat dit werk er stond, vulde de doos zich met kogels. Jullie weten wat dit is -- het heet 'data-visualisatie'. Als je het goed doet, is het verhelderend. Als je het verkeerd doet, is het verdovend. Het reduceert mensen tot nummers. Dus pas op.
One last piece for you. I spent the last summer as the artist in residence for Times Square. And Times Square in New York is literally the crossroads of the world. One of the things people don't notice about it is it's the most Instagrammed place on Earth. About every five seconds, someone commits a selfie in Times Square. That's 17,000 a day, and I have them all.
Een laatste werk voor jullie. Ik bracht vorige zomer door als gastkunstenaar op Times Square. En Times Square in New York is letterlijk het kruispunt van de wereld. Iets dat weinig mensen doorhebben is dat het de meest ge-instagramde plek op de wereld is. Ongeveer elke vijf seconden neemt iemand een selfie op Times Square. Dat is 17.000 per dag en ik heb ze allemaal.
(Laughter)
(Gelach)
These are some of them with their eyes centered.
Dit zijn er enkele van, met hun ogen gecentreerd.
Every civilization, will use the maximum level of technology available to make art. And it's the responsibility of the artist to ask questions about what that technology means and how it reflects our culture.
Elke samenleving zal het maximale uit technologie halen om kunst te kunnen maken. Kunstenaars zijn verantwoordelijk voor het stellen van vragen over wat die technologie betekent en hoe het onze cultuur reflecteert.
So I leave you with this: we're more than numbers. We're people, and we have dreams and ideas. And reducing us to statistics is something that's done at our peril.
Ik neem afscheid met dit: we zijn meer dan nummers. We zijn mensen en we hebben dromen en ideeën. Ons reduceren tot statistieken is iets dat wordt gedaan op ons risico.
Thank you very much.
Heel erg bedankt.
(Applause)
(Applaus)