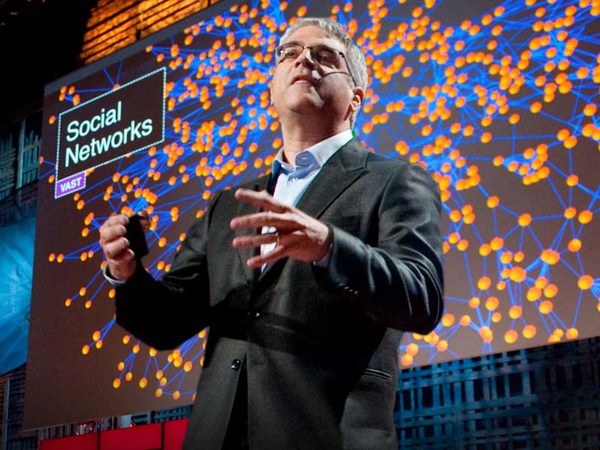
For the last 10 years, I've been spending my time trying to figure out how and why human beings assemble themselves into social networks. And the kind of social network I'm talking about is not the recent online variety, but rather, the kind of social networks that human beings have been assembling for hundreds of thousands of years, ever since we emerged from the African savannah. So, I form friendships and co-worker and sibling and relative relationships with other people who in turn have similar relationships with other people. And this spreads on out endlessly into a distance. And you get a network that looks like this. Every dot is a person. Every line between them is a relationship between two people -- different kinds of relationships. And you can get this kind of vast fabric of humanity, in which we're all embedded.
過去10年來,我試著了解, 人們為何形成社交網路, 以及這些網路是如何形成的。 我所要談的網路, 並非現在所謂的網路社群。 而是更原始的社交網路, 自從人類在非洲大草原出現以來, 已經使用這種連結十幾萬年了。 我和其他人分享友誼、同事、 手足和親戚等等人際關係, 這些人也和其他人有相似的連結。 這樣的連結向外擴散, 從而得到的網路看起來會像這樣。 每點代表一個人, 兩點間的線則代表兩個人之間的關係, 各種不同的關係。 種種的關係交織成一幅巨大的網路, 而我們都位於其中。
And my colleague, James Fowler and I have been studying for quite sometime what are the mathematical, social, biological and psychological rules that govern how these networks are assembled and what are the similar rules that govern how they operate, how they affect our lives. But recently, we've been wondering whether it might be possible to take advantage of this insight, to actually find ways to improve the world, to do something better, to actually fix things, not just understand things. So one of the first things we thought we would tackle would be how we go about predicting epidemics.
我的同事James Fowler和我花了滿長時間研究, 想找到一個基於數學、社會學、 生物學或是心理學的規則, 能夠主導這些網路的形成。 以及是否有類似的規則 主導網路的運作,進而影響我們的生活。 直到最近,我們開始思考, 是否有可能利用這些發現, 來找出增進人類福祉的方法, 改善現況, 去導正,而非只是單純理解問題。 我們最先著手研究的議題, 是如何預測流行趨勢。
And the current state of the art in predicting an epidemic -- if you're the CDC or some other national body -- is to sit in the middle where you are and collect data from physicians and laboratories in the field that report the prevalence or the incidence of certain conditions. So, so and so patients have been diagnosed with something, or other patients have been diagnosed, and all these data are fed into a central repository, with some delay. And if everything goes smoothly, one to two weeks from now you'll know where the epidemic was today. And actually, about a year or so ago, there was this promulgation of the idea of Google Flu Trends, with respect to the flu, where by looking at people's searching behavior today, we could know where the flu -- what the status of the epidemic was today, what's the prevalence of the epidemic today.
目前最先進的預測方法— 如果你在疾病管制中心(CDC)或類似的政府單位工作— 是待在中央枯等, 並收集資料, 第一線的醫生和實驗室把資料傳進來, 報告疾病的流行程度或發生機率。 這邊有某個病患被診斷出來, 那邊又有別人得病。 資訊經過一些延遲之後,傳進中央的資料庫裡。 如果一切順利, 一到兩個禮拜之後, 我們才會得知當天流行病的狀況。 事實上一年多以前, 有人發表了這樣的概念, 使用Google流感趨勢(Flu Trends)來尋找流感。 透過對搜尋行為的分析, 我們能夠得知流感發生的區域, 得知當天傳染病的狀態, 以及傳染病的影響程度。
But what I'd like to show you today is a means by which we might get not just rapid warning about an epidemic, but also actually early detection of an epidemic. And, in fact, this idea can be used not just to predict epidemics of germs, but also to predict epidemics of all sorts of kinds. For example, anything that spreads by a form of social contagion could be understood in this way, from abstract ideas on the left like patriotism, or altruism, or religion to practices like dieting behavior, or book purchasing, or drinking, or bicycle-helmet [and] other safety practices, or products that people might buy, purchases of electronic goods, anything in which there's kind of an interpersonal spread. A kind of a diffusion of innovation could be understood and predicted by the mechanism I'm going to show you now.
不過這次我要介紹的方法, 讓我們不只能夠 得到傳染病的快速預警, 更能夠讓我們 提早偵測到流行病的發生。 事實上,這個概念不止能夠 用來預測病菌的流行, 也能夠應用來預測各種事物的趨勢。 例如,任何能透過社群的方式傳播的事物, 都可以用這種方式理解。 從左邊的抽象概念, 像是愛國主義、利他精神,或是宗教, 到具體的事物, 像是飲食行為、購買書籍、 酗酒、使用腳踏車安全帽等安全措施, 或是日常用品, 電子產品, 任何透過人與人之間傳遞的事物。 這種創新的擴散, 可以透過接下來我將展示的機制, 來理解並且預測。
So, as all of you probably know, the classic way of thinking about this is the diffusion-of-innovation, or the adoption curve. So here on the Y-axis, we have the percent of the people affected, and on the X-axis, we have time. And at the very beginning, not too many people are affected, and you get this classic sigmoidal, or S-shaped, curve. And the reason for this shape is that at the very beginning, let's say one or two people are infected, or affected by the thing and then they affect, or infect, two people, who in turn affect four, eight, 16 and so forth, and you get the epidemic growth phase of the curve. And eventually, you saturate the population. There are fewer and fewer people who are still available that you might infect, and then you get the plateau of the curve, and you get this classic sigmoidal curve. And this holds for germs, ideas, product adoption, behaviors, and the like. But things don't just diffuse in human populations at random. They actually diffuse through networks. Because, as I said, we live our lives in networks, and these networks have a particular kind of a structure.
你們或許知道, 最經典的範例, 就是創新的擴散, 或是所謂的「普及曲線」。 Y軸是受影響人數的百分比, X軸表示時間的推移。 剛開始沒有太多人受到影響, 然後你會看到經典的反曲線, 或是S型曲線。 形成這種曲線的原因是, 一開始只有一兩個人 被影響,或是被「感染」, 然後傳遞給另外兩個人, 接著4、8、16,以此類推, 這時進入迅速增長的階段。 最終擴散到整個群體。 於是越來越難找到 尚未被影響的人, 這時候曲線進入高原期, 形成整條反曲線。 這個模式在病菌、創意、 新產品的普及、行為, 以及類似情況都適用。 要注意的是,事物並不是隨機在人群中蔓延, 而是隨著網路分布來擴散。 因為我們活在網路的世界, 而這種網路有特定的結構。
Now if you look at a network like this -- this is 105 people. And the lines represent -- the dots are the people, and the lines represent friendship relationships. You might see that people occupy different locations within the network. And there are different kinds of relationships between the people. You could have friendship relationships, sibling relationships, spousal relationships, co-worker relationships, neighbor relationships and the like. And different sorts of things spread across different sorts of ties. For instance, sexually transmitted diseases will spread across sexual ties. Or, for instance, people's smoking behavior might be influenced by their friends. Or their altruistic or their charitable giving behavior might be influenced by their coworkers, or by their neighbors. But not all positions in the network are the same.
觀察這個網路, 裡面有105人。 每個點代表一個人 每條線代表彼此間的友誼關係。 人們在這個網路中 佔據不同的位置, 彼此間有不同類型的關係。 可能是朋友、手足、 配偶、同事、 鄰居等等。 不同的事物會 透過不同的關係來傳播。 例如,性傳染病, 會藉由性伴侶的聯繫來散佈。 或者像人們吸菸, 可能是受到朋友的影響。 人們的善行或捐助, 可能是出自同事間的影響, 或是他們鄰居的行為。 但是網路中的位置並非都一樣。
So if you look at this, you might immediately grasp that different people have different numbers of connections. Some people have one connection, some have two, some have six, some have 10 connections. And this is called the "degree" of a node, or the number of connections that a node has. But in addition, there's something else. So, if you look at nodes A and B, they both have six connections. But if you can see this image [of the network] from a bird's eye view, you can appreciate that there's something very different about nodes A and B. So, let me ask you this -- I can cultivate this intuition by asking a question -- who would you rather be if a deadly germ was spreading through the network, A or B? (Audience: B.) Nicholas Christakis: B, it's obvious. B is located on the edge of the network. Now, who would you rather be if a juicy piece of gossip were spreading through the network? A. And you have an immediate appreciation that A is going to be more likely to get the thing that's spreading and to get it sooner by virtue of their structural location within the network. A, in fact, is more central, and this can be formalized mathematically. So, if we want to track something that was spreading through a network, what we ideally would like to do is to set up sensors on the central individuals within the network, including node A, monitor those people that are right there in the middle of the network, and somehow get an early detection of whatever it is that is spreading through the network.
這張圖或許能讓你了解, 不同人有不同數量的連結。 有的人一個,有人兩個, 有人六個,有的人擁有十個連結。 也就是一個節點的「度數」, 或是一個節點所擁有的連結數。 除此之外, 如果觀察節點A與B, 兩者都擁有六個連結。 但是如果鳥瞰整個圖像, 你就會發現兩者之間, A與B的不同之處 問題來了 -請用直覺回答- 你比較想當誰: 如果致命病菌正在網路中散佈,A或是B? (觀眾:B)很明顯的是B。 B處在網路的邊緣。 現在,你比較想當誰: 如果網路中流傳著一個天大的八卦? A。而且你馬上能夠理解到, A會有更高的機率 趕上流行,而且早先一步。 這要歸功於他們在網路中的位置。 A比較靠近中央, 這可以用數學形式來描述。 因此,如果我們希望追蹤某些事物 在網路中散佈的狀態, 理想狀況是佈置感測器, 對準網路裡的中央個體, 包括節點A。 監視這些位於中心位置的人們, 以早期的預警到 正在網路上傳播的事物。
So if you saw them contract a germ or a piece of information, you would know that, soon enough, everybody was about to contract this germ or this piece of information. And this would be much better than monitoring six randomly chosen people, without reference to the structure of the population. And in fact, if you could do that, what you would see is something like this. On the left-hand panel, again, we have the S-shaped curve of adoption. In the dotted red line, we show what the adoption would be in the random people, and in the left-hand line, shifted to the left, we show what the adoption would be in the central individuals within the network. On the Y-axis is the cumulative instances of contagion, and on the X-axis is the time. And on the right-hand side, we show the same data, but here with daily incidence. And what we show here is -- like, here -- very few people are affected, more and more and more and up to here, and here's the peak of the epidemic. But shifted to the left is what's occurring in the central individuals. And this difference in time between the two is the early detection, the early warning we can get, about an impending epidemic in the human population.
亦即,如果這些人染病或是獲悉某些資訊, 你就可以推斷,要不了多久, 所有人都會被波及,不管是染病, 或是得到資訊。 這樣的作法遠勝於 隨機挑選六個人來監控, 因為該做法並未考慮到群體的結構。 若是真的能夠實行, 我們會得到類似這樣的情況: 左邊的圖表,是S型的普及曲線。 我們用紅色虛線標示出, 一般人的普及情形, 左邊的線段,則向左偏移, 顯示出網路中的核心個體, 他們的普及情形。 Y軸是受到傳染「病例」的累積數量, X軸則是時間。 右邊的圖表是相同的資料, 呈現的是每日的「感染」數字。 我們想要傳達的是, 一開始少數人受到影響,然後越來越多直到這裡, 這裡就是傳播的高峰期。 向左偏的則是在核心個體發生的情形, 這兩條曲線間的時間差, 就是預測時差,我們可以從中得到預警, 人群中是否有 即將爆發的疫情。
The problem, however, is that mapping human social networks is not always possible. It can be expensive, not feasible, unethical, or, frankly, just not possible to do such a thing. So, how can we figure out who the central people are in a network without actually mapping the network? What we came up with was an idea to exploit an old fact, or a known fact, about social networks, which goes like this: Do you know that your friends have more friends than you do? Your friends have more friends than you do, and this is known as the friendship paradox. Imagine a very popular person in the social network -- like a party host who has hundreds of friends -- and a misanthrope who has just one friend, and you pick someone at random from the population; they were much more likely to know the party host. And if they nominate the party host as their friend, that party host has a hundred friends, therefore, has more friends than they do. And this, in essence, is what's known as the friendship paradox. The friends of randomly chosen people have higher degree, and are more central than the random people themselves.
然而問題在於, 人際間的社交網路, 並不容易繪測。 這樣的計畫可能所費不貲、非常困難、 具有道德爭議 說實話,就是不可能。 所以,我們要如何找出, 網路中的核心個體在哪, 而無需繪出整個網路? 我們所想到的, 是利用一個既有的事實 關於社交網路,眾所皆知的事實。 也就是: 你知道你的朋友, 所擁有的友人數目比你還多嗎? 朋友的友人數目比自己擁有的還多, 通常這種情況被稱做「友誼悖論」。 試想社交網路中的人氣王 - 例如派對的主人,身邊有上百個朋友 -- 和孤僻成性,只有一個朋友的人。 若是你隨便從人群中挑出一位, 他們就非常有可能認識這位派對主人, 而當他們舉出派對主人是自己的朋友, 由於他有上百個朋友, 因此遠比自己的朋友數目還多。 在本質上,這就是友誼悖論: 隨機挑選的人,他的朋友, 會有較高的連結數目,也較為趨近核心, 因而優於那些隨機挑選的人。
And you can get an intuitive appreciation for this if you imagine just the people at the perimeter of the network. If you pick this person, the only friend they have to nominate is this person, who, by construction, must have at least two and typically more friends. And that happens at every peripheral node. And in fact, it happens throughout the network as you move in, everyone you pick, when they nominate a random -- when a random person nominates a friend of theirs, you move closer to the center of the network. So, we thought we would exploit this idea in order to study whether we could predict phenomena within networks. Because now, with this idea we can take a random sample of people, have them nominate their friends, those friends would be more central, and we could do this without having to map the network.
因此,你可以憑直覺想像, 如果是那些位於網路邊緣的人, 這樣的人, 他的朋友只會有這個人, 而結構上來說,這個人至少會有兩位、 甚至更多的朋友。 在每個外圍的節點都是這樣。 當你越往網路的中心移動時就越常見, 每個被你挑到的人,當他們隨意提出一個... 每當提出一個他們的朋友, 你就越靠近網路的中心。 於是我們認為可以利用這個概念, 來研究我們是否能預測網路中所發生的現象。 因為有了這樣的發現, 我們可以從人群中隨機挑選樣本, 請他們指出他們的朋友, 這些朋友會比較靠近中心, 而我們就無須標出整個網路的圖像。
And we tested this idea with an outbreak of H1N1 flu at Harvard College in the fall and winter of 2009, just a few months ago. We took 1,300 randomly selected undergraduates, we had them nominate their friends, and we followed both the random students and their friends daily in time to see whether or not they had the flu epidemic. And we did this passively by looking at whether or not they'd gone to university health services. And also, we had them [actively] email us a couple of times a week. Exactly what we predicted happened. So the random group is in the red line. The epidemic in the friends group has shifted to the left, over here. And the difference in the two is 16 days. By monitoring the friends group, we could get 16 days advance warning of an impending epidemic in this human population.
在哈佛大學,我們利用H1N1流感的爆發 來測試這個概念。 在2009年秋冬,只有幾個月前, 我們隨機挑選了1300位大學生, 請這些人提供他們的朋友名單, 我們同時追蹤了這些人和他們的朋友, 每天為間隔, 確認他們是否染上流感。 除了被動觀察他們是否去健康中心報到, 同時也要求每個禮拜Email給我們。 結果一如我們所預期。 隨機挑選的群體用紅線標示, 他們的朋友則向左邊偏移,在這邊。 兩者間的差距是16天。 觀察朋友的群體, 能夠讓我們提早16天得到警示, 警告人群中即將爆發的傳染病。
Now, in addition to that, if you were an analyst who was trying to study an epidemic or to predict the adoption of a product, for example, what you could do is you could pick a random sample of the population, also have them nominate their friends and follow the friends and follow both the randoms and the friends. Among the friends, the first evidence you saw of a blip above zero in adoption of the innovation, for example, would be evidence of an impending epidemic. Or you could see the first time the two curves diverged, as shown on the left. When did the randoms -- when did the friends take off and leave the randoms, and [when did] their curve start shifting? And that, as indicated by the white line, occurred 46 days before the peak of the epidemic. So this would be a technique whereby we could get more than a month-and-a-half warning about a flu epidemic in a particular population.
除此之外, 如果你是研究傳染病的分析師, 或者想要預測產品的普及情形。 你可以從人群中挑選隨機樣本, 請他們指出自己的朋友, 並且同時追蹤這兩群樣本("隨機群"和"朋友群")。 在朋友群中,當曲線首次開始上升... ...例如創新概念的普及, 這個轉折便能標示出即將發生的流行趨勢。 另一種情況是當兩條曲線首次出現分歧時, 如左圖所示。 隨機群...他們的朋友群是何時起頭, 離開隨機群的曲線, 使得這條曲線開始偏移? 從白線上可以發現, 在整體趨勢達到高峰之前, 提早了46天。 這樣的技術, 可以讓我們提早一個半月得到預警, 得知特定群體中感冒的流行。
I should say that how far advanced a notice one might get about something depends on a host of factors. It could depend on the nature of the pathogen -- different pathogens, using this technique, you'd get different warning -- or other phenomena that are spreading, or frankly, on the structure of the human network. Now in our case, although it wasn't necessary, we could also actually map the network of the students.
應該這樣說, 我們能夠多早預知事件的發生, 取決於幾個主要的因素。 可能由於病原的性質 - 不同的病原體, 利用這個技術,可以得到不同的警示 - 或是可以說,在人際網路的結構裡 某些正在傳播中的現象。 雖然並非必要,不過在這個案例中, 我們可以將學生的網路完整描繪出來,
So, this is a map of 714 students and their friendship ties. And in a minute now, I'm going to put this map into motion. We're going to take daily cuts through the network for 120 days. The red dots are going to be cases of the flu, and the yellow dots are going to be friends of the people with the flu. And the size of the dots is going to be proportional to how many of their friends have the flu. So bigger dots mean more of your friends have the flu. And if you look at this image -- here we are now in September the 13th -- you're going to see a few cases light up. You're going to see kind of blooming of the flu in the middle. Here we are on October the 19th. The slope of the epidemic curve is approaching now, in November. Bang, bang, bang, bang, bang -- you're going to see lots of blooming in the middle, and then you're going to see a sort of leveling off, fewer and fewer cases towards the end of December. And this type of a visualization can show that epidemics like this take root and affect central individuals first, before they affect others.
所以,這幅圖包含了714個學生, 以及他們的人際關係。 接下來我會用動畫呈現這幅圖, 逐日推進, 一共120天。 紅點代表受到感染的案例, 黃點則代表受感染學生的朋友, 而點的大小則以比例的方式, 呈現它周遭朋友受到傳染的數量, 也就是說,越大的點代表你有越多的朋友感冒。 觀察這張圖 -現在是9月13號- 你會看到幾個病例亮起來。 中心區域裡,傳染就像開花一樣向外散布。 接下來到了10月19號, 傳染曲線開始上升,到了11月, 砰,砰,砰,越來越多病例在中央區域發生。 接著情勢開始趨緩, 越來越少人受到感染,直到十二月底。 這種類型的圖像化資訊, 可以呈現出流行事件開始扎根, 先影響中心的個體, 再向外擴散的全貌。
Now, as I've been suggesting, this method is not restricted to germs, but actually to anything that spreads in populations. Information spreads in populations, norms can spread in populations, behaviors can spread in populations. And by behaviors, I can mean things like criminal behavior, or voting behavior, or health care behavior, like smoking, or vaccination, or product adoption, or other kinds of behaviors that relate to interpersonal influence. If I'm likely to do something that affects others around me, this technique can get early warning or early detection about the adoption within the population. The key thing is that for it to work, there has to be interpersonal influence. It cannot be because of some broadcast mechanism affecting everyone uniformly.
如我之前所說的, 這套方法並不局限於病菌, 可以是透過人群傳播的任何事物。 資訊透過人群傳遞, 規則能透過人群來散佈, 行為也能夠透過人群傳播 談到行為,像是犯罪, 投票,衛生習慣- 像是吸菸或是疫苗接種, 新產品的採用,或是其他種類的行為, 與人們之間的相互影響有關。 如果我打算做某些事來影響周圍的人, 這套技巧就可以提前預警,或是偵測, 事物在人群中的普及程度。 讓它管用的關鍵在於, 人們之間要能互相影響, 而非因為某種廣播機制, 使得每個人都受到相同的影響。
Now the same insights can also be exploited -- with respect to networks -- can also be exploited in other ways, for example, in the use of targeting specific people for interventions. So, for example, most of you are probably familiar with the notion of herd immunity. So, if we have a population of a thousand people, and we want to make the population immune to a pathogen, we don't have to immunize every single person. If we immunize 960 of them, it's as if we had immunized a hundred [percent] of them. Because even if one or two of the non-immune people gets infected, there's no one for them to infect. They are surrounded by immunized people. So 96 percent is as good as 100 percent. Well, some other scientists have estimated what would happen if you took a 30 percent random sample of these 1000 people, 300 people and immunized them. Would you get any population-level immunity? And the answer is no. But if you took this 30 percent, these 300 people and had them nominate their friends and took the same number of vaccine doses and vaccinated the friends of the 300 -- the 300 friends -- you can get the same level of herd immunity as if you had vaccinated 96 percent of the population at a much greater efficiency, with a strict budget constraint.
同樣的發現, 透過網路的傳播,也能夠有 各式各樣的應用, 例如,用來標示出, 特定的目標以進行干預。 舉例來說,大部分的人可能對 "群體免疫力"感到熟悉。 如果這裡有一千人的群體, 我們希望讓群體對某個病原體免疫, 我們不需要對每個人施打疫苗。 若是讓其中960人免疫, 效果就相當於整個群體都免疫, 因為即使一兩個沒有免疫能力的人受到感染, 他也沒有人能夠傳染, 感染者被免疫的人所圍繞。 所以百分之96的效果相當於百分之百。 其他的科學家估計, 如果只靠30%的隨機樣本, 30%在1000人中,也就是讓300個人免疫, 是否能夠達到群體層次的免疫? 答案是"不能"。 但是,如果對這30%,要300個人 舉出他們的朋友, 然後用同樣數量的疫苗藥劑, 為這群300人的朋友接種, 300位朋友, 就能夠得到相同於,讓96%的人免疫 所達到的群體免疫程度。 更有效率,也節省預算。
And similar ideas can be used, for instance, to target distribution of things like bed nets in the developing world. If we could understand the structure of networks in villages, we could target to whom to give the interventions to foster these kinds of spreads. Or, frankly, for advertising with all kinds of products. If we could understand how to target, it could affect the efficiency of what we're trying to achieve. And in fact, we can use data from all kinds of sources nowadays [to do this].
類似的概念也能用於 物資的分配標的,例如在發展中國家 蚊帳的分發方式。 若是能夠了解村落中的網路架構, 我們就能影響關鍵的節點, 以增進這種形式的散佈。 或是老實說,用來宣傳各式各樣的產品。 如果能夠了解 如何鎖定焦點, 就可以提高成功的效率。 事實上現在有數不清的來源。 能夠提供我們所需的資料。
This is a map of eight million phone users in a European country. Every dot is a person, and every line represents a volume of calls between the people. And we can use such data, that's being passively obtained, to map these whole countries and understand who is located where within the network. Without actually having to query them at all, we can get this kind of a structural insight. And other sources of information, as you're no doubt aware are available about such features, from email interactions, online interactions, online social networks and so forth. And in fact, we are in the era of what I would call "massive-passive" data collection efforts. They're all kinds of ways we can use massively collected data to create sensor networks to follow the population, understand what's happening in the population, and intervene in the population for the better. Because these new technologies tell us not just who is talking to whom, but where everyone is, and what they're thinking based on what they're uploading on the Internet, and what they're buying based on their purchases. And all this administrative data can be pulled together and processed to understand human behavior in a way we never could before.
這是一份歐洲國家中, 八百萬電話用戶的分布圖。 每個點代表一個用戶,每條線 代表人們之間的通話量。 我們可以利用這份被動獲得的資料, 描繪出整個國家的全貌, 並且定位每個人在網路中的位置, 而無須一個個去問, 從而得到對整體架構的瞭解。 你一定也知道,其他來源的資訊 也能提供類似的特徵,從email互動, 線上互動, 線上社群網站等等。 而事實上我們正在這樣的一個世界, 「巨量-被動」的資料被收集起來。 我們有一大堆方法可以使用這些廣泛收集的資料, 用來建立偵測網路, 用來追蹤人群, 找出群體中正在發生的事件, 並且適時介入以改善情況。 因為這些新的科技讓我們理解, 不只是誰正和誰溝通, 還有每個人的位置所在。 人們在想什麼,是看他們上傳了什麼到網路上, 現在的購買決策受到過去購物的影響。 所有這樣的資料可以組織起來, 經過處理以了解人類的行為, 以一種前所未見的方式。
So, for example, we could use truckers' purchases of fuel. So the truckers are just going about their business, and they're buying fuel. And we see a blip up in the truckers' purchases of fuel, and we know that a recession is about to end. Or we can monitor the velocity with which people are moving with their phones on a highway, and the phone company can see, as the velocity is slowing down, that there's a traffic jam. And they can feed that information back to their subscribers, but only to their subscribers on the same highway located behind the traffic jam! Or we can monitor doctors prescribing behaviors, passively, and see how the diffusion of innovation with pharmaceuticals occurs within [networks of] doctors. Or again, we can monitor purchasing behavior in people and watch how these types of phenomena can diffuse within human populations.
舉例來說,我們可以觀察卡車司機加油, 司機們正準備開工, 他們買入了汽油, 我們觀察到卡車司機加油的曲線開始上升, 而能夠推估景氣即將好轉了。 或是可以透過手機, 監視高速公路上人們的移動速度, 電信公司便能夠得知, 當移動速度下降的時候, 代表可能有交通堵塞。 這些資訊便回傳給電信公司的用戶, 並且針對那些在同一條高速公路上, 位於車陣後方的用戶! 我們也可以被動監測醫生開藥的行為, 以了解對藥品的接受度, 是如何在醫生之間擴散的。 我們也可以監測人們的購買行為, 觀察購買現象是如何 在人群中散播的。
And there are three ways, I think, that these massive-passive data can be used. One is fully passive, like I just described -- as in, for instance, the trucker example, where we don't actually intervene in the population in any way. One is quasi-active, like the flu example I gave, where we get some people to nominate their friends and then passively monitor their friends -- do they have the flu, or not? -- and then get warning. Or another example would be, if you're a phone company, you figure out who's central in the network and you ask those people, "Look, will you just text us your fever every day? Just text us your temperature." And collect vast amounts of information about people's temperature, but from centrally located individuals. And be able, on a large scale, to monitor an impending epidemic with very minimal input from people. Or, finally, it can be more fully active -- as I know subsequent speakers will also talk about today -- where people might globally participate in wikis, or photographing, or monitoring elections, and upload information in a way that allows us to pool information in order to understand social processes and social phenomena.
我認為這些巨量-被動收集所得的資料, 有三種方式可以利用。 一種是完全的被動, 像我剛剛所描述的 - 例如卡車司機的例子, 我們並不對群體做任何形式的干預。 一種是半主動, 像是之前流感的例子, 我們讓某些人舉出他們的朋友, 然後被動的觀察他們的朋友 - 他們感冒了沒?- 並據此取得預警。 另外一個例子是, 電信公司可以想辦法找出網路的中心群, 問他們,"你能不能每天用簡訊,讓我們知道你發燒了沒? 只要傳送體溫即可" 然後從中心群體裡, 大量收集體溫資料, 便能夠用少量的資料輸入, 來進行大規模的監控, 以預測流感的爆發。 最後是完全主動的方式 - 就我所知下位演講者也會談到- 現在全世界的人都參與維基百科的編寫、 拍攝照片、或是監視選舉, 人們將資訊上傳,使得我們能夠匯集 資訊以了解社會進程, 以及社會現象的產生。
In fact, the availability of these data, I think, heralds a kind of new era of what I and others would like to call "computational social science." It's sort of like when Galileo invented -- or, didn't invent -- came to use a telescope and could see the heavens in a new way, or Leeuwenhoek became aware of the microscope -- or actually invented -- and could see biology in a new way. But now we have access to these kinds of data that allow us to understand social processes and social phenomena in an entirely new way that was never before possible. And with this science, we can understand how exactly the whole comes to be greater than the sum of its parts. And actually, we can use these insights to improve society and improve human well-being.
我認為這些資料的垂手可得, 揭示了一個新時代的來臨, 我們將之稱作 "計算社會科學"。 有點類似伽利略發明 -或許沒有發明- 望遠鏡的誕生, 而可以從全新的角度來觀看天空。 或是雷文霍克發現顯微鏡 - 或許是他發明的- 而能夠用新的方式看待生物學。 現在我們能夠取得的資料, 能夠讓我們用過去未見的嶄新角度 了解社會的進程, 以及其中發生的現象。 有了這樣的科學, 我們就能夠了解 群體的綜效,是如何優於 單純個體的加總。 我們也能運用這些理解, 來增進社會以及人類的福祉。
Thank you.
謝謝。