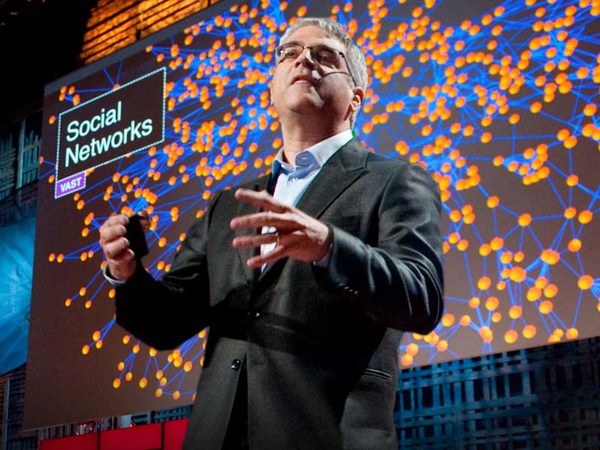
For the last 10 years, I've been spending my time trying to figure out how and why human beings assemble themselves into social networks. And the kind of social network I'm talking about is not the recent online variety, but rather, the kind of social networks that human beings have been assembling for hundreds of thousands of years, ever since we emerged from the African savannah. So, I form friendships and co-worker and sibling and relative relationships with other people who in turn have similar relationships with other people. And this spreads on out endlessly into a distance. And you get a network that looks like this. Every dot is a person. Every line between them is a relationship between two people -- different kinds of relationships. And you can get this kind of vast fabric of humanity, in which we're all embedded.
Son 10 yıldır insanların nasıl ve neden sosyal ağlar üzerinde bir araya geldiklerini anlamak için vakit harcıyorum. Va kastettiğim sosyal ağ türü son zamanlardaki internet ağları değil, insanlığın yüzlerce, binlerce yıldır insanlığın Afrika bozkırlarında ilk ortaya çıktığı zamanlardan beri bir araya geldikleri sosyal ağlar. Yani ben insanlarla iş arkadaşlığı, kardeşlik ve akrabalık gibi değişik derecelerde ilişkiler kuruyorum; ve bu insanlar da diğer insanlarla benzer ilişkiler kuruyorlar. Ve bu çok geniş bir alana yayılıyor. Ve buna benzer bir ağınız oluyor. Her nokta bir insan. Aralarındaki her çizgi iki insan arasındaki ilişki. Farklı türde ilişkiler. Ve her birimizin dahil olduğu bu tarz büyük bir insanlık dokusu elde ediyorsunuz.
And my colleague, James Fowler and I have been studying for quite sometime what are the mathematical, social, biological and psychological rules that govern how these networks are assembled and what are the similar rules that govern how they operate, how they affect our lives. But recently, we've been wondering whether it might be possible to take advantage of this insight, to actually find ways to improve the world, to do something better, to actually fix things, not just understand things. So one of the first things we thought we would tackle would be how we go about predicting epidemics.
Meslektaşım James Fowler ve ben bir süredir bu sosyal ağların işleyişini yönlendiren matematiksel, sosyal, biyolojik ve psikolojik kuralların nasıl bir araya geldiğini, benzer kuralların neler olduğunu nasıl işlediklerini ve yaşamımızı nasıl etkilediklerini araştırıyoruz. Ve son zamanlarda, ekrandaki modeli kullanarak dünyayı iyi bir hale getirebilmek için yeni yöntemler bulabilir miyiz. bazı şeyleri sadece anlamak yerine çözebilir miyiz diye düşünmeye başladık. Uğraşmaya düşündüğümüz şeylerden ilki salgın hastalıkları nasıl önceden tahmin ederiz oldu.
And the current state of the art in predicting an epidemic -- if you're the CDC or some other national body -- is to sit in the middle where you are and collect data from physicians and laboratories in the field that report the prevalence or the incidence of certain conditions. So, so and so patients have been diagnosed with something, or other patients have been diagnosed, and all these data are fed into a central repository, with some delay. And if everything goes smoothly, one to two weeks from now you'll know where the epidemic was today. And actually, about a year or so ago, there was this promulgation of the idea of Google Flu Trends, with respect to the flu, where by looking at people's searching behavior today, we could know where the flu -- what the status of the epidemic was today, what's the prevalence of the epidemic today.
Salgın hastalıkları öngörmede kullanılan şu anki yöntem - salgın hastalıklarla savaşma kurumu veya başka bir ulusal kurumsanız - olduğunuz yerde oturmak ve bilgileri bölgedeki doktorlar ve laboratuvarlardan toplayarak belli durumların yaygınlığını ve sıklığını rapor etmek şeklindedir. Böyle, böyle, bazı hastalara burada şu tanılar konuldu, bazı diğer hastalara ise şurada şu tanılar konuldu gibi.... ve bütün bu veriler biraz gecikmeyle merkezi bir kaynakta depolanır. Ve eğer herşey sorunsuz giderse, bir veya iki hafta sonra, salgın hastalığın bugün hangi durumda olduğunu öğrenebilirsiniz. Ve aslında, bir yıl kadar önce, resmi bir açıklamayla tanıtılan Google Flu Trends fikrine göre grip salgınlarında insanların günlük arama davranışlarına bakarak salgının nerede olduğunu, salgın hastalığın bugünki durumunun ne olduğunu, ve yaygınlığının bugün ne kadar olduğunu görebilecektik.
But what I'd like to show you today is a means by which we might get not just rapid warning about an epidemic, but also actually early detection of an epidemic. And, in fact, this idea can be used not just to predict epidemics of germs, but also to predict epidemics of all sorts of kinds. For example, anything that spreads by a form of social contagion could be understood in this way, from abstract ideas on the left like patriotism, or altruism, or religion to practices like dieting behavior, or book purchasing, or drinking, or bicycle-helmet [and] other safety practices, or products that people might buy, purchases of electronic goods, anything in which there's kind of an interpersonal spread. A kind of a diffusion of innovation could be understood and predicted by the mechanism I'm going to show you now.
Ama bugün size göstermek istediğim şey, sadece bir salgınla ilgili acil uyarı değil, aynı zamanda salgının erkenden belirlenmesi Hatta, bu fikir yalnızca bulaşıcı salgın hastalıkları değil, her türlü soyut/somut salgınlığı öngörmek için kullanılabilir. Örneğin, sosyal temas ile yayılan herhangi bir şey bu şekilde anlaşılabilir, Soldaki soyut düşüncelerden; yani vatanseverlik, başkalarını düşünürlük, din gibi, uygulamalara, örneğin; diyet alışkanlıklarından, kitap seçimine, içme alışkanlığından, bisiklet kaskı ve diğer önlem uygulamalarına, veya insanların satın alabileceği ürünlere, elektronik eşya satın alma yaygınlığı yani insanlararası olan herhangi bir yaygınlıktan söz ediyorum. Bir yeniliğin yayılma türü size şimdi göstereceğim yapı ile anlaşılabilir ve öngörülebilir.
So, as all of you probably know, the classic way of thinking about this is the diffusion-of-innovation, or the adoption curve. So here on the Y-axis, we have the percent of the people affected, and on the X-axis, we have time. And at the very beginning, not too many people are affected, and you get this classic sigmoidal, or S-shaped, curve. And the reason for this shape is that at the very beginning, let's say one or two people are infected, or affected by the thing and then they affect, or infect, two people, who in turn affect four, eight, 16 and so forth, and you get the epidemic growth phase of the curve. And eventually, you saturate the population. There are fewer and fewer people who are still available that you might infect, and then you get the plateau of the curve, and you get this classic sigmoidal curve. And this holds for germs, ideas, product adoption, behaviors, and the like. But things don't just diffuse in human populations at random. They actually diffuse through networks. Because, as I said, we live our lives in networks, and these networks have a particular kind of a structure.
Hepinizin bildiği gibi bunu düşünmenin klasik yolu yeniliğin-yayılması veya pazara tanıtılan ürünün kabul görme eğrisidir. Burada Y ekseninde etkilenen insanların yüzdesi X ekseninde ise zaman var. İlk başlarda, çok fazla insan etkilenmemiş, ve bu klasik sigmoid şekilli, veya S biçimli eğriyi elde ediyoruz. Ve bu şeklin sebebi ilk başlarda, bir veya iki kişi diyelim, etkileniyor veya bulaşıyor sonra bunlar iki kişiyi etkiliyor veya onlara bulaştırıyor onlar da dört, sekiz, 16 kişiyi vs. Ve eğrinin salgın büyüme kısmını elde ediyorsunuz. Ve salgın nüfusun büyük kısmına yayılınca doygunluğa ulaşıyor. Salgının yayılabileceği insan sayısı zaman ilerledikçe azalıyor ve eğrinin sondaki düz kısmına ulaşıyorsunuz. ve toplamda da bu S biçimli eğriyi elde ediyorsunuz. Bu biçim mikroplar için doğru olduğu kadar, fikirler davranışlar, pazara sunulan yeni ürünün benimsenmesi için de geçerli. Fakat bunlar yalnızca insan nüfusuna rastgele yayılmaz. Aslında ağlar aracılığıyla yayılırlar. Çünkü, söylediğim gibi, hayatımızı ağlarda geçiriyoruz, ve bu ağlar özel bir yapıya sahip.
Now if you look at a network like this -- this is 105 people. And the lines represent -- the dots are the people, and the lines represent friendship relationships. You might see that people occupy different locations within the network. And there are different kinds of relationships between the people. You could have friendship relationships, sibling relationships, spousal relationships, co-worker relationships, neighbor relationships and the like. And different sorts of things spread across different sorts of ties. For instance, sexually transmitted diseases will spread across sexual ties. Or, for instance, people's smoking behavior might be influenced by their friends. Or their altruistic or their charitable giving behavior might be influenced by their coworkers, or by their neighbors. But not all positions in the network are the same.
Şimdi eğer bu tarz bir ağa bakarsanız ... Burada 105 insan var. Noktalar insanları, ve çizgiler de arkadaşlık ilişkilerini temsil ediyor. Gördüğünüz gibi insanlar ağda farklı yerlerde bulunuyor. Ve insanlar arasında farklı türde ilişkiler var. Bunlar, arkadaşlık bağı, kardeşlik bağı, karı koca bağı, iş arkadaşlığı ya da komşuluk bağı gibi.. Ve farklı şeyler farklı ilişkiler ile yayılır Örneğin cinsel yolla bulaşan hastalıklar cinsel ilişki ile yayılır Veya örneğin, bir insanın sigara içmesinin nedeni sigara içen arkadaşlarından etkilenmesi olabilir. veya o kişinin bencil olmayan ve hayırsever davranışlarının nedeni iş arkadaşlarından etkilenmesi olabilir, ya da komşularından. Ancak ağdaki her nokta aynı değil.
So if you look at this, you might immediately grasp that different people have different numbers of connections. Some people have one connection, some have two, some have six, some have 10 connections. And this is called the "degree" of a node, or the number of connections that a node has. But in addition, there's something else. So, if you look at nodes A and B, they both have six connections. But if you can see this image [of the network] from a bird's eye view, you can appreciate that there's something very different about nodes A and B. So, let me ask you this -- I can cultivate this intuition by asking a question -- who would you rather be if a deadly germ was spreading through the network, A or B? (Audience: B.) Nicholas Christakis: B, it's obvious. B is located on the edge of the network. Now, who would you rather be if a juicy piece of gossip were spreading through the network? A. And you have an immediate appreciation that A is going to be more likely to get the thing that's spreading and to get it sooner by virtue of their structural location within the network. A, in fact, is more central, and this can be formalized mathematically. So, if we want to track something that was spreading through a network, what we ideally would like to do is to set up sensors on the central individuals within the network, including node A, monitor those people that are right there in the middle of the network, and somehow get an early detection of whatever it is that is spreading through the network.
Eğer buna bakarsanız, hemen fark edeceksiniz ki değişik insanların değişik sayıda ilişkisi var. Bazı insanların bir, bazılarının iki kimisinin altı, kimisinin de on tane bağlantısı var. Buna noktanın (düğümün), derecesi, ya da o noktanın sahip olduğu bağlantı sayısı denir. Ancak bundan öte, başka bir şey daha var. Eğer A ve B noktalarına bakarsanız, her ikisinin de altı bağlantısı var. Oysa bu ağın resmini kuş bakışı açısından görebilseniz A ve B noktalarının arasında bir şeyin çok farklı olduğunu keşfedeceksiniz keşfedeceksiniz. Size şunu sormak istiyorum, -- Bu sezgiyi sizde bir soru sorarak sizde uyandırabilirim -- Eğer ölümcül bir mikrop yayılıyorsa hangisi olmayı yeğlersiniz? A ya da B? (Dinleyici: B) Nicholas Christakis: B, açık ve seçik olarak. B ağın ucunda yer alıyor. Pekala, eğer ilginizi çekebilecek bir dedikodu yayılıyorsa, hangisi olmayı yeğlersiniz? A. Hemen kavrayacağınız üzere ağın yapısı ve A'nın ağdaki konumu nedeniyle A'nın yayılan "şeyleri" daha çabuk alacağı açıktır. A, gerçekten, daha merkezde ve bu matematiksel olarak ifade edilebilir. Bu yüzden, eğer ağ boyunca yayılan bir şeyi izlemek istiyorsak, Mantıklı olanı, ağın merkezindeki noktalara algılayıcılar yerleştirip, ki A da buna dahil; daha sonra bu merkezdeki noktaları/insanları gözlemleriz, ve bir şekilde ağda yayılan "şeyi" erkenden tespit etmemiz mümkün olur.
So if you saw them contract a germ or a piece of information, you would know that, soon enough, everybody was about to contract this germ or this piece of information. And this would be much better than monitoring six randomly chosen people, without reference to the structure of the population. And in fact, if you could do that, what you would see is something like this. On the left-hand panel, again, we have the S-shaped curve of adoption. In the dotted red line, we show what the adoption would be in the random people, and in the left-hand line, shifted to the left, we show what the adoption would be in the central individuals within the network. On the Y-axis is the cumulative instances of contagion, and on the X-axis is the time. And on the right-hand side, we show the same data, but here with daily incidence. And what we show here is -- like, here -- very few people are affected, more and more and more and up to here, and here's the peak of the epidemic. But shifted to the left is what's occurring in the central individuals. And this difference in time between the two is the early detection, the early warning we can get, about an impending epidemic in the human population.
Eğer o noktaların mikropla temas ettiğini ya da bir "şey" öğrendiğini görürseniz, yakın zamanda herkesin o mikropla temas edeceğini ya da o bir "şey"i öğreneceğini biliyorsunuz. Ve bu ağın yapısı referans alınmadan rastgele seçilen altı kişi gözetlemekten çok daha iyidir. Ve gerçekten, eğer bunu yapabilirseniz göreceğiniz şunun gibi bir şey olacaktır. Sol tarafta, yine, S biçimli salgın eğrimiz var. Noktalı kırmızı çizgiyle salgının rastgele insanlar arasında nasıl yayılabileceğini; ve solundaki, sola doğru kaydırılmış eğride de salgının ağın merkezindeki insanlarda nasıl yayılacağını gösteriyoruz. Y doğrultusu toplam salgın vak'a sayısını; X doğrultusu da zamanı gösteriyor. Ve sağ tarafta, aynı veriyi gösteriyoruz ancak; burada gösterilen günlük vak'alar. Ve burada gösterdiğimiz ise , -- örneğin burada -- çok az sayıda insan etkilenmiş, ilerledikçe ise daha fazla sayıda etkileniyor ve burası da salgının tepe noktası. Sola kaydırılmış eğri, merkezdeki bireylerde ne olduğunu gösteriyor. ve ikisi arasındaki bu zaman farklılığı bize yakında insan nüfusu arasında gerçekleşecek olan salgının erken uyarısını verir.
The problem, however, is that mapping human social networks is not always possible. It can be expensive, not feasible, unethical, or, frankly, just not possible to do such a thing. So, how can we figure out who the central people are in a network without actually mapping the network? What we came up with was an idea to exploit an old fact, or a known fact, about social networks, which goes like this: Do you know that your friends have more friends than you do? Your friends have more friends than you do, and this is known as the friendship paradox. Imagine a very popular person in the social network -- like a party host who has hundreds of friends -- and a misanthrope who has just one friend, and you pick someone at random from the population; they were much more likely to know the party host. And if they nominate the party host as their friend, that party host has a hundred friends, therefore, has more friends than they do. And this, in essence, is what's known as the friendship paradox. The friends of randomly chosen people have higher degree, and are more central than the random people themselves.
Fakat sorun ise; insanların sosyal ağlarının bir haritasını çıkarmanın her zaman mümkün olmadığıdır. Çok pahalı olabilir [çok zor] ahlaki olmayabilir, veya, dürüstçe söylemem gerekirse, mümkün de değil. Öyleyse, kimin ağın merkezinde olduğunu ağın haritasını çıkarmadan nasıl anlayabiliriz? Bunun üzerine aklımıza, eski bir bilgiyi, daha doğrusu sosyal ağlarla ilgili bilinen bir bilgiyi kullanmak geldi. Şöyle ki: Arkadaşlarının senden daha fazla arkadaşının olduğunu biliyor musun? Arkadaşlarının senden daha fazla arkadaşı var. Bu arkadaşlık paradoksu [çelişkisi] olarak bilinir. İlk olarak, çevresinde çok revaçta olan birini düşünün, örneğin yüzlerce arkadaşına parti veren birisi; ve bir de herkesten kaçan ve yalnızca bir arkadaşı olan birini düşünün. ve kümeden rastgele birisini seçiyorsunuz ve bu seçtiğiniz kişiler büyük olasılıkla partiyi düzenleyeni tanıyacaktır. Eğer ki bu kişiler parti sahibini arkadaşı olarak tanımlarlarsa, partiyi düzenleyenin yüzlerce arkadaşı vardır. bu nedenle de herkesten daha çok arkadaşı vardır. ve de bu temelde arkadaşlık çelişkisi olarak bilinir. Rastgele seçilenin arkadaşlarının derecesi, daha fazladır ve bu yüzden rastgele seçilen kişilere göre daha merkezdedirler.
And you can get an intuitive appreciation for this if you imagine just the people at the perimeter of the network. If you pick this person, the only friend they have to nominate is this person, who, by construction, must have at least two and typically more friends. And that happens at every peripheral node. And in fact, it happens throughout the network as you move in, everyone you pick, when they nominate a random -- when a random person nominates a friend of theirs, you move closer to the center of the network. So, we thought we would exploit this idea in order to study whether we could predict phenomena within networks. Because now, with this idea we can take a random sample of people, have them nominate their friends, those friends would be more central, and we could do this without having to map the network.
Eğer ki bu ağın kenarındaki insanları düşünecek olursanız, anlatılanı sezgisel olarak kavrayabilirsiniz. Eğer bu kişiyi seçerseniz, arkadaş olarak tanımlayacağı tek kişi budur mantıksal olarak da bu kişin de, en azından iki ve genel olarak daha fazla arkadaşı olmalıdır. ve bu mantık tüm kenardaki bireyler için geçerlidir. Daha da doğrusu, ağda içeri ilerledikçe bu varsayım geçerlidir. Seçtiğiniz kişi, diğerleri tarafından arkadaş olarak tanımlandıkça; ağın merkezine doğru gidiyorsunuz demektir. Bu yüzden biz de bu bilgiyle ; ağ içinde gerçekleşebilecek bir olayı öngörmek için kullanmanın yollarını araştırdık. Bu fikir sayesinde; insanlar arasından rastgele bir seçim yapabilir, daha merkezde olabilecek arkadaşlarını göstermelerini isteyebilir, ve bu işlemi tüm ağın haritasını çıkarmadan yapabiliriz.
And we tested this idea with an outbreak of H1N1 flu at Harvard College in the fall and winter of 2009, just a few months ago. We took 1,300 randomly selected undergraduates, we had them nominate their friends, and we followed both the random students and their friends daily in time to see whether or not they had the flu epidemic. And we did this passively by looking at whether or not they'd gone to university health services. And also, we had them [actively] email us a couple of times a week. Exactly what we predicted happened. So the random group is in the red line. The epidemic in the friends group has shifted to the left, over here. And the difference in the two is 16 days. By monitoring the friends group, we could get 16 days advance warning of an impending epidemic in this human population.
Bu fikri, 2009'un sonbaharı ve kışında; - yalnızca birkaç ay önce - H1N1 [Domuz] gribi için Harvard Üniversitesinde test ettik. 1300 rastgele üniversite öğrencisi seçtik, ve arkadaşlarını göstermelerini istedik. ve hem rastgele seçilen öğrenciyi hem de arkadaşlarını günlük olarak gribe yakalanıp yakalanmadıklarını takip ettik. Bunu da dolaylı olarak, bu öğrencilerin sağlık merkezine gidip gitmediklerine bakarak elde ettik. ve ayrıca, doğrudan da bize haftada birkaç tane e-posta göndermelerini istedik. Aynen öngördüğümüz gerçekleşti. Rastgele seçilen grup kırmızı çizgi, Arkadaş grubunda ise salgın eğrisi sola kaydı, buraya doğru. ve ikisi arasındaki fark ise 16 gün. Arkadaş grubunu gözlemleyerek bu insan topluluğu içerisinde yaklaşan salgın için 16 günlük bir erken uyarı zamanı elde edebildik.
Now, in addition to that, if you were an analyst who was trying to study an epidemic or to predict the adoption of a product, for example, what you could do is you could pick a random sample of the population, also have them nominate their friends and follow the friends and follow both the randoms and the friends. Among the friends, the first evidence you saw of a blip above zero in adoption of the innovation, for example, would be evidence of an impending epidemic. Or you could see the first time the two curves diverged, as shown on the left. When did the randoms -- when did the friends take off and leave the randoms, and [when did] their curve start shifting? And that, as indicated by the white line, occurred 46 days before the peak of the epidemic. So this would be a technique whereby we could get more than a month-and-a-half warning about a flu epidemic in a particular population.
Buna ek olarak Eğer örneğin, salgınları ya da pazara sunulan bir ürünün yayılmasını inceleyen bir çözümleyici [analist] iseniz, yapacağınız örnek kümenizden rastgele bir kişi seçip arkadaşlarını belirleyip, hem o kişiyi hem de arkadaşlarını gözlemlemektir. Arkadaşlar içinde, yaygınlık eğrisindeki küçük artış eli kulağında olan bir salgının ya da yeniliği kabullenmenin ilk kanıtıdır. Ya da sol tarafta, iki eğrinin birbirinden ıraksamaya başladığı ilk noktayı görüyorsunuz. Ne zaman arkadaş grubu artışa geçiyor ve rastgele seçilenleri geride bırakıyor ve ne zaman eğri kaymaya başlıyor? Bu beyaz çizgiyle gösterildiği gibi salgının en yaygın hale ulaşmasından 46 gün önce olmuş. Yani, bu belli bir topluluktaki grip salgınını bir buçuk ay gibi bir zaman öncesinden belirlemenin bir yöntemi olabilir.
I should say that how far advanced a notice one might get about something depends on a host of factors. It could depend on the nature of the pathogen -- different pathogens, using this technique, you'd get different warning -- or other phenomena that are spreading, or frankly, on the structure of the human network. Now in our case, although it wasn't necessary, we could also actually map the network of the students.
Şunu da belirtmeliyim ki; erken belirlemenin süresi birçok etkene bağlıdır. Patojenin doğasına bağlı olabilir -- farklı patojenlerle bu yöntemi kullanarak farklı erken uyarılar elde edersiniz veya da yayılan bir olayı... ya da insan sosyal ağının yapısını... Bizim örneğimizde, gerekli değilse de öğrencilerin ağını haritalandırabiliriz.
So, this is a map of 714 students and their friendship ties. And in a minute now, I'm going to put this map into motion. We're going to take daily cuts through the network for 120 days. The red dots are going to be cases of the flu, and the yellow dots are going to be friends of the people with the flu. And the size of the dots is going to be proportional to how many of their friends have the flu. So bigger dots mean more of your friends have the flu. And if you look at this image -- here we are now in September the 13th -- you're going to see a few cases light up. You're going to see kind of blooming of the flu in the middle. Here we are on October the 19th. The slope of the epidemic curve is approaching now, in November. Bang, bang, bang, bang, bang -- you're going to see lots of blooming in the middle, and then you're going to see a sort of leveling off, fewer and fewer cases towards the end of December. And this type of a visualization can show that epidemics like this take root and affect central individuals first, before they affect others.
Bu 714 öğrencinin ve arkadaşlık bağlarının yer aldığı bir harita. Ve bir dakika içerisinde,bunu inceleyeceğiz. Bu ağdan 120 gün boyunca günlük örnekler alacağız Kırmızı noktalar grip vak'asını, sarı noktalar ise grip olanların arkadaşlarını, ve noktaların boyutu da o noktanın grip olan arkadaş sayısını gösteriyor. Yani, büyük noktalar daha çok arkadaşınızın grip olduğu anlamında. Bu şekle bakarsanız -- burada 13 Eylüldeyiz -- az miktarda vak'anın oluştuğunu göreceksiniz. ve burada ortada grip vak'alarında adeta bir patlama yaşandığını görüyorsunuz. Burada 19 Ekimdeyiz. ve Kasım ayında eğrinin eğimi artıyor ve ... Bum, bum bum. Ortada vaka'a sayısında bir patlama olduğunu görüyorsunuz. ve ardından bir tür denge durumunu görüyorsunuz. Aralığın sonuna doğru da vak'alar gittikçe azalıyor. Bu tür bir görsel açıklama, bu tür salgınların başkalarını etkilemeden önce ilk olarak merkezdeki bireylerde kök saldığını ve onları etkilediğini gösteriyor.
Now, as I've been suggesting, this method is not restricted to germs, but actually to anything that spreads in populations. Information spreads in populations, norms can spread in populations, behaviors can spread in populations. And by behaviors, I can mean things like criminal behavior, or voting behavior, or health care behavior, like smoking, or vaccination, or product adoption, or other kinds of behaviors that relate to interpersonal influence. If I'm likely to do something that affects others around me, this technique can get early warning or early detection about the adoption within the population. The key thing is that for it to work, there has to be interpersonal influence. It cannot be because of some broadcast mechanism affecting everyone uniformly.
Ben bu yöntemin yalnızca mikroplara değil, tüm topluluk içerisinde yayılan bir "şey"e de uygulanabileceğini öne sürüyorum. Bilgi topluluklar içinde yayılır... Kurallar topluluklar içerisinde yayılabilir... Davranışlar topluluklar içerisinde yayılabilir... Davranışlar derken, kastettiğim suç içeren davranışlar gibi.. veya oy verme gibi, veya sağlığa özen davranışı gibi, örneğin sigara içme ya da aşılanma... ya da ürün yaygınlaşması, veya insanlararası etkileşimle ortaya çıkan diğer tüm çeşit davranışlar gibi. Eğer başkalarını da etkileyecek bir şey yapıyorsam, bu yöntem ile bu "şey"in toplulukta yayılmasıyla ilgili erken uyarı ya da erken belirleme sağlayabiliriz. Bu yöntemin işe yaraması için kilit nokta, insanlar arası bir etkileşimin var olması gerekir. Yayılma mekanizması herkesi aynı ölçüde etkilemeyebilir.
Now the same insights can also be exploited -- with respect to networks -- can also be exploited in other ways, for example, in the use of targeting specific people for interventions. So, for example, most of you are probably familiar with the notion of herd immunity. So, if we have a population of a thousand people, and we want to make the population immune to a pathogen, we don't have to immunize every single person. If we immunize 960 of them, it's as if we had immunized a hundred [percent] of them. Because even if one or two of the non-immune people gets infected, there's no one for them to infect. They are surrounded by immunized people. So 96 percent is as good as 100 percent. Well, some other scientists have estimated what would happen if you took a 30 percent random sample of these 1000 people, 300 people and immunized them. Would you get any population-level immunity? And the answer is no. But if you took this 30 percent, these 300 people and had them nominate their friends and took the same number of vaccine doses and vaccinated the friends of the 300 -- the 300 friends -- you can get the same level of herd immunity as if you had vaccinated 96 percent of the population at a much greater efficiency, with a strict budget constraint.
Aynı kavrayışlar -- ağlar için olduğu kadar-- başka konular için de kullanılabilir. örneğin, bir konuya müdahale için belirli kişileri seçmede kullanılabilir. Örneğin, muhtemelen "sürü bağışıklığı" kavramı çoğunuza tanıdık geliyor olabilir. Yani, eğer bin kişiden oluşan bir topluluğumuz varsa ve o topluluğa bir patojene karşı bağışıklık kazandırmak istiyorsak. herkesi bağışık hale getirmemiz gerekmez. 960 kişinin bağışıklık kazanması; topluğun hepsinin bağışıklık kazanması ile eşdeğerdir. Çünkü bir ya da iki bağışık olmayan kişi hastalansa bile, onların etkileyeceği başka insan yoktur. Çünkü çevresindekilerin hepsi bağışık insanlardır. Yani, yüzde 96 yüzde yüz ile eşdeğerdir. Bazı bilim insanları, bin kişiden yüzde 30'luk rastgele bir seçim yaparak, 300 kişiyi bağışık hale getirdikten sonra ne olacağını kestirmeye çalışmışlar. Topluluk düzeyinde bir bağışık elde eder miyiz? Yanıt, hayır. ancak eğer bu 300 kişiyi alır ve arkadaşlarını bulursanız, ve aynı miktarda aşı alır ve bu 300 kişinin 300 arkadaşını aşılarsanız sanki topluluğun yüzde 96sını aşılamış gibi bir "sürü bağışıklığı" düzeyi elde edersiniz ve bunu çok daha verimli şekilde ve kısıtlı bütçe ile yapmış olursunuz.
And similar ideas can be used, for instance, to target distribution of things like bed nets in the developing world. If we could understand the structure of networks in villages, we could target to whom to give the interventions to foster these kinds of spreads. Or, frankly, for advertising with all kinds of products. If we could understand how to target, it could affect the efficiency of what we're trying to achieve. And in fact, we can use data from all kinds of sources nowadays [to do this].
Benzer fikirler örneğin gelişmekte olan ülkelerde cibinlik dağıtılması ile ilgili kilit kişileri seçmekte kullanılabilir. Eğer köylerdeki ilişki ağının yapısını anlayabilirsek bu tür yaygınlaşmayı hızlandırabilmek için hedefimizin kim olduğunu bulabiliriz. Ya da samimi olmak gerekirse, her tür ürün reklamı için geçerlidir. Eğer nasıl hedeflememiz gerektiğini anlayabilirsek, verimliliği ya da neye ulaşmak istediğimizi olumlu yönde etkilemiş oluruz. Ve gerçekten de, bunu gerçekleştirmek için tüm değişik kaynaklardan verileri kullanabiliriz.
This is a map of eight million phone users in a European country. Every dot is a person, and every line represents a volume of calls between the people. And we can use such data, that's being passively obtained, to map these whole countries and understand who is located where within the network. Without actually having to query them at all, we can get this kind of a structural insight. And other sources of information, as you're no doubt aware are available about such features, from email interactions, online interactions, online social networks and so forth. And in fact, we are in the era of what I would call "massive-passive" data collection efforts. They're all kinds of ways we can use massively collected data to create sensor networks to follow the population, understand what's happening in the population, and intervene in the population for the better. Because these new technologies tell us not just who is talking to whom, but where everyone is, and what they're thinking based on what they're uploading on the Internet, and what they're buying based on their purchases. And all this administrative data can be pulled together and processed to understand human behavior in a way we never could before.
Bu bir avrupa ülkesindeki sekiz milyon telefon kullanıcısının haritası. Her nokta bir insanı ve her çizgi ise insanlar arasındaki arama yoğunluğunu gösteriyor. Ve tüm ülkenin haritasını çıkarmak için bu pasif yolla elde edilen verileri kullanabilir ve kişilerin ağın neresinde olduklarını anlayabiliriz. hem de kimseyi sorgulamak zorunda kalmadan bu tür bir yapısal kavrayış elde edebiliriz. Benzer yapı için diğer bilgi kaynakları da kullanılabilir, hepinizin bildiği gibi, e-posta alışverişi, sanal etkileşimler sanal sosyal ağlar vb.... Şu an, "Devasa - pasif" olarak adlandırdığım bilgi toplama çabalarının olduğu bir çağda yaşıyoruz. Toplanmış devasa bilgileri kullanabileceğimiz pek çok yöntem var, örneğin bir toplumu izlemek için, algılayıcı ağlar yaratmak, toplumda olan biteni anlayabilmek, ve toplumun iyiliği için ortama müdahele etmek gibi şeyler. Çünkü bu yeni teknolojiler bize yalnızca kimin kimle konuştuğunu değil kimlerin nerede olduğunu internete yüklediklerini temel alarak ne düşündüklerini, ve satın aldıklarına bakarak daha neler alacaklarını söylüyor. Ve tüm bu yönetsel veriler bir araya getirilebilir ve insan davranışlarını daha önce hiç olmadığı kadar anlamamız için işlenebilir.
So, for example, we could use truckers' purchases of fuel. So the truckers are just going about their business, and they're buying fuel. And we see a blip up in the truckers' purchases of fuel, and we know that a recession is about to end. Or we can monitor the velocity with which people are moving with their phones on a highway, and the phone company can see, as the velocity is slowing down, that there's a traffic jam. And they can feed that information back to their subscribers, but only to their subscribers on the same highway located behind the traffic jam! Or we can monitor doctors prescribing behaviors, passively, and see how the diffusion of innovation with pharmaceuticals occurs within [networks of] doctors. Or again, we can monitor purchasing behavior in people and watch how these types of phenomena can diffuse within human populations.
Örneğin, tır sürücülerinin benzin satın almalarını inceleyebiliriz. Yani yalnızca tır sürücüleri tır kullanmıyorlar, benzin de satın alıyorlar. Ve onların benzin almalarındaki küçük artışa bakarak ekonomik durgunluğun sona ereceğini görebiliriz. Ya da mobil operatörler otobanda yolda yolculuk yapan insanların cep telefonlarının hızlarını ölçebilir ve hızın azaldığı yerlerde trafiğin yoğunlaşmaya başladığını anlayabilir. Ve bu bilgiyi tekrardan aynı yol üzerindeki trafik sıkışıklığına henüz varmamış abonelerine iletebilir. Ya da doktorların ilaç yazma davranışlarını inceleyebilir ve ilaç alanındaki bir yeniliğin doktorlar arasındaki bir ağda nasıl yaygınlaştığını görebiliriz. Ya da, insanların satın alma alışkanlıklarını gözlemleyebilir ve bu tür olayların insan topluluklarında nasıl yayıldığını izleyebiliriz.
And there are three ways, I think, that these massive-passive data can be used. One is fully passive, like I just described -- as in, for instance, the trucker example, where we don't actually intervene in the population in any way. One is quasi-active, like the flu example I gave, where we get some people to nominate their friends and then passively monitor their friends -- do they have the flu, or not? -- and then get warning. Or another example would be, if you're a phone company, you figure out who's central in the network and you ask those people, "Look, will you just text us your fever every day? Just text us your temperature." And collect vast amounts of information about people's temperature, but from centrally located individuals. And be able, on a large scale, to monitor an impending epidemic with very minimal input from people. Or, finally, it can be more fully active -- as I know subsequent speakers will also talk about today -- where people might globally participate in wikis, or photographing, or monitoring elections, and upload information in a way that allows us to pool information in order to understand social processes and social phenomena.
Sanırım bu devasa-pasif verilerin kullanılabileceği üç farklı yol var. İlki tamamen pasif, az önce tır sürücüleri örneğinde tanımladığım gibi. burada topluluğa bir müdahalede bulunmuyoruz. İkincisi yarı-etkin; domuz gribi örneğinde öğrencilerden arkadaşlarını göstermelerini istediğimiz gibi. ve daha sonra arkadaşlarını pasif olarak gözlemleyerek, grip olup olmadıklarına bakarak, erken tespitte bulunabiliriz. Diğeri örnek ise, eğer bir telefon operatörü iseniz, kimin ağın merkezinde olduğunu bulabilir ve onlara "bize her gün vücut sıcaklığını ölçüp yollar mısın?" diye sorabilirsiniz Yalnızca bize vücut sıcaklığını gönder... Ve bütün bu insanların vücut sıcaklıklarını toplayıp -- ama ağın merkezinde olan kişilerden -- ve büyük ölçekte ise, yayılmakta olan bir salgın hastalığı az miktarda veri toplayarak gözlemleyebilirsiniz. Ya da son olarak, bi sonraki konuşmacılar, insanların küresel olarak wiki'lere [imece bilgi topluluklarının] katkıda bulunabileceği, fotoğraflayabileceği, ya da seçimleri gözlemleyebileceklerinden, ve bu bilgileri bizim bir araya getirerek sosyal olay ve olguları anlamamızı sağlayacak şekilde nasıl paylaşabileceklerinden bahsedecekler.
In fact, the availability of these data, I think, heralds a kind of new era of what I and others would like to call "computational social science." It's sort of like when Galileo invented -- or, didn't invent -- came to use a telescope and could see the heavens in a new way, or Leeuwenhoek became aware of the microscope -- or actually invented -- and could see biology in a new way. But now we have access to these kinds of data that allow us to understand social processes and social phenomena in an entirely new way that was never before possible. And with this science, we can understand how exactly the whole comes to be greater than the sum of its parts. And actually, we can use these insights to improve society and improve human well-being.
Doğrusu, bu verilerin ulaşılabildiği, bence benim ve benim gibilerin "sayısal sosyal bilimler" olarak adlandırdığı yeni bir çağın habercisi. Bu biraz Galileo'nun teleskobu kullanarak yıldızları farklı bir gözle incelemesi gibi bir şey, ya da Leewenhoek'in mikroskobu keşfederek -- daha doğrusu icat ederek-- biyolojide yeni bir çağ açması gibi bir şey. Artık bizim bu tür verilere erişimimiz var ve bu durum sosyal olayları ve olguları daha önce hiç olmadığı bir şekilde görmemizi ve anlamamızı sağlayacak. Ve bu bilim ile, bir araya gelmiş toplamın nasıl tek tek küçük parçaların toplamından daha değerli olduğunu anlıyoruz. Ve gerçekten de, bu kavrayışı kullanarak toplumun ve insanların esenliklerini arttırabiliriz.
Thank you.
Sağ olun.