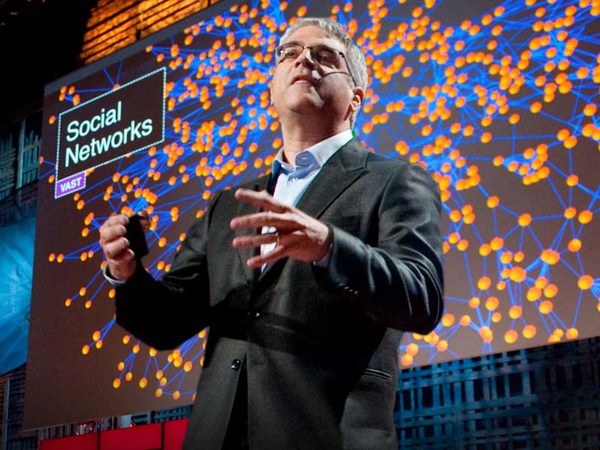
For the last 10 years, I've been spending my time trying to figure out how and why human beings assemble themselves into social networks. And the kind of social network I'm talking about is not the recent online variety, but rather, the kind of social networks that human beings have been assembling for hundreds of thousands of years, ever since we emerged from the African savannah. So, I form friendships and co-worker and sibling and relative relationships with other people who in turn have similar relationships with other people. And this spreads on out endlessly into a distance. And you get a network that looks like this. Every dot is a person. Every line between them is a relationship between two people -- different kinds of relationships. And you can get this kind of vast fabric of humanity, in which we're all embedded.
Under de senaste 10 åren, har jag använt min tid till att klura ut hur och varför människor börjar samla sig i sociala nätverk. Och den sorts sociala nätverk jag talar om är inte den nya onlinevarianten, utan, den typ av sociala nätverk som människor har samlats inom under hundratusentals år, ända sedan vi dök upp på den Afrikanska savannen. Så, jag skapar vänskaps-, arbets-, syskon- och andra relationer med andra människor som i sin tur har liknande relationer med andra människor. Och detta sprider sig ändlöst utåt. Och du får ett nätverk som ser ut så här. Där varje punkt är en person. Där varje linje mellan dem är en relation mellan två människor -- olika typer av relationer. Och du får den typ av omfattande tyg av mänsklighet, som vi alla är inbäddade i.
And my colleague, James Fowler and I have been studying for quite sometime what are the mathematical, social, biological and psychological rules that govern how these networks are assembled and what are the similar rules that govern how they operate, how they affect our lives. But recently, we've been wondering whether it might be possible to take advantage of this insight, to actually find ways to improve the world, to do something better, to actually fix things, not just understand things. So one of the first things we thought we would tackle would be how we go about predicting epidemics.
Jag och min kollega, James Fowler, har studerat det ett bra tag nu vilka är de matematiska, sociala, biologiska och psykologiska reglerna som styr hur dessa nätverk sammansätts och vilka är de liknande reglerna som styr hur de verkar, hur de påverkar våra liv. Och, nyligen har vi funderat på huruvida det är möjligt att dra nytta av denna insikt, för att verkligen hitta vägar till att förbättra världen, för att göra någonting bättre, för att verkligen fixa saker, inte bara förstå dem. Så en av de första sakerna vi tänkte tackla skulle vara hur vi går tillväga för för förutsäga epidemier.
And the current state of the art in predicting an epidemic -- if you're the CDC or some other national body -- is to sit in the middle where you are and collect data from physicians and laboratories in the field that report the prevalence or the incidence of certain conditions. So, so and so patients have been diagnosed with something, or other patients have been diagnosed, and all these data are fed into a central repository, with some delay. And if everything goes smoothly, one to two weeks from now you'll know where the epidemic was today. And actually, about a year or so ago, there was this promulgation of the idea of Google Flu Trends, with respect to the flu, where by looking at people's searching behavior today, we could know where the flu -- what the status of the epidemic was today, what's the prevalence of the epidemic today.
Det nuvarande bästa tillvägagångssättet för att förutsäga epidemier -- om du är på smittskyddsinstitutet (Am. CDC) eller någon annan myndighet -- är att sitta där du är och samla in data från läkare och laboratorier på fältet som rapporterar prevalens eller incidens av vissa sjukdommar. Patienter, där och där som blivit diagnostiserade med något [här borta] eller andra som blivit diagnostisera [här borta] och alla dessa data matas till en stor databas, med en viss fördröjning. Och om allt går som de ska en-två veckor från nu, kommer du veta vart epidemin var i förrgår. Och faktiskt, för ett år sen eller så, kom det ett offentliggörande om en idé om Google Flu Trends, med sikte på influensan, där man genom att titta på folks sökbeteende i dag, kunde veta vart flunsan... vad statusen för epidemin var i dag, vad prevalensen för epidemin är i dag.
But what I'd like to show you today is a means by which we might get not just rapid warning about an epidemic, but also actually early detection of an epidemic. And, in fact, this idea can be used not just to predict epidemics of germs, but also to predict epidemics of all sorts of kinds. For example, anything that spreads by a form of social contagion could be understood in this way, from abstract ideas on the left like patriotism, or altruism, or religion to practices like dieting behavior, or book purchasing, or drinking, or bicycle-helmet [and] other safety practices, or products that people might buy, purchases of electronic goods, anything in which there's kind of an interpersonal spread. A kind of a diffusion of innovation could be understood and predicted by the mechanism I'm going to show you now.
Men det jag skulle vilja visa dig i dag är ett sätt genom vilket vi möjligen får inte bara en tidig varning för epidemin, men också i själva verket en tidig detektering av en epidemi. Och, faktum är, denna idé kan användas inte bara för att förutsäga bakteriella epidemier, men även för att förutsäga alla typer av epidemier. Till exempel, alla saker som sprids genom en slags social smitta kan förklaras genom detta sätt, från abstrakta idéer till vänster som patriotism eller altruism eller religion, till tillvägagångsätt som dietbeteende eller bokköpande, eller drickande eller cykel-hjälms [och] eller andra säkerhetsdetaljer, eller produkter som folk kan tänka sig att köpa, inköp av elektronikvaror, vad som helst som där det finns en spridning mellan personer. En slags spridning av innovationer kan förstås och förutsägas genom mekanismen som jag kommer visa dig nu.
So, as all of you probably know, the classic way of thinking about this is the diffusion-of-innovation, or the adoption curve. So here on the Y-axis, we have the percent of the people affected, and on the X-axis, we have time. And at the very beginning, not too many people are affected, and you get this classic sigmoidal, or S-shaped, curve. And the reason for this shape is that at the very beginning, let's say one or two people are infected, or affected by the thing and then they affect, or infect, two people, who in turn affect four, eight, 16 and so forth, and you get the epidemic growth phase of the curve. And eventually, you saturate the population. There are fewer and fewer people who are still available that you might infect, and then you get the plateau of the curve, and you get this classic sigmoidal curve. And this holds for germs, ideas, product adoption, behaviors, and the like. But things don't just diffuse in human populations at random. They actually diffuse through networks. Because, as I said, we live our lives in networks, and these networks have a particular kind of a structure.
Så, som de flesta av er troligen vet, det klassiska sättet att tänka kring detta är spridning-av-innovation eller acceptanskurvan (eng. adoption curve). Så här på Y-axeln, har vi procent av folk som är berörda, och på X-axeln, har vi tid. Och i allra första början är inte alls så många berörda. och då får den klassiska sigmodala, eller S-formade, kurvan. Och ett skäl till denna form är att från första början, låt oss säga att en eller två personer har blivit påverkade eller infekterad av detta de påverkar, eller infekterar sedan två personer, som i sin tur påverkar fyra, åtta och 16 och så vidare, och du får den epidemiska tillväxtfasen på kurvan. Och till slut, så närmar du dig hela befolkning. Det är färre och färre människor kvar vilka fortfarande är möjliga att infektera, och där får du platån på kurvan, och du får den klassiska sigmodala kurvan. Och detta håller för bakterier, idéer, produktacceptans, beteenden, och liknande. Men saker sprider sig inte i den mänskliga populationen slumpmässigt. De sprider sig i själva verket genom nätverk. Eftersom vi lever våra liv i nätverk, och dessa nätverk har en speciell sorts struktur.
Now if you look at a network like this -- this is 105 people. And the lines represent -- the dots are the people, and the lines represent friendship relationships. You might see that people occupy different locations within the network. And there are different kinds of relationships between the people. You could have friendship relationships, sibling relationships, spousal relationships, co-worker relationships, neighbor relationships and the like. And different sorts of things spread across different sorts of ties. For instance, sexually transmitted diseases will spread across sexual ties. Or, for instance, people's smoking behavior might be influenced by their friends. Or their altruistic or their charitable giving behavior might be influenced by their coworkers, or by their neighbors. But not all positions in the network are the same.
Om du nu tittar på ett nätverk som detta... Detta är 105 människor. Och linjerna representerar ... prickarna är människor, och linjerna representerar vänskapsrelationer. Du ser kanske folk tar upp olika platser inom detta nätverk. Och det är olika slags relationer mellan människor. Du kan ha kamratskapsrelationer, syskonrelationer, äkta hälft relationer, arbetskamratsrelationer, grannrelationer och liknande. Och olika slags saker sprider sig tvärs olika typer av förbindelser. Till exempel, sexuellt överförbara sjukdomar. kommer sprida sig via sexuella förbindelser. Eller till exempel, människors rökvanor påverkar troligen av deras vänner. Eller deras altruistiska beteende att ge till välgörenhet påverkas troligen av deras arbetskamrater, eller av deras grannar. Men alla platser i nätverket är inte likadana.
So if you look at this, you might immediately grasp that different people have different numbers of connections. Some people have one connection, some have two, some have six, some have 10 connections. And this is called the "degree" of a node, or the number of connections that a node has. But in addition, there's something else. So, if you look at nodes A and B, they both have six connections. But if you can see this image [of the network] from a bird's eye view, you can appreciate that there's something very different about nodes A and B. So, let me ask you this -- I can cultivate this intuition by asking a question -- who would you rather be if a deadly germ was spreading through the network, A or B? (Audience: B.) Nicholas Christakis: B, it's obvious. B is located on the edge of the network. Now, who would you rather be if a juicy piece of gossip were spreading through the network? A. And you have an immediate appreciation that A is going to be more likely to get the thing that's spreading and to get it sooner by virtue of their structural location within the network. A, in fact, is more central, and this can be formalized mathematically. So, if we want to track something that was spreading through a network, what we ideally would like to do is to set up sensors on the central individuals within the network, including node A, monitor those people that are right there in the middle of the network, and somehow get an early detection of whatever it is that is spreading through the network.
Så när du tittar på detta, så inser du kanske omedelbart att olika människor har olika antal anknytningar. En del människor har en anknytning, en del två, några har sex, några har 10 anknytningar. Och detta kallas "rang" (eng. "degree") för en nod, eller antalet en anknytningar en nod har. Men det finns något annat också. Om du tittar på noderna A och B, så har då båda sex anknytningar. Men om du ser denna bild [av nätverket] från ett fågelperspektiv, så kommer du inse det är något väldigt annorlunda med noderna A och B. Så, låt mig ställa denna fråga till dig -- Kan jag förstärka din intuition genom a ställa frågan -- skulle du helst vara om en dödlig bakterie som sprider sig genom nätverket genom, A eller B? (Publiken: B). Nicholas Christakis: B det är ju uppenbart. B är placerar på kanten av nätverket. Och, vem skulle du heller vara om ett saftigt skvaller spridde sig genom nätverket? A. Då skulle du ha en omedelbar förståelse det är A som troligen har en bättre möjlighet att få reda på vad som sprider sig och få reda på det fortare genom dess unika strukturella plats inom nätverket. A är mer central och detta kan formellt beskrivas matematiskt. Så, om du vill följa någonting som sprider sig genom ett nätverk, så vad vi optimalt skulle vilja göra är sätta upp sensorer på centralt placerade individer i nätverket, inkludera nod A, övervaka människorna som är alldeles i mitten av nätverket. och genom detta sätt få en tidig detektering av vad än som sprider sig genom nätverket.
So if you saw them contract a germ or a piece of information, you would know that, soon enough, everybody was about to contract this germ or this piece of information. And this would be much better than monitoring six randomly chosen people, without reference to the structure of the population. And in fact, if you could do that, what you would see is something like this. On the left-hand panel, again, we have the S-shaped curve of adoption. In the dotted red line, we show what the adoption would be in the random people, and in the left-hand line, shifted to the left, we show what the adoption would be in the central individuals within the network. On the Y-axis is the cumulative instances of contagion, and on the X-axis is the time. And on the right-hand side, we show the same data, but here with daily incidence. And what we show here is -- like, here -- very few people are affected, more and more and more and up to here, and here's the peak of the epidemic. But shifted to the left is what's occurring in the central individuals. And this difference in time between the two is the early detection, the early warning we can get, about an impending epidemic in the human population.
Det vill säga, om du såg dem komma i kontakt med bakterier eller information, då skulle du veta att snart nog, skulle alla andra också få kontakt med denna bakterie eller infomation. Och detta skulle vara mycket bättre än att övervaka sex slumpmässigt valda människor, utan kunskap om hur populationen är strukturerad. Och faktum är, om du kunde göra detta, skulle du se något liknande detta. På den vänstra skärmen, återigen, har vi den S-formade kurvan över acceptansen. På den röda prickade linjen, visar vi vad acceptansen skulle vara med slumpmässigt valda människor, och i den vänster-hands linje, skiftade mot vänster, vi ser vad acceptansen skulle bli för centrala individer i nätverket. På Y-axeln är kumulerade smittan, och på X-axeln är tiden. Och på den högra sidan visar vi samma data, men här den dagliga incidensen. Och det vi visar här är --som, här -- att väldigt få människor är angripna, mer och mer och här uppe, och här kommer toppen av epidemin. Men till vänster är vad som händer de centralt placerade individerna. Och denna skillnad i tid mellan de två är den tidiga detektionen, den tidiga varningen vi kan få, om den annalkande epidemin i den mänskliga populationen.
The problem, however, is that mapping human social networks is not always possible. It can be expensive, not feasible, unethical, or, frankly, just not possible to do such a thing. So, how can we figure out who the central people are in a network without actually mapping the network? What we came up with was an idea to exploit an old fact, or a known fact, about social networks, which goes like this: Do you know that your friends have more friends than you do? Your friends have more friends than you do, and this is known as the friendship paradox. Imagine a very popular person in the social network -- like a party host who has hundreds of friends -- and a misanthrope who has just one friend, and you pick someone at random from the population; they were much more likely to know the party host. And if they nominate the party host as their friend, that party host has a hundred friends, therefore, has more friends than they do. And this, in essence, is what's known as the friendship paradox. The friends of randomly chosen people have higher degree, and are more central than the random people themselves.
Men problemet är dock, att mappande av mänskliga sociala nätverk inte alltid är möjligt. Det kan vara dyrt, [mycket svårt], oetiskt, eller, helt enkelt, bara omöjligt att göra en sådan sak. Så, hur kan vi klura ut vilka dessa centrala människor är i ett nätverk utan att verkligen mappa upp nätverket? Vad vi kom fram till var en idé som kunde utnyttja ett gammal faktum, eller känd egenskap kring sociala nätverk, vilken låter så här: Vet du om att dina vänner har fler vänner än du har? Dina vänner har fler vänner än du har. Detta är känt som vänskapsparadoxen. Föreställ dig en väldigt populär människa i det sociala nätverket -- som håller en fest och som har hundratals vänner -- och en misantrop som bara har en vän, och du väljer någon slumpmässigt från populationen: så är det mycket mera troligt att de känner personen som har festen. Och om de kallar festfixaren sin vän, så har festfixaren hundra vänner och har därigenom fler vänner än de har. Detta är, enkelt uttryckt, vad som är känt som vänskapsparadoxen. Vänner till slumpmässigt valda människor har högre grad, och är mer centrala, än de slumpmässigt valda människorna själva.
And you can get an intuitive appreciation for this if you imagine just the people at the perimeter of the network. If you pick this person, the only friend they have to nominate is this person, who, by construction, must have at least two and typically more friends. And that happens at every peripheral node. And in fact, it happens throughout the network as you move in, everyone you pick, when they nominate a random -- when a random person nominates a friend of theirs, you move closer to the center of the network. So, we thought we would exploit this idea in order to study whether we could predict phenomena within networks. Because now, with this idea we can take a random sample of people, have them nominate their friends, those friends would be more central, and we could do this without having to map the network.
Och du kan få en intuitiv förståelse för detta om du bara tänker dig människor vid utkanten av nätverket. Om du väljer denna person, den enda vän som de behöver nominera är denna person, vilken, genom konstruktionen, måste ha minst två, och typiskt fler än det, vänner. Detta inträffar vid varje nod i utkanten. Och faktum är, det inträffar genom hela nätverket när du rör dig inåt, varje du person du väljer, när de nominerar en slumpmässigt.. när en slumpmässigt vald person nominerar en vän till dem, rör du dig närmare centret av nätverket. Så, vi tänkte vi kunde utnyttja denna idé för att studera huruvida vi kunde förutsäga fenomen med nätverk. Eftersom nu, med denna idé, kan vi ta ett slummässigt urval av folk, få dem att nominera deras vänner, sådana vänner som kommer vara mer centrala, och vi kunde göra detta utan mappa upp nätverket.
And we tested this idea with an outbreak of H1N1 flu at Harvard College in the fall and winter of 2009, just a few months ago. We took 1,300 randomly selected undergraduates, we had them nominate their friends, and we followed both the random students and their friends daily in time to see whether or not they had the flu epidemic. And we did this passively by looking at whether or not they'd gone to university health services. And also, we had them [actively] email us a couple of times a week. Exactly what we predicted happened. So the random group is in the red line. The epidemic in the friends group has shifted to the left, over here. And the difference in the two is 16 days. By monitoring the friends group, we could get 16 days advance warning of an impending epidemic in this human population.
Och vi testade denna idé på utbrottet av H1N1-influensan på Harvard College under hösten och vintern 2009, bara för några månader sen. Vi tog 1300 slumpmässigt valda studenter som vi bad nominera sina vänner, och vi följde både de slumpmässigt valda studenterna och deras vänner dagligen för att om de hade fått influensa eller ej. Och vi gjorde detta passivt genom kolla om de hade gått till universitetets hälsocentral eller ej. De fick även [aktivt] e-posta oss några gånger i veckan. Exakt det vi hade förutspått hände. Så den slumpmässigt valda gruppen är den röda linjen. Epidemin i vängruppen är skiftad till vänster, borta här. Och skillnaden mellan de båda är 16 dagar. Genom att följa gruppen av vänner, kunde vi få en 16 dagar tidigare varning av den annalkande epidemin in denna mänskliga population.
Now, in addition to that, if you were an analyst who was trying to study an epidemic or to predict the adoption of a product, for example, what you could do is you could pick a random sample of the population, also have them nominate their friends and follow the friends and follow both the randoms and the friends. Among the friends, the first evidence you saw of a blip above zero in adoption of the innovation, for example, would be evidence of an impending epidemic. Or you could see the first time the two curves diverged, as shown on the left. When did the randoms -- when did the friends take off and leave the randoms, and [when did] their curve start shifting? And that, as indicated by the white line, occurred 46 days before the peak of the epidemic. So this would be a technique whereby we could get more than a month-and-a-half warning about a flu epidemic in a particular population.
Nu, i tillägg till detta, om du var en analytiker som försökte studera en epidemi eller till exempel förutsäga acceptansen av en produkt vad du skulle göra då är att ta ett slumpmässigt urval av populationen, och få dem att nominera deras vänner och följa dessa vänner, och både följa de slumpmässigt valda och deras vänner. Bland vänner, blippen ovanför noll som du såg är det första beviset på acceptans på innovationen, till exempel, skulle vara bevis på en annalkande epidemi. Eller så skulle du se det då kurvorna för första gången började gå åt olika håll, som visas här till vänster. När rörde sig de slumpmässiga... när rörde sig vänner i väg och lämnade de slumpmässiga, och [när började] deras kurva skifta? Och detta, indikerat av den vita linjen. inträffade 46 dagar före epidemins topp. Så detta kunde bli en teknik genom vilken vi kunde få mer än en en och en halv månads förvarning om en influensaepidemi i en specifik population.
I should say that how far advanced a notice one might get about something depends on a host of factors. It could depend on the nature of the pathogen -- different pathogens, using this technique, you'd get different warning -- or other phenomena that are spreading, or frankly, on the structure of the human network. Now in our case, although it wasn't necessary, we could also actually map the network of the students.
Jag bör säga att hur långt i förväg man får en indikation om något beror på en mängd faktorer. Det kan beror på patogenets natur -- olika slags patogener, med denna teknik, skulle ge olika varningar -- eller andra fenomen som sprider sig, eller, helt enkelt, beroende på strukturen av den mänskliga nätverket. I vårt fall, fastän det inte var nödvändigt, kunde vi även i själva verket mappa nätverket av studenter.
So, this is a map of 714 students and their friendship ties. And in a minute now, I'm going to put this map into motion. We're going to take daily cuts through the network for 120 days. The red dots are going to be cases of the flu, and the yellow dots are going to be friends of the people with the flu. And the size of the dots is going to be proportional to how many of their friends have the flu. So bigger dots mean more of your friends have the flu. And if you look at this image -- here we are now in September the 13th -- you're going to see a few cases light up. You're going to see kind of blooming of the flu in the middle. Here we are on October the 19th. The slope of the epidemic curve is approaching now, in November. Bang, bang, bang, bang, bang -- you're going to see lots of blooming in the middle, and then you're going to see a sort of leveling off, fewer and fewer cases towards the end of December. And this type of a visualization can show that epidemics like this take root and affect central individuals first, before they affect others.
Så, det är detta är kartan över 714 studenter. och deras vänskapsband. Och om en minut, kommer jag sätta igång rörelsen i denna karta. Vi kommer ta dagliga ögonblicksbilder av nätverket över 120 dagar. De röda prickarna kommer visa influensafallen, och de gula kommer vara vänner till människor med influensan. Och storleken på prickarna är proportionell mot hur många av deras vänner som influensan. Så större prickar betyder flera av dina vänner har influensan. Och om du tittar på den bild --här är vi nu den 13:e September -- du kommer se några få fall som lyser till. Du kommer få se uppblossande av influensan i mitten. Här är vi på den 19:e oktober. Lutningen på epidemikurvan närmar sig nu, i november. Pang, pang, pang, pang, pang, du kommer se ett massivt uppblossande i mitten, och sen kommer du se en slags avklingning, färre och färre fall mot slutet av december. Och denna typ av visualisering kan visa att epidemier som denna, rotar sig och påverkar centrala individer först, innan de påverkar andra.
Now, as I've been suggesting, this method is not restricted to germs, but actually to anything that spreads in populations. Information spreads in populations, norms can spread in populations, behaviors can spread in populations. And by behaviors, I can mean things like criminal behavior, or voting behavior, or health care behavior, like smoking, or vaccination, or product adoption, or other kinds of behaviors that relate to interpersonal influence. If I'm likely to do something that affects others around me, this technique can get early warning or early detection about the adoption within the population. The key thing is that for it to work, there has to be interpersonal influence. It cannot be because of some broadcast mechanism affecting everyone uniformly.
Som jag har sagt så är denna metod inte bara är begränsad till bakterier, utan fungerar för allt som sprider sig i populationer. Information sprider sig via populationer. Normer kan sprida sig i populationer. Beteenden kan sprida sig i populationer. Och med beteende menar jag företeelser som kriminella beteenden, eller valbeteenden eller hälsobeteenden, som rökning, eller vaccinationer, eller produktacceptans eller andra typer av beteenden som relaterar till interpersonell påverkan. Om jag är benägen att göra något som påverkar andra runt omkring mig, kan den här tekniken ge en tidig varning eller tidig detektion, angående mottagandet inom en population. Nyckeln här är, för att få det att fungera, måste det finnas interpersonell påverkan. Det kan inte vara på grund av någon slags utsändningsmekanism som påverkar alla likadant.
Now the same insights can also be exploited -- with respect to networks -- can also be exploited in other ways, for example, in the use of targeting specific people for interventions. So, for example, most of you are probably familiar with the notion of herd immunity. So, if we have a population of a thousand people, and we want to make the population immune to a pathogen, we don't have to immunize every single person. If we immunize 960 of them, it's as if we had immunized a hundred [percent] of them. Because even if one or two of the non-immune people gets infected, there's no one for them to infect. They are surrounded by immunized people. So 96 percent is as good as 100 percent. Well, some other scientists have estimated what would happen if you took a 30 percent random sample of these 1000 people, 300 people and immunized them. Would you get any population-level immunity? And the answer is no. But if you took this 30 percent, these 300 people and had them nominate their friends and took the same number of vaccine doses and vaccinated the friends of the 300 -- the 300 friends -- you can get the same level of herd immunity as if you had vaccinated 96 percent of the population at a much greater efficiency, with a strict budget constraint.
Samma insikter kan även utnyttjas -- med avseende på nätverk -- kan även utnyttjas på andra slags sätt, till exempel, för att målsöka specifika människor för interventioner. Så, till exempel är nog de flesta av er familjära med uttrycket flockimmunitet. Så om vi har en population med tusen människor, och vi vill göra populationen immun mot en patogen då behöver vi inte immunisera varenda enskild person. Om vi immunisera 960 av dem, så är det som om vi hade immuniserat hundra [procent] av dem. Därför att även om en eller två av de ickeimmuna människorna smittas, så finns det ingen för dem att smitta. De omringas av immuna människor. Så 96 procent är lika bra som 100 procent. Nåväl, andra vetenskapsmän har estimerat vad som skulle hända om man tog ett 30-procentigt slumpmässigt prov av dessa 1000 människor, dvs 300 och immuniserade dem. Skulle man då få någon immunitet på populationsnivå? Och svaret är nej. Men om du tog dessa 30 procent, dessa 300 människor, och de fick nominera sina vänner och tog samma antal vaccinationsdoser och vaccinerade vänner till de 300, de 300 vänner, så skulle du få samma nivå av flockimmunitet. som om du vaccinerade 96 procent av populationen och med en mycket högre effektivitet och med en mycket lägre budget.
And similar ideas can be used, for instance, to target distribution of things like bed nets in the developing world. If we could understand the structure of networks in villages, we could target to whom to give the interventions to foster these kinds of spreads. Or, frankly, for advertising with all kinds of products. If we could understand how to target, it could affect the efficiency of what we're trying to achieve. And in fact, we can use data from all kinds of sources nowadays [to do this].
Och liknande idéer kan användas, till exempel, för att fokusera distributionen av saker som myggnät för sängar i U-länder. Om vi kunde förstå strukturen hos nätverken i byarna, kunde vi fokusera på till vilka vi skulle ge detta stöd för att främja att dessa saker sprids. Eller, frankt, för att annonsera alla typer av produkter. Om vi kunde förstå hur man inriktar arbetet, kunde detta på påverka effektiviteten på det vi försöker nå till. Och faktum är vi kunde använda data från alla typer av källor som finns i dag [för att göra detta].
This is a map of eight million phone users in a European country. Every dot is a person, and every line represents a volume of calls between the people. And we can use such data, that's being passively obtained, to map these whole countries and understand who is located where within the network. Without actually having to query them at all, we can get this kind of a structural insight. And other sources of information, as you're no doubt aware are available about such features, from email interactions, online interactions, online social networks and so forth. And in fact, we are in the era of what I would call "massive-passive" data collection efforts. They're all kinds of ways we can use massively collected data to create sensor networks to follow the population, understand what's happening in the population, and intervene in the population for the better. Because these new technologies tell us not just who is talking to whom, but where everyone is, and what they're thinking based on what they're uploading on the Internet, and what they're buying based on their purchases. And all this administrative data can be pulled together and processed to understand human behavior in a way we never could before.
Den här kartan visar åtta miljoner telefonanvändare i ett europeiskt land. Varje punkt är en person och varje linje visar volymen av samtal mellan dessa människor. Och vi kan använda sådan data, som är passivt insamlat, för att mappa hela länder och förstå vilka som är lokaliserade var inom nätverket. Utan att verkligen behöva fråga dem överhuvudtaget, kan vi få denna strukturella insikt. Och andra källor av information, som du säkert vet, är tillgängliga att få sådan egenskaper från, från e-post konversation internet-interaktioner social nätverk på internet och så vidare. Och faktum är, vi är i en era av jag skulle kalla "massiv-passiv" data insamling. Det är alla olika vägar vi kan använda för massiv datainsamling för att skapa sensornätverk för att följa populationen, för att förstå vad som händer i en population, och för att ingripa för populationens bästa. Eftersom dessa nya tekniker berättar för oss inte bara vem som pratar med vem, men även var varje människa är, och vad de tänker, baserat på vad de laddar upp på nätet, och vad de köper baserat på deras inköp. Och alla dessa administrativa data kan fogas samman och processas så att vi förstår mänskligt beteende på ett sätt vi inte tidigare kunde.
So, for example, we could use truckers' purchases of fuel. So the truckers are just going about their business, and they're buying fuel. And we see a blip up in the truckers' purchases of fuel, and we know that a recession is about to end. Or we can monitor the velocity with which people are moving with their phones on a highway, and the phone company can see, as the velocity is slowing down, that there's a traffic jam. And they can feed that information back to their subscribers, but only to their subscribers on the same highway located behind the traffic jam! Or we can monitor doctors prescribing behaviors, passively, and see how the diffusion of innovation with pharmaceuticals occurs within [networks of] doctors. Or again, we can monitor purchasing behavior in people and watch how these types of phenomena can diffuse within human populations.
Så till exempel, vi kunde använda lastbilschaufförers inköp av bränsle. Chaufförerna gör bara sitt jobb och köper bränsle. Och vi ser en hopp uppåt i chaufförernas inköp av bränsle, och vi vet att att lågkonjunkturen är på väg ta slut. Eller så kan vi övervaka hastigheten med vilken människorna rör sig på en motorväg, genom deras mobiler, och telefonbolaget kan se, genom att hastigheten minskar, att det är trafikstockning. Och de kan mata tillbaka denna information till sina kunder, men bara till kunderna på samma motorväg som befinner sig innan trafikstockningen. Eller så kan vi följa läkares utskrivningsmönster, passivt, och se hur produktacceptansen hos läkemedel utvecklar sig [genom nätverk av] läkare. Eller återigen, vi kan följa inköpsbeteenden hos människor, och se hur dessa olika typer av fenomen kan diffundera genom mänskliga populationer.
And there are three ways, I think, that these massive-passive data can be used. One is fully passive, like I just described -- as in, for instance, the trucker example, where we don't actually intervene in the population in any way. One is quasi-active, like the flu example I gave, where we get some people to nominate their friends and then passively monitor their friends -- do they have the flu, or not? -- and then get warning. Or another example would be, if you're a phone company, you figure out who's central in the network and you ask those people, "Look, will you just text us your fever every day? Just text us your temperature." And collect vast amounts of information about people's temperature, but from centrally located individuals. And be able, on a large scale, to monitor an impending epidemic with very minimal input from people. Or, finally, it can be more fully active -- as I know subsequent speakers will also talk about today -- where people might globally participate in wikis, or photographing, or monitoring elections, and upload information in a way that allows us to pool information in order to understand social processes and social phenomena.
Och det finns tre olika sätt, tror jag, som dessa massiv-passiva data kan användas på. Ett är helt passivt, som jag tidigare beskrivit -- som i exemplet om lastbilschaufförerna, där vi vi inte ingriper i populationen på något sätt alls. En är kvasi-aktiv, som influensaexemplet jag gav, där vi får några människor att nominera sin vänner och sen passivt följa deras vänner -- har de eller har de inte influensan? .. och få en varning. Eller ett annat exempel skulle kunna vara, om du var ett telefonbolag, och du kunde klura ut vilka som är centrala i ett nätverk, och du kunde fråga dessa människor, " Skulle du kunna SMSa din feber varje dag? Bara messa din kroppstemperatur:" Och genom detta samla in stor mängd info folks kroppstemperatur men från centralt lokaliserade individer. Och därigenom ha möjligen att i stor skala, övervaka en annalkande epidemi men mycket begränsat indata från folk. Eller slutligen, kan det var fullt aktivt -- som jag vet att påföljande talare idag också kommer att prata om -- där folk kanske globalt deltar i wikis, i fotografering, eller följa röstande, eller ladda upp information på så sätt att det tillåter oss att förena information så det går att förstå sociala processer och sociala fenomen.
In fact, the availability of these data, I think, heralds a kind of new era of what I and others would like to call "computational social science." It's sort of like when Galileo invented -- or, didn't invent -- came to use a telescope and could see the heavens in a new way, or Leeuwenhoek became aware of the microscope -- or actually invented -- and could see biology in a new way. But now we have access to these kinds of data that allow us to understand social processes and social phenomena in an entirely new way that was never before possible. And with this science, we can understand how exactly the whole comes to be greater than the sum of its parts. And actually, we can use these insights to improve society and improve human well-being.
Faktum är, tillgången på dessa data, tror jag, frammanar en ny typ av era av vad jag skulle vilja kalla "beräkningssocialvetenskap" Det är ungefär som när Galileo uppfann -- eller, inte uppfann-- började använda teleskop och helt plötsligt kunde vi se himmelen på ett nytt sätt, eller när Leeuwenhoek upptäckte mikroskopet -- eller verkligen uppfann det -- och vi kunde se biologin på ett nytt sätt. Men nu har vi tillgång till dessa olika typer av data som tillåter oss förstå sociala processer och sociala fenomen på ett helt annat sätt än vad som tidigare var möjligt, Och med denna vetenskap kan vi förstår exakt hur helheten blir större än summan av dess delar. Och vi kan faktiskt använda dessa insikter för att förbättra samhället och förbättra välmåendet hos människor.
Thank you.
Tack så mycket.