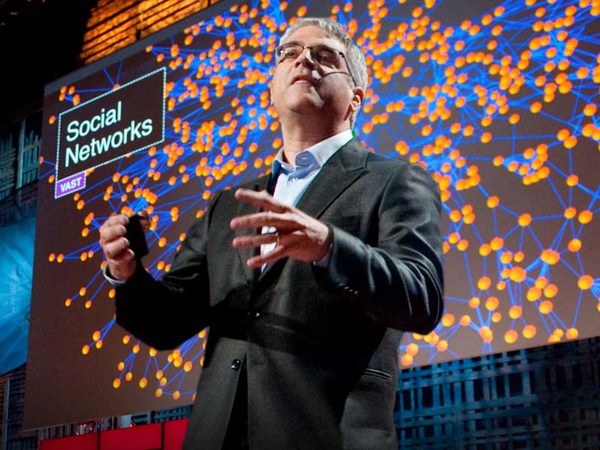
For the last 10 years, I've been spending my time trying to figure out how and why human beings assemble themselves into social networks. And the kind of social network I'm talking about is not the recent online variety, but rather, the kind of social networks that human beings have been assembling for hundreds of thousands of years, ever since we emerged from the African savannah. So, I form friendships and co-worker and sibling and relative relationships with other people who in turn have similar relationships with other people. And this spreads on out endlessly into a distance. And you get a network that looks like this. Every dot is a person. Every line between them is a relationship between two people -- different kinds of relationships. And you can get this kind of vast fabric of humanity, in which we're all embedded.
Tijdens de afgelopen tien jaar heb ik geprobeerd uit te zoeken hoe en waarom mensen zich in sociale netwerken verenigen. Het soort sociaal netwerk waar ik het over heb, is niet de nieuwe online-variant, maar het soort sociaal netwerk waarin mensen zich al honderdduizenden jaren verzamelen, vanaf de tijd dat we op de Afrikaanse savanne verschenen. Ik heb vriendschaps- en familiebanden met mensen, ik heb collega's. Deze mensen hebben op hun beurt gelijkaardige banden met andere mensen. Dit spreidt zich eindeloos uit. Je krijgt een netwerk als dit. Elke stip is een mens. Elke lijn daartussen is een band tussen twee mensen - verschillende soorten banden. Er ontstaat een uitgestrekt weefsel van mensen, waar we allemaal in verankerd zitten.
And my colleague, James Fowler and I have been studying for quite sometime what are the mathematical, social, biological and psychological rules that govern how these networks are assembled and what are the similar rules that govern how they operate, how they affect our lives. But recently, we've been wondering whether it might be possible to take advantage of this insight, to actually find ways to improve the world, to do something better, to actually fix things, not just understand things. So one of the first things we thought we would tackle would be how we go about predicting epidemics.
Mijn collega James Fowler en ik zijn al een hele tijd aan het onderzoeken wat de wiskundige, sociale, biologische en psychologische regels zijn die bepalen hoe deze netwerken samengesteld zijn en wat de regels zijn die bepalen hoe ze werken, hoe ze onze levens beïnvloeden. De laatste tijd hebben we ons afgevraagd of het misschien mogelijk is dit inzicht in ons voordeel te gebruiken, om manieren te vinden om de wereld te verbeteren, om iets beters te doen, zaken op te lossen, niet slechts te begrijpen. Eén van de eerste dingen die we wilden aanpakken, was kijken hoe we epidemieën konden voorspellen.
And the current state of the art in predicting an epidemic -- if you're the CDC or some other national body -- is to sit in the middle where you are and collect data from physicians and laboratories in the field that report the prevalence or the incidence of certain conditions. So, so and so patients have been diagnosed with something, or other patients have been diagnosed, and all these data are fed into a central repository, with some delay. And if everything goes smoothly, one to two weeks from now you'll know where the epidemic was today. And actually, about a year or so ago, there was this promulgation of the idea of Google Flu Trends, with respect to the flu, where by looking at people's searching behavior today, we could know where the flu -- what the status of the epidemic was today, what's the prevalence of the epidemic today.
Als op dit moment de overheid een epidemie wil voorspellen, gaat men het veld in en verzamelt gegevens bij artsen en laboratoria die de verspreidingsgraad rapporteren. Patiënten zus en zo hebben hier de diagnose gekregen, andere patiënten daar ook, en al deze gegevens komen met wat vertraging in een informatiecentrum terecht. Als alles soepel verloopt, weet men over één of twee weken waar de epidemie vandaag was. Ongeveer een jaar geleden kwam het idee van Google Grieptrends in de wereld: door te kijken waar mensen het woord griep googelen, kwamen we erachter wat de status van de griepepidemie vandaag is, wat vandaag de verspreiding is.
But what I'd like to show you today is a means by which we might get not just rapid warning about an epidemic, but also actually early detection of an epidemic. And, in fact, this idea can be used not just to predict epidemics of germs, but also to predict epidemics of all sorts of kinds. For example, anything that spreads by a form of social contagion could be understood in this way, from abstract ideas on the left like patriotism, or altruism, or religion to practices like dieting behavior, or book purchasing, or drinking, or bicycle-helmet [and] other safety practices, or products that people might buy, purchases of electronic goods, anything in which there's kind of an interpersonal spread. A kind of a diffusion of innovation could be understood and predicted by the mechanism I'm going to show you now.
Wat ik vandaag graag laat zien, is een manier waarmee we niet alleen een snelle waarschuwing krijgen voor een epidemie, maar waarmee we een epidemie zelfs in een vroeg stadium kunnen ontdekken. Deze vinding kan niet alleen gebruikt worden om de verspreiding van ziekten te voorspellen maar ook de verspreiding van allerlei andere zaken. Alles bijvoorbeeld dat zich verspreid door een vorm van sociale besmetting kunnen we hiermee begrijpen, van abstracte ideeën aan de ene kant, zoals vaderlandsliefde, onbaatzuchtigheid of een geloof tot gebruiken zoals eetgedrag, het kopen van boeken, drinken, het dragen van een fietshelm en het nemen van andere veiligheidsmaatregelen, de spullen die men koopt, het kopen van elektronische goederen, werkelijk alles waarmee mensen elkaar beïnvloeden. De verspreiding van nieuwe dingen kan worden begrepen en voorspeld met het mechanisme dat ik ga laten zien.
So, as all of you probably know, the classic way of thinking about this is the diffusion-of-innovation, or the adoption curve. So here on the Y-axis, we have the percent of the people affected, and on the X-axis, we have time. And at the very beginning, not too many people are affected, and you get this classic sigmoidal, or S-shaped, curve. And the reason for this shape is that at the very beginning, let's say one or two people are infected, or affected by the thing and then they affect, or infect, two people, who in turn affect four, eight, 16 and so forth, and you get the epidemic growth phase of the curve. And eventually, you saturate the population. There are fewer and fewer people who are still available that you might infect, and then you get the plateau of the curve, and you get this classic sigmoidal curve. And this holds for germs, ideas, product adoption, behaviors, and the like. But things don't just diffuse in human populations at random. They actually diffuse through networks. Because, as I said, we live our lives in networks, and these networks have a particular kind of a structure.
Zoals jullie waarschijnlijk allemaal weten, denkt men hier meestal over in termen van de verspreidingscurve. Hier op de Y-as staat het percentage beïnvloede mensen en op de X-as staat de tijd. Eerst worden er maar weinig mensen beïnvloed, en er ontstaat de bekende sigmoïdale, of S-vormige boog. Dit ontstaat doordat in het begin bijvoorbeeld één of twee mensen erdoor beïnvloed of geïnfecteerd zijn. Dan beïnvloeden of infecteren zij twee mensen, die dan vier, acht, 16 mensen beïnvloeden, enzovoort. Hierdoor ontstaat de epidemische groeifase. Later raakt de populatie verzadigd. Er zijn steeds minder mensen die nog beïnvloed kunnen worden Dan ontstaat het vlakke deel van de boog, en daarmee de klassieke sigmoïdaal. Dit geldt voor ziekten, ideeën producten, gedrag, enzovoort. Maar de verspreiding door de populatie is niet willekeurig. Deze verloopt door netwerken. Want, zoals ik zei, we leven in netwerken en deze netwerken hebben een bepaalde structuur.
Now if you look at a network like this -- this is 105 people. And the lines represent -- the dots are the people, and the lines represent friendship relationships. You might see that people occupy different locations within the network. And there are different kinds of relationships between the people. You could have friendship relationships, sibling relationships, spousal relationships, co-worker relationships, neighbor relationships and the like. And different sorts of things spread across different sorts of ties. For instance, sexually transmitted diseases will spread across sexual ties. Or, for instance, people's smoking behavior might be influenced by their friends. Or their altruistic or their charitable giving behavior might be influenced by their coworkers, or by their neighbors. But not all positions in the network are the same.
Als je nu naar zo'n netwerk kijkt... Dit zijn 105 mensen. De stippen zijn mensen en de lijnen zijn vriendschapsbanden. Je kan zien dat mensen verschillende plekken innemen in het netwerk. Er zijn verschillende soorten banden tussen mensen. Banden tussen vrienden, broers en zussen, echtgenoten, collega's, buren, en dergelijke. Verschillende zaken verspreiden zich langs verschillende soorten relaties. soa's bijvoorbeeld verspreiden zich langs seksuele relaties. Het rookgedrag van mensen kan bijvoorbeeld beïnvloed worden door vrienden. Of hun onbaatzuchtigheid of het geven van donaties kan worden beïnvloed door collega's of buren. Maar niet alle plekken in het netwerk zijn hetzelfde.
So if you look at this, you might immediately grasp that different people have different numbers of connections. Some people have one connection, some have two, some have six, some have 10 connections. And this is called the "degree" of a node, or the number of connections that a node has. But in addition, there's something else. So, if you look at nodes A and B, they both have six connections. But if you can see this image [of the network] from a bird's eye view, you can appreciate that there's something very different about nodes A and B. So, let me ask you this -- I can cultivate this intuition by asking a question -- who would you rather be if a deadly germ was spreading through the network, A or B? (Audience: B.) Nicholas Christakis: B, it's obvious. B is located on the edge of the network. Now, who would you rather be if a juicy piece of gossip were spreading through the network? A. And you have an immediate appreciation that A is going to be more likely to get the thing that's spreading and to get it sooner by virtue of their structural location within the network. A, in fact, is more central, and this can be formalized mathematically. So, if we want to track something that was spreading through a network, what we ideally would like to do is to set up sensors on the central individuals within the network, including node A, monitor those people that are right there in the middle of the network, and somehow get an early detection of whatever it is that is spreading through the network.
Als je dit ziet, begrijp je waarschijnlijk meteen dat verschillende mensen verschillende aantallen verbindingen hebben. Sommige mensen hebben er één, sommigen hebben er twee, sommigen zes of 10. Dit noemt men de 'graad' van een knoop, of het aantal verbindingen dat een knoop heeft. Maar er komt nog meer bij. Als je naar knopen A en B kijkt, zie je dat ze beide zes verbindingen hebben. Maar als je er van bovenaf naar kijkt, zie je dat er een groot verschil is tussen knoop A en B. Laat ik je dit vragen - ik kan dit gevoel verduidelijken door een vraag te stellen: wie zou je liever zijn als er zich een dodelijke ziekte door het netwerk verspreidde, A of B? (Publiek: B.) Nicholas: B, dat is duidelijk. B ligt aan de rand van het netwerk. Wie zou je liever zijn als er een sappige roddel rondging? A. En je snapt meteen dat A een veel grotere kans heeft om datgene te krijgen dat rondgaat, om het sneller te krijgen door de positie binnen het netwerk. A ligt veel meer in het midden en dit kan wiskundig worden beschreven. Als we dus iets willen volgen dat zich door het netwerk verspreidt, zouden we het liefst de mensen in het midden van het netwerk in de gaten willen houden, zoals knoop A. Hou de mensen in het midden in de gaten en je kan vroeg doorhebben dat er zich iets door het netwerk verspreidt.
So if you saw them contract a germ or a piece of information, you would know that, soon enough, everybody was about to contract this germ or this piece of information. And this would be much better than monitoring six randomly chosen people, without reference to the structure of the population. And in fact, if you could do that, what you would see is something like this. On the left-hand panel, again, we have the S-shaped curve of adoption. In the dotted red line, we show what the adoption would be in the random people, and in the left-hand line, shifted to the left, we show what the adoption would be in the central individuals within the network. On the Y-axis is the cumulative instances of contagion, and on the X-axis is the time. And on the right-hand side, we show the same data, but here with daily incidence. And what we show here is -- like, here -- very few people are affected, more and more and more and up to here, and here's the peak of the epidemic. But shifted to the left is what's occurring in the central individuals. And this difference in time between the two is the early detection, the early warning we can get, about an impending epidemic in the human population.
Als je zou zien dat deze mensen een ziekte of bepaalde informatie krijgen, weet je dat vrij snel iedereen die ziekte of dat stuk informatie zou krijgen. Dit zou veel beter zijn dan zes willekeurige mensen in de gaten houden, zonder rekening te houden met de structuur van de groep. En in feite, als je dat kon doen, zou je zoiets zien. Aan de linkerkant is er weer de S-vormige verspreidingscurve. De rode gestippelde lijn laat zien wat de adoptiecurve is van willekeurige mensen. De linkerlijn, de lijn meer naar links, laat zien hoe de verspreidingscurve loopt bij de centrale individuen in het netwerk. Op de Y-as staat de totale besmettingsgraad en op de X-as de tijd. Aan de rechterkant staan dezelfde gegevens, maar hier met de incidentie van dag tot dag. Hier zie je dat er weinig mensen beïnvloed zijn, hier wordt het steeds meer, en hier is het hoogtepunt van de epidemie. Meer naar links staat wat er gebeurt met de mensen in het midden. Het verschil in tijd tussen deze twee is de vroege waarneming en waarschuwing die we krijgen over een dreigende epidemie in een groep mensen.
The problem, however, is that mapping human social networks is not always possible. It can be expensive, not feasible, unethical, or, frankly, just not possible to do such a thing. So, how can we figure out who the central people are in a network without actually mapping the network? What we came up with was an idea to exploit an old fact, or a known fact, about social networks, which goes like this: Do you know that your friends have more friends than you do? Your friends have more friends than you do, and this is known as the friendship paradox. Imagine a very popular person in the social network -- like a party host who has hundreds of friends -- and a misanthrope who has just one friend, and you pick someone at random from the population; they were much more likely to know the party host. And if they nominate the party host as their friend, that party host has a hundred friends, therefore, has more friends than they do. And this, in essence, is what's known as the friendship paradox. The friends of randomly chosen people have higher degree, and are more central than the random people themselves.
Echter, het probleem is dat de sociale netwerken van mensen niet altijd in kaart kunnen worden gebracht. Het kan duur zijn, erg lastig, onethisch, of ronduit onmogelijk om zoiets te doen. Hoe kunnen we erachter komen wie de centrale mensen in het netwerk zijn zonder het netwerk in kaart te brengen? We kwamen op het idee om een oud idee of een bekend feit over sociale netwerken te gebruiken. Dit is het: wist je dat je vrienden meer vrienden hebben dan jij? Je vrienden hebben meer vrienden dan jij. Dit staat bekend als de vriendschapsparadox. Stel je een heel populaire persoon voor in het netwerk, zoals iemand die een feest geeft voor honderden vrienden, en een mensenhater met maar één vriend en je neemt een willekeurige persoon uit de groep, dan is het waarschijnlijker dat die persoon de feestgever kent. Als iemand de feester aanwijst als zijn vriend is dat dus iemand met honderd vrienden en heeft hij dus meer vrienden dan die persoon. Dit is, in wezen, de vriendschapsparadox. De vrienden van willekeurige mensen hebben een hogere graad, zijn centraler, dan de willekeurige mensen zelf.
And you can get an intuitive appreciation for this if you imagine just the people at the perimeter of the network. If you pick this person, the only friend they have to nominate is this person, who, by construction, must have at least two and typically more friends. And that happens at every peripheral node. And in fact, it happens throughout the network as you move in, everyone you pick, when they nominate a random -- when a random person nominates a friend of theirs, you move closer to the center of the network. So, we thought we would exploit this idea in order to study whether we could predict phenomena within networks. Because now, with this idea we can take a random sample of people, have them nominate their friends, those friends would be more central, and we could do this without having to map the network.
Je kan dit gevoelsmatig doorzien als je je alleen de mensen aan de buitenrand van het netwerk voorstelt. Als je deze persoon kiest, kan die alleen deze persoon aanwijzen die dus minstens twee vrienden moet hebben en er misschien meer heeft. Dat gebeurt bij elke knoop aan de buitenrand. Dit gaat zo door als je meer naar binnen beweegt. Als je een willekeurig persoon kiest en zij nomineert een vriend van haar beweeg je verder naar het midden van het netwerk. We besloten dit idee te gebruiken om te bestuderen of we verschijnsels in netwerken konden voorspellen. Want nu, met dit idee, kunnen we willekeurige mensen nemen, hun vrienden laten voordragen die centraler zijn, en we zouden dit kunnen doen zonder het netwerk in kaart te brengen.
And we tested this idea with an outbreak of H1N1 flu at Harvard College in the fall and winter of 2009, just a few months ago. We took 1,300 randomly selected undergraduates, we had them nominate their friends, and we followed both the random students and their friends daily in time to see whether or not they had the flu epidemic. And we did this passively by looking at whether or not they'd gone to university health services. And also, we had them [actively] email us a couple of times a week. Exactly what we predicted happened. So the random group is in the red line. The epidemic in the friends group has shifted to the left, over here. And the difference in the two is 16 days. By monitoring the friends group, we could get 16 days advance warning of an impending epidemic in this human population.
We hebben deze gedachte beproefd bij een uitbraak van de H1N1-griep op Harvard in de herfst en winter van 2009, net een paar maand geleden. We namen 1300 willekeurige studenten die we hun vrienden lieten voordragen en we volgden zowel de studenten als hun vrienden elke dag om te zien of de griep bij ze rondging. We deden dit passief door te kijken of ze naar artsenpost van de universiteit waren geweest. We lieten ze ook actief een paar keer in de week naar ons mailen. Er gebeurde precies wat we voorspeld hadden. De willekeurige groep is de rode lijn. De epidemie in de groep vrienden is naar links verschoven, hier. Het verschil tussen de twee is 16 dagen. Door de groep vrienden te volgen, kregen we 16 dagen van tevoren een waarschuwing van een dreigende epidemie in deze groep mensen.
Now, in addition to that, if you were an analyst who was trying to study an epidemic or to predict the adoption of a product, for example, what you could do is you could pick a random sample of the population, also have them nominate their friends and follow the friends and follow both the randoms and the friends. Among the friends, the first evidence you saw of a blip above zero in adoption of the innovation, for example, would be evidence of an impending epidemic. Or you could see the first time the two curves diverged, as shown on the left. When did the randoms -- when did the friends take off and leave the randoms, and [when did] their curve start shifting? And that, as indicated by the white line, occurred 46 days before the peak of the epidemic. So this would be a technique whereby we could get more than a month-and-a-half warning about a flu epidemic in a particular population.
Daar komt nog bij dat als je een analist was die een epidemie wilde bestuderen of de ingebruikname van een product bijvoorbeeld, je een willekeurig monster uit de populatie zou kunnen nemen, vrienden kan laten voordragen, en de vrienden volgen, en beide groepen volgen. Wanneer er bij de vrienden een schommeling boven de nul is in het gebruik van een vernieuwing bijvoorbeeld, zou dat bewijs zijn van de komende verspreiding. Of je zou het eerste moment kunnen zien waarop de beide lijnen uit elkaar gaan, zoals te zien aan de linkerkant. Wanneer begonnen de vrienden te bewegen en lieten ze de willekeurige groep achter en wanneer begonnen ze te bewegen? En dat, zoals de witte lijn aangeeft, gebeurde 46 dagen voor het hoogtepunt van de epidemie. Dus dit kan een techniek zijn waarmee we een waarschuwing zouden kunnen krijgen over een griepepidemie, anderhalve maand van tevoren.
I should say that how far advanced a notice one might get about something depends on a host of factors. It could depend on the nature of the pathogen -- different pathogens, using this technique, you'd get different warning -- or other phenomena that are spreading, or frankly, on the structure of the human network. Now in our case, although it wasn't necessary, we could also actually map the network of the students.
Ik moet erbij zeggen dat hoe lang van tevoren je iets te zien krijgt afhangt van vele factoren. Het kan afhangen van het soort pathogeen. Bij verschillende ziekten krijg je met deze techniek verschillende waarschuwingen. Het verschilt ook bij andere verschijnsels en hangt af van de structuur van het netwerk. In ons geval konden we, hoewel dat niet nodig was, het netwerk van de studenten echt in kaart brengen.
So, this is a map of 714 students and their friendship ties. And in a minute now, I'm going to put this map into motion. We're going to take daily cuts through the network for 120 days. The red dots are going to be cases of the flu, and the yellow dots are going to be friends of the people with the flu. And the size of the dots is going to be proportional to how many of their friends have the flu. So bigger dots mean more of your friends have the flu. And if you look at this image -- here we are now in September the 13th -- you're going to see a few cases light up. You're going to see kind of blooming of the flu in the middle. Here we are on October the 19th. The slope of the epidemic curve is approaching now, in November. Bang, bang, bang, bang, bang -- you're going to see lots of blooming in the middle, and then you're going to see a sort of leveling off, fewer and fewer cases towards the end of December. And this type of a visualization can show that epidemics like this take root and affect central individuals first, before they affect others.
Dit is een kaart van 714 studenten en hun vriendschapsbanden. Ik ga deze kaart zo in beweging zetten. We gaan van 120 bekijken hoe het netwerk ervoor staat. De rode stippen zullen de gevallen zijn met griep en de gele de vrienden van mensen met de griep. De grootte van de stippen staat in verhouding tot het aantal vrienden dat de griep heeft. Hoe groter de stippen, hoe meer vrienden de griep hebben. Als je naar dit beeld kijkt, dit is 13 september, zie je een paar gevallen oplichten. Je zal de griep in het midden tot bloei zien komen. Dit is de negentiende oktober. De helling van de verspreidingscurve komt eraan, in november. Hup, hup, hup, hup, je ziet het in het midden oplichten en dan weer minder worden met minder en minder gevallen tegen het eind van december. Dit soort plaatjes laat zien dat zulke epidemieën eerst de mensen in het midden treffen voordat ze anderen treffen.
Now, as I've been suggesting, this method is not restricted to germs, but actually to anything that spreads in populations. Information spreads in populations, norms can spread in populations, behaviors can spread in populations. And by behaviors, I can mean things like criminal behavior, or voting behavior, or health care behavior, like smoking, or vaccination, or product adoption, or other kinds of behaviors that relate to interpersonal influence. If I'm likely to do something that affects others around me, this technique can get early warning or early detection about the adoption within the population. The key thing is that for it to work, there has to be interpersonal influence. It cannot be because of some broadcast mechanism affecting everyone uniformly.
Zoals ik al zei, is deze methode niet alleen geschikt voor ziekten maar voor alles dat zich door een populatie verspreidt. Informatie verspreidt zich door populaties. Normen kunnen zich door populaties verspreiden. Gedrag kan zich door populaties verspreiden. Met gedrag bedoel ik dingen als crimineel gedrag, stemgedrag, omgang met gezondheid zoals roken en vaccinering, of de acceptatie van producten, of andere soorten gedrag die te maken hebben met invloed van mensen op elkaar. Als ik iets doe dat anderen om mij heen beïnvloedt, kan deze techniek vroeg zichtbaar maken hoe het overgenomen wordt door anderen. Om dit te laten werken moet er invloed zijn van één persoon op een andere. Het werkt niet met een uitzending die iedereen evenveel beïnvloedt.
Now the same insights can also be exploited -- with respect to networks -- can also be exploited in other ways, for example, in the use of targeting specific people for interventions. So, for example, most of you are probably familiar with the notion of herd immunity. So, if we have a population of a thousand people, and we want to make the population immune to a pathogen, we don't have to immunize every single person. If we immunize 960 of them, it's as if we had immunized a hundred [percent] of them. Because even if one or two of the non-immune people gets infected, there's no one for them to infect. They are surrounded by immunized people. So 96 percent is as good as 100 percent. Well, some other scientists have estimated what would happen if you took a 30 percent random sample of these 1000 people, 300 people and immunized them. Would you get any population-level immunity? And the answer is no. But if you took this 30 percent, these 300 people and had them nominate their friends and took the same number of vaccine doses and vaccinated the friends of the 300 -- the 300 friends -- you can get the same level of herd immunity as if you had vaccinated 96 percent of the population at a much greater efficiency, with a strict budget constraint.
Deze inzichten over netwerken kunnen bijvoorbeeld ook worden gebruikt om bepaalde mensen te bereiken om in te grijpen. De meesten van jullie kennen waarschijnlijk het begrip kudde-immuniteit. Als we een populatie hebben van duizend mensen en we willen de populatie immuun maken voor een pathogeen, hoeven we niet iedereen te vaccineren. Als we er 960 vaccineren is dat net zo goed als wanneer we iedereen vaccineerden. Want zelfs als er één of twee mensen besmet worden, kunnen zij niemand infecteren. Ze worden omringd door mensen die immuun zijn. 96 procent is net zo goed als 100 procent. Er is een schatting gemaakt wat er zou gebeuren als je willekeurig 30 procent van deze mensen zou vaccineren, 300 mensen. Zou er een vorm van immuniteit op groepsniveau ontstaan? Dat is niet zo. Maar als je deze 30 procent, deze 300 mensen, hun vrienden liet voordragen en dezelfde hoeveelheid vaccins nam en de voorgedragen vrienden zou vaccineren, de 300 vrienden, zou je dezelfde mate van kudde-immuniteit krijgen als wanneer je 96 procent van de groep vaccineerde, alleen veel doeltreffender, voor veel minder geld.
And similar ideas can be used, for instance, to target distribution of things like bed nets in the developing world. If we could understand the structure of networks in villages, we could target to whom to give the interventions to foster these kinds of spreads. Or, frankly, for advertising with all kinds of products. If we could understand how to target, it could affect the efficiency of what we're trying to achieve. And in fact, we can use data from all kinds of sources nowadays [to do this].
Soortgelijke ideeën kunnen bijvoorbeeld worden gebruikt om de verdeling van zaken als klamboes te regelen in ontwikkelingslanden. Als we de opbouw van netwerken in dorpen konden begrijpen, konden we bepalen wie spullen moet krijgen om dit soort zaken te verspreiden. Of gewoon om reclame te maken. Als we begrijpen wie we moeten hebben, kan dat de efficiëntie beïnvloeden van wat we proberen te bereiken. Tegenwoordig kunnen we gegevens gebruiken uit allerlei bronnen om dit te doen.
This is a map of eight million phone users in a European country. Every dot is a person, and every line represents a volume of calls between the people. And we can use such data, that's being passively obtained, to map these whole countries and understand who is located where within the network. Without actually having to query them at all, we can get this kind of a structural insight. And other sources of information, as you're no doubt aware are available about such features, from email interactions, online interactions, online social networks and so forth. And in fact, we are in the era of what I would call "massive-passive" data collection efforts. They're all kinds of ways we can use massively collected data to create sensor networks to follow the population, understand what's happening in the population, and intervene in the population for the better. Because these new technologies tell us not just who is talking to whom, but where everyone is, and what they're thinking based on what they're uploading on the Internet, and what they're buying based on their purchases. And all this administrative data can be pulled together and processed to understand human behavior in a way we never could before.
Dit is een kaart van acht miljoen telefoongebruikers in een Europees land. Elke stip is een mens en elke lijn stelt de hoeveelheid belverkeer tussen mensen voor. We kunnen zulke passief verkregen gegevens gebruiken om hele landen in kaart te brengen en te begrijpen wie waar in het netwerk zit. We kunnen zulke structurele inzichten verkrijgen helemaal zonder vragen te hoeven stellen. Je weet dat andere bronnen van informatie hierover beschikbaar zijn van e-mailverkeer, internet, sociale media, enzovoort. We bevinden ons in het tijdperk van wat ik 'massaal-passieve' gegevensverzameling zou noemen. Er zijn allerlei manieren waarop we deze gegevens kunnen gebruiken om netwerken te maken waarmee we de bevolking kunnen volgen en begrijpen wat er onder de bevolking gebeurt en kunnen ingrijpen om dingen te verbeteren. Omdat deze nieuwe technologieën ons niet alleen vertellen wie met wie spreekt maar waar iedereen is en wat ze denken afgaande op wat ze op het internet zetten en wat mensen kopen afgaande op online aankopen. Al deze gegevens kunnen samengevoegd worden en verwerkt worden om menselijk gedrag te begrijpen op een manier die nog nooit mogelijk was.
So, for example, we could use truckers' purchases of fuel. So the truckers are just going about their business, and they're buying fuel. And we see a blip up in the truckers' purchases of fuel, and we know that a recession is about to end. Or we can monitor the velocity with which people are moving with their phones on a highway, and the phone company can see, as the velocity is slowing down, that there's a traffic jam. And they can feed that information back to their subscribers, but only to their subscribers on the same highway located behind the traffic jam! Or we can monitor doctors prescribing behaviors, passively, and see how the diffusion of innovation with pharmaceuticals occurs within [networks of] doctors. Or again, we can monitor purchasing behavior in people and watch how these types of phenomena can diffuse within human populations.
Bijvoorbeeld de aankoop van brandstof door vrachtwagenchauffeurs. De chauffeurs werken gewoon en ze kopen brandstof. Als we een stijging in de aankoop van brandstof zien, weten we dat een recessie op zijn einde is. We kunnen de snelheid meten waarmee mensen over de snelweg rijden. De telefoonmaatschappij kan zien dat er een file is wanneer mensen afremmen. Ze kunnen die informatie aanbieden aan hun klanten, maar alleen aan de klanten op dezelfde snelweg die richting de file bewegen. Of we zouden kunnen kijken welke medicijnen artsen voorschrijven, passief, en zien hoe de verspreiding daarvan verloopt binnen netwerken van artsen. Of we kunnen kijken wat mensen kopen om te zien hoe zulk gedrag zich verspreidt tussen mensen.
And there are three ways, I think, that these massive-passive data can be used. One is fully passive, like I just described -- as in, for instance, the trucker example, where we don't actually intervene in the population in any way. One is quasi-active, like the flu example I gave, where we get some people to nominate their friends and then passively monitor their friends -- do they have the flu, or not? -- and then get warning. Or another example would be, if you're a phone company, you figure out who's central in the network and you ask those people, "Look, will you just text us your fever every day? Just text us your temperature." And collect vast amounts of information about people's temperature, but from centrally located individuals. And be able, on a large scale, to monitor an impending epidemic with very minimal input from people. Or, finally, it can be more fully active -- as I know subsequent speakers will also talk about today -- where people might globally participate in wikis, or photographing, or monitoring elections, and upload information in a way that allows us to pool information in order to understand social processes and social phenomena.
Ik denk dat er drie manieren zijn waarop deze massaal-passieve gegevens gebruikt kunnen worden. Eén is volledig passief, zoals ik zojuist beschreef in het voorbeeld van de vrachtwagenchauffeurs waar we mensen helemaal ongemoeid laten. Eén is half actief, zoals in het griepvoorbeeld, waar sommige mensen hun vrienden voordragen die dan passief gevolgd worden - Hebben ze de griep, of niet? - om een waarschuwing te krijgen. Een ander voorbeeld zou kunnen zijn dat een telefoonmaatschappij kijkt wie centraal is in het netwerk en die mensen vraagt elke dag hun koorts door te geven, alleen hun temperatuur. Verzamel een heleboel informatie over de temperatuur van mensen, maar dan wel van de centrale mensen. Zo kan je op grote schaal een epidemie zien aankomen terwijl je mensen heel weinig vraagt. Ten derde kan het actiever. Ik weet dat anderen het hier vandaag nog over zullen hebben. Mensen kunnen wereldwijd meedoen aan wiki's, of fotograferen, of verkiezingen controleren, en deze informatie uploaden op een manier dat we het kunnen samenbrengen om sociale processen en sociale verschijnsels te begrijpen.
In fact, the availability of these data, I think, heralds a kind of new era of what I and others would like to call "computational social science." It's sort of like when Galileo invented -- or, didn't invent -- came to use a telescope and could see the heavens in a new way, or Leeuwenhoek became aware of the microscope -- or actually invented -- and could see biology in a new way. But now we have access to these kinds of data that allow us to understand social processes and social phenomena in an entirely new way that was never before possible. And with this science, we can understand how exactly the whole comes to be greater than the sum of its parts. And actually, we can use these insights to improve society and improve human well-being.
De beschikbaarheid van deze gegevens luidt, denk ik, een nieuw tijdperk in die we graag 'computationele sociale wetenschappen' willen noemen. Het is een beetje zoals toen Galileo een telescoop ging gebruiken en de hemel op een nieuwe manier kon zien, of toen Van Leeuwenhoek de microscoop leerde kennen, of uitvond, en de biologie op een nieuwe manier zag. Maar nu hebben we toegang tot dit soort gegevens die het mogelijk maken sociale processen en verschijnselen te begrijpen op een heel nieuwe manier die nooit mogelijk was. Met deze wetenschap kunnen we begrijpen hoe het nu kan dat het geheel groter wordt dan de som der delen. We kunnen deze inzichten gebruiken om de maatschappij en menselijk welzijn te verbeteren.
Thank you.
Bedankt.