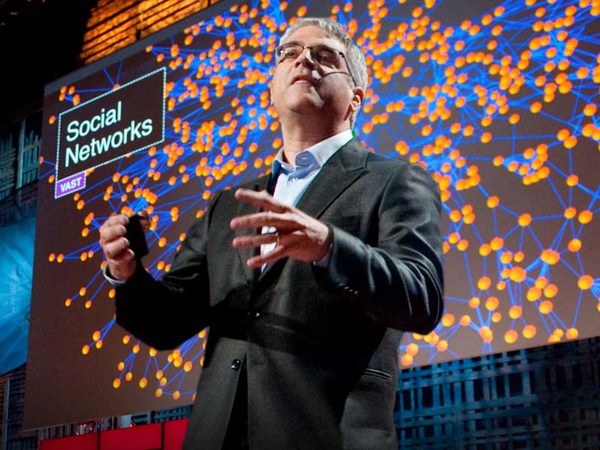
For the last 10 years, I've been spending my time trying to figure out how and why human beings assemble themselves into social networks. And the kind of social network I'm talking about is not the recent online variety, but rather, the kind of social networks that human beings have been assembling for hundreds of thousands of years, ever since we emerged from the African savannah. So, I form friendships and co-worker and sibling and relative relationships with other people who in turn have similar relationships with other people. And this spreads on out endlessly into a distance. And you get a network that looks like this. Every dot is a person. Every line between them is a relationship between two people -- different kinds of relationships. And you can get this kind of vast fabric of humanity, in which we're all embedded.
지난 10 년 동안 저는 인간이라는 존재가 어떻게 그리고 왜 서로 모여 사회적 네트워크를 형성하는지 이해하기 위해 연구했습니다. 제가 이야기하는 사회적 네트워크는 최근 등장한 온라인 상의 다양한 네트워크가 아니라 인류가 아프리카 사바나에 나타난 이래 수십 만 년에 걸쳐 서로 모이며 만들어 온 그런 사회적 네트워크입니다. 이를 통해 저는 다른 사람과 더불어 우정과 동료애를 쌓고 형제 관계 혹은 친척 관계를 형성할 뿐 아니라 그들 또한 또 다른 사람과 더불어 비슷한 관계를 이룹니다. 이렇게 이러한 관계는 끝도 없이 멀리 퍼져 있습니다. 여러분도 이와 같은 네트워크를 가지고 있으시겠죠. 모든 점은 사람을 나타냅니다. 점 사이에 놓인 선은 두 사람 사이의 관계를 나타내죠. 서로 다른 종류의 관계들입니다. 우리 모두는 이와 같이 방대한 인류의 관계도를 형성하고 그 어딘가에 놓여 있을 겁니다.
And my colleague, James Fowler and I have been studying for quite sometime what are the mathematical, social, biological and psychological rules that govern how these networks are assembled and what are the similar rules that govern how they operate, how they affect our lives. But recently, we've been wondering whether it might be possible to take advantage of this insight, to actually find ways to improve the world, to do something better, to actually fix things, not just understand things. So one of the first things we thought we would tackle would be how we go about predicting epidemics.
저의 동료 제임스 파울러와 저는 꽤 많은 시간을 들여 이들 네트워크가 만들어지는 방식을 결정하는 수학적, 사회적, 생물학적 그리고 심리학적 법칙은 어떤 것인지 그리고 이 네트워크가 작동하고 우리의 삶에 영향을 주는 방식을 결정하는 법칙은 어떤 것인지 연구했습니다. 그리고 최근에 저희는 이와 같은 연구를 통해 알게된 사실을 단지 현상을 이해만 하는 것이 아니라 세상을 발전시키거나, 보다 나은 일을 하거나, 아니면 실제로 문제를 해결하는데 이용할 수 있지 않을까 고민했습니다. 그러다 제일 먼저 생각하게 된 것이 바로 전염병을 어떻게 예측할 수 있을까 하는 문제였습니다.
And the current state of the art in predicting an epidemic -- if you're the CDC or some other national body -- is to sit in the middle where you are and collect data from physicians and laboratories in the field that report the prevalence or the incidence of certain conditions. So, so and so patients have been diagnosed with something, or other patients have been diagnosed, and all these data are fed into a central repository, with some delay. And if everything goes smoothly, one to two weeks from now you'll know where the epidemic was today. And actually, about a year or so ago, there was this promulgation of the idea of Google Flu Trends, with respect to the flu, where by looking at people's searching behavior today, we could know where the flu -- what the status of the epidemic was today, what's the prevalence of the epidemic today.
전염병을 예측하는 최근의 기술은 이렇습니다. 여러분께서 질병통제센터나 다른 어떤 국가기관에 계신다고 하면 여러분을 가운데 지점에 두고 특정 상태의 환자 발생빈도나 유병율을 보고하도록 되어 있는 분야의 의사나 실험실에서 온 자료를 모읍니다. 이런 이런 환자는 여기서 이런 진단을 받았고 다른 환자는 저기에서 진단을 받았고 이런 식의 모든 정보가 약간씩 늦기는 해도 중앙 상황실에 모입니다. 그리고 모든 게 별 탈 없이 지금부터 일, 이 주 정도 진행되면 오늘 어디에 전염병이 있었는지 알게 되는 것입니다. 실제로 대략 1년 쯤 전에 공개된 구글 독감 추이 정보의 아이디어는 독감에 관해 사람들이 현재 검색하는 방식을 지켜보면 어디에 독감이 퍼졌는지 현재 세계적으로 전염된 상태는 어떤지 현재 유병율은 어떤지 등을 알 수 있다는 것이었죠.
But what I'd like to show you today is a means by which we might get not just rapid warning about an epidemic, but also actually early detection of an epidemic. And, in fact, this idea can be used not just to predict epidemics of germs, but also to predict epidemics of all sorts of kinds. For example, anything that spreads by a form of social contagion could be understood in this way, from abstract ideas on the left like patriotism, or altruism, or religion to practices like dieting behavior, or book purchasing, or drinking, or bicycle-helmet [and] other safety practices, or products that people might buy, purchases of electronic goods, anything in which there's kind of an interpersonal spread. A kind of a diffusion of innovation could be understood and predicted by the mechanism I'm going to show you now.
하지만 오늘 여러분께 보여드리고자 하는 것은 우리가 단지 전염병에 대한 징후를 빨리 포착하게 될 뿐 아니라 실제로 전염병을 빨리 발견할 수도 있는 방법입니다. 실제로 이 아이디어는 단지 전염균을 예방하는 것 뿐만 아니라 모든 종류의 전염성이 있는 현상을 예측하는데 사용할 수 있습니다. 예를 들어 전염병과 비슷하게 퍼지는 모든 사회적인 현상은 이 방법으로 이해할 수 있습니다. 왼쪽에 있는 애국심, 이타주의, 종교 등의 추상적인 아이디어에서부터 음식섭취, 도서구매, 음주, 자전거용 헬멧이나 기타 안전용구의 활용, 사람들이 구입할 제품, 전자 제품 구입 등 사람과 사람 사이에 퍼질 수 있는 모든 실용적인 것까지 말이죠. 새로운 것이 퍼지는 것 같은 현상은 이제 여러분께 소개할 메커니즘으로 이해할 수 있고, 예측할 수 있습니다.
So, as all of you probably know, the classic way of thinking about this is the diffusion-of-innovation, or the adoption curve. So here on the Y-axis, we have the percent of the people affected, and on the X-axis, we have time. And at the very beginning, not too many people are affected, and you get this classic sigmoidal, or S-shaped, curve. And the reason for this shape is that at the very beginning, let's say one or two people are infected, or affected by the thing and then they affect, or infect, two people, who in turn affect four, eight, 16 and so forth, and you get the epidemic growth phase of the curve. And eventually, you saturate the population. There are fewer and fewer people who are still available that you might infect, and then you get the plateau of the curve, and you get this classic sigmoidal curve. And this holds for germs, ideas, product adoption, behaviors, and the like. But things don't just diffuse in human populations at random. They actually diffuse through networks. Because, as I said, we live our lives in networks, and these networks have a particular kind of a structure.
여러분 모두 아시는 것처럼 이런 것에 관한 고전적인 생각은 '혁신의 확산' 혹은 '수용 곡선'으로 불리는 것입니다. 여기 Y축은 영향을 받은 사람의 퍼센트를 나타내고 X축은 시간을 나타냅니다. 맨 처음에는 영향 받은 사람이 별로 많지 않죠. 그래서 고전적인 시그모이드 형태 혹은 S자 모양의 곡선이 됩니다. 이런 모양이 만들어진 이유는 맨 처음 한 사람 혹은 두 사람이 어떤 것에 영향을 받거나 감염되고 그들이 다시 두 명에 영향을 주거나 감염시키고 그럼 그들이 다시 4명, 8명, 16명에게 영향을 끼치고 이런 식으로 전염병의 성장단계 곡선부분이 만들어지죠. 궁극적으로 전체 집단에 골고루 퍼집니다. 그래서 감염시킬 사람이 점점 줄어들게 되고 곡선이 평탄해지면서 고전적인 S자형 곡선이 되는 것입니다. 이것은 세균, 아이디어, 제품의 구매, 행동과 같은 것 등에 모두 적용됩니다. 하지만 뭔가가 사람들 사이에서 무작위로 퍼지지는 않습니다. 이것들은 실제로 네트워크를 통해 퍼집니다. 왜냐하면 말씀드렸던 것처럼 우리는 네트워크 안에서 살고 이 네트워크들은 특정한 구조를 가지고 있기 때문입니다.
Now if you look at a network like this -- this is 105 people. And the lines represent -- the dots are the people, and the lines represent friendship relationships. You might see that people occupy different locations within the network. And there are different kinds of relationships between the people. You could have friendship relationships, sibling relationships, spousal relationships, co-worker relationships, neighbor relationships and the like. And different sorts of things spread across different sorts of ties. For instance, sexually transmitted diseases will spread across sexual ties. Or, for instance, people's smoking behavior might be influenced by their friends. Or their altruistic or their charitable giving behavior might be influenced by their coworkers, or by their neighbors. But not all positions in the network are the same.
만약 이와 같은 네트워크를 보신다면... 이것은 105명의 사람인데요 점들은 사람을 나타내고 연결선은 친구 관계를 나타냅니다. 사람들이 이 네트워크 안에서 각기 다른 위치를 차지하고 있다는 것을 아실 수 있을 겁니다. 사람들 사이에는 서로 다른 관계가 있습니다. 여러분들은 친구 관계, 형제 관계, 배우자 관계, 동료 관계, 이웃 관계 등을 형성할 수 있죠. 다른 종류의 것들은 다른 종류의 관계를 따라서 퍼집니다. 예를들어, 성관계에 의해 전염된 질병은 성적인 인간 관계를 따라 퍼집니다. 예를 들어, 사람들이 담배 피는 행동은 아마도 그들의 친구들에게서 영향을 받았을지 모릅니다. 이타적인 행동이나 기부하는 행위는 아마도 그들의 동료 혹은 이웃에게서 영향을 받은 것일 수 있구요. 하지만 이 네트워크에서 모든 위치가 같지는 않습니다.
So if you look at this, you might immediately grasp that different people have different numbers of connections. Some people have one connection, some have two, some have six, some have 10 connections. And this is called the "degree" of a node, or the number of connections that a node has. But in addition, there's something else. So, if you look at nodes A and B, they both have six connections. But if you can see this image [of the network] from a bird's eye view, you can appreciate that there's something very different about nodes A and B. So, let me ask you this -- I can cultivate this intuition by asking a question -- who would you rather be if a deadly germ was spreading through the network, A or B? (Audience: B.) Nicholas Christakis: B, it's obvious. B is located on the edge of the network. Now, who would you rather be if a juicy piece of gossip were spreading through the network? A. And you have an immediate appreciation that A is going to be more likely to get the thing that's spreading and to get it sooner by virtue of their structural location within the network. A, in fact, is more central, and this can be formalized mathematically. So, if we want to track something that was spreading through a network, what we ideally would like to do is to set up sensors on the central individuals within the network, including node A, monitor those people that are right there in the middle of the network, and somehow get an early detection of whatever it is that is spreading through the network.
그래서 이 네트워크를 보는 순간 여러분은 바로 사람마다 연결선의 수가 다르다는 것을 눈치채셨을 겁니다. 몇몇 사람들은 하나의 연결선을 가집니다. 몇몇은 2개, 6개, 10개의 연결선을 가집니다. 그리고 이것을 각 점의 "차수"라고 합니다. 각 점이 가지는 연결선의 수입니다. 게다가 그 밖의 무언가가 존재하는데요, 이렇게 점 A 와 B를 보면 둘은 같이 6개의 연결선을 가지고 있습니다. 하지만 넓은 시각으로 네트워크 그림을 본다면, 여러분은 점 A 와 B가 뭔가 매우 다르다는 것을 아실 수 있습니다. 이런 질문을 해 보죠. 방금 언급한 직감은 이 질문으로 한층 배가될텐데요 만약 치명적인 세균이 네트워크에 퍼지고 있다면 여러분은 A가 되고 싶으세요 아님 B가 되고 싶으세요? (관객: B) 니콜라스 크리스타키스:B, 분명하죠. B는 네트워크 가장 자리에 위치하고 있습니다. 이제 구미가 당기는 소문이 네트워크에 퍼지고 있다면 여러분은 A가 되고 싶으세요 아님 B가 되고 싶으세요? A죠. A가 지금 퍼지고 있는 소문을 듣던지 혹은 듣더라도 남보다 빨리 듣게 될 거라는 걸 네트워크 안에서의 구조적 위치 덕분에 여러분은 바로 알 수 있는 것입니다. A는 사실상 좀 더 중심적이라고 할 수 있는데 이걸 수학적으로 표현할 수도 있습니다. 이렇게 만약 네트워크를 통해 퍼지고 있는 무언가의 자취를 알고자 한다면, 이상적으로 우리는 A를 포함해 네트워크 안에서 중심적인 역할을 하는 개인에 센서를 부착하고 바로 저기 네트워크 가운데 있는 사람들을 추적해 네트워크를 타고 퍼지는 것은 무엇이건 조기에 발견하고 싶을 겁니다.
So if you saw them contract a germ or a piece of information, you would know that, soon enough, everybody was about to contract this germ or this piece of information. And this would be much better than monitoring six randomly chosen people, without reference to the structure of the population. And in fact, if you could do that, what you would see is something like this. On the left-hand panel, again, we have the S-shaped curve of adoption. In the dotted red line, we show what the adoption would be in the random people, and in the left-hand line, shifted to the left, we show what the adoption would be in the central individuals within the network. On the Y-axis is the cumulative instances of contagion, and on the X-axis is the time. And on the right-hand side, we show the same data, but here with daily incidence. And what we show here is -- like, here -- very few people are affected, more and more and more and up to here, and here's the peak of the epidemic. But shifted to the left is what's occurring in the central individuals. And this difference in time between the two is the early detection, the early warning we can get, about an impending epidemic in the human population.
만약 저들이 세균이나 정보와 접촉했다는 것을 안다면 여러분은 모든 사람들이 이제 곧 이 세균이나 정보에 노출될 것이라는 것을 충분히 이른 시간에 알 수 있습니다. 이것은 전체 인구의 구조를 고려하지 않고 무작위로 선택된 6명의 사람을 관찰하는 것보다 훨씬 나은 방법입니다. 실제로 그렇게 할 수 있다면 우리는 이와 비슷한 것을 보게 될 것입니다. 다시 한 번 왼쪽 패널에는 S자 모양의 수용 곡선이 있습니다. 빨간색 점선은 무작위로 고른 사람들이 얼마나 수용할 것인지를 나타내는 곡선이고 그 왼쪽으로 이동한 곡선은 네트워크에 중심적인 개인들이 수용하는 경향이 어떤지 보여주죠. Y축은 누적된 전염병의 발생건수이고 X축은 시간입니다. 오른쪽 부분도 같은 정보를 보여주는데 단지 여기에는 매일매일의 발생건수입니다. 여기서 우리가 보는 것은 -- 아주 적은 사람들이 감염됐다가 점점 많은 사람들이 이 지점까지 감염이 되고 바로 여기서 전염병은 최고조에 달하죠. 왼쪽으로 이동하면 중심적인 개인에게서 나타나는 현상입니다. 이 두 곡선 사이의 시간적인 차이가 바로 우리 인간 개체군에게 곧 일어날 전염병에 대해 우리가 얻을 수 있는 조기 발견 혹은 조기 신호가 되는 셈이죠.
The problem, however, is that mapping human social networks is not always possible. It can be expensive, not feasible, unethical, or, frankly, just not possible to do such a thing. So, how can we figure out who the central people are in a network without actually mapping the network? What we came up with was an idea to exploit an old fact, or a known fact, about social networks, which goes like this: Do you know that your friends have more friends than you do? Your friends have more friends than you do, and this is known as the friendship paradox. Imagine a very popular person in the social network -- like a party host who has hundreds of friends -- and a misanthrope who has just one friend, and you pick someone at random from the population; they were much more likely to know the party host. And if they nominate the party host as their friend, that party host has a hundred friends, therefore, has more friends than they do. And this, in essence, is what's known as the friendship paradox. The friends of randomly chosen people have higher degree, and are more central than the random people themselves.
하지만 문제는 사회적 네트워크를 파악하는 것이 늘 가능한 것이 아니라는 점입니다. 이 일은 비용이 많이 들고, 아주 어려우며 비윤리적일 수도 있고 단순히 그냥 불가능 합니다. 그럼 실제로 네트워크를 파악하지도 않고 누가 중심적인 인물인지 어떻게 알 수 있을까요? 우리가 생각해낸 것은 사회적 네트워크에 관해 오래 동안 알려진 혹은 그냥 알려진 사실을 이용하는 것인데 내용은 이런 겁니다: 여러분의 친구들이 여러분들보다 더 많은 친구를 가졌다는 걸 혹시 아세요? 여러분들의 친구가 여러분들보다 더 친구가 많습니다. 이것은 '우정의 역설'로 알려져 있습니다. 사회적 네트워크에서 아주 인기 있는 사람과 -- 예를 들어 100명의 친구를 가진 파티 주인과 같은 사람말이죠 -- 그리고 친구가 단 한 명인 외톨이를 생각해 보세요. 그리고 전체 인구에서 무작위로 누군가를 뽑았다고 상상해 보시죠. 이들은 파티 주인을 알고 있을 가능성이 아주 높습니다. 그들이 만약 파티 주인을 친구로 지목한다면 그 파티의 주인은 100명의 친구를 가진 셈이니 그들이 가진 친구보다 많은 친구를 가지게 됩니다. 이것이 '우정의 역설'의 핵심입니다. 무작위로 선택된 사람들의 친구는 그 사람들보다 높은 차수를 가지고 좀 더 네트워크의 중심적인 인물이 됩니다.
And you can get an intuitive appreciation for this if you imagine just the people at the perimeter of the network. If you pick this person, the only friend they have to nominate is this person, who, by construction, must have at least two and typically more friends. And that happens at every peripheral node. And in fact, it happens throughout the network as you move in, everyone you pick, when they nominate a random -- when a random person nominates a friend of theirs, you move closer to the center of the network. So, we thought we would exploit this idea in order to study whether we could predict phenomena within networks. Because now, with this idea we can take a random sample of people, have them nominate their friends, those friends would be more central, and we could do this without having to map the network.
네트워크 주변의 사람들을 상상해 보시면 이 사실에 대해 직감적으로 이해하실 수 있을 겁니다. 여러분이 이 사람을 뽑으면 지목할 친구는 이 사람 밖에 없는데 이 사람은 구성에 따라 적어도 두 명의 친구가 있는 것이고 보통은 더 많은 친구가 있을 겁니다. 모든 주변부의 점에서 이런 현상이 발생합니다. 실제로 여러분이 네트워크를 타고 돌아다니면서 누구를 선택하건 그들이 무작위로 친구를 지목하면 이 현상이 발생합니다. 무작위로 뽑힌 사람이 그들 중 한 친구를 지명하면 여러분은 좀 더 네트워크의 중앙으로 이동하는 겁니다. 그래서 네트워크에서 발생하는 현상을 예측할 수 있을지 연구할 때 우리는 이 아이디어를 이용해야겠다고 생각했습니다. 왜냐하면 지금 이 아이디어에 따라 우리가 무작위로 사람을 선택하고 그들이 친구를 지명하도록 하면 그 친구들은 좀 더 중심적인 위치를 차지하고 우리는 네트워크를 파악할 필요없이 이 연구를 할 수 있습니다.
And we tested this idea with an outbreak of H1N1 flu at Harvard College in the fall and winter of 2009, just a few months ago. We took 1,300 randomly selected undergraduates, we had them nominate their friends, and we followed both the random students and their friends daily in time to see whether or not they had the flu epidemic. And we did this passively by looking at whether or not they'd gone to university health services. And also, we had them [actively] email us a couple of times a week. Exactly what we predicted happened. So the random group is in the red line. The epidemic in the friends group has shifted to the left, over here. And the difference in the two is 16 days. By monitoring the friends group, we could get 16 days advance warning of an impending epidemic in this human population.
우리는 이 아이디어를 겨우 몇 달 전 2009년 가을에서 겨울 사이 하버드 대에서 발생한 H1N1 독감에 적용해 보았습니다. 1,300 명의 대학생을 무작위로 선택 그들에게 친구를 지명하도록 한 다음 무작위로 선택된 학생과 그들의 친구를 전염성 독감을 가졌는지 아닌지 확인하기 위해 매일 관찰했습니다. 그들이 대학 건강 서비스 센터에 갔는지를 관찰하는 간접적인 방식을 택했죠. 한편으로 그들이 우리에게 한 주에 2번씩 이메일을 보내도록 했죠. 정확히 우리가 예상했던 일이 발생했습니다. 빨간색 선이 무작위 그룹입니다. 친구 그룹에서 발생한 전염병은 이곳 왼쪽으로 이동했습니다. 그리고 두 그룹의 차이는 16일이었죠. 친구 그룹을 관찰함으로써 우리는 전체 인구에 곧 퍼질 전염병을 16일이나 앞서 눈치챌 수 있었던 것입니다.
Now, in addition to that, if you were an analyst who was trying to study an epidemic or to predict the adoption of a product, for example, what you could do is you could pick a random sample of the population, also have them nominate their friends and follow the friends and follow both the randoms and the friends. Among the friends, the first evidence you saw of a blip above zero in adoption of the innovation, for example, would be evidence of an impending epidemic. Or you could see the first time the two curves diverged, as shown on the left. When did the randoms -- when did the friends take off and leave the randoms, and [when did] their curve start shifting? And that, as indicated by the white line, occurred 46 days before the peak of the epidemic. So this would be a technique whereby we could get more than a month-and-a-half warning about a flu epidemic in a particular population.
여기에 덧붙여 만약 여러분이 전염병을 연구하거나 혹은 예를 들어 제품의 판매경향을 예측하는 분석가시라면 여러분은 전체 인구에서 무작위로 대상을 선정 그들이 친구를 지명하도록 하고 그 친구를 따라 무작위로 뽑힌 사람과 그가 지명한 친구를 함께 관찰합니다. 친구들 사이에서 예를 들어 새로운 것를 선택하는 경향이 0보다 높게 뛰면 이게 바로 곧 전체 인구로 퍼질 것이라는 증거가 됩니다. 혹은 왼쪽에 나타난 것처럼 두 곡선이 갈라지기 시작하는 첫 번째 시간에 주목할 수도 있겠죠. 선택된 친구는 언제 떨어져 나가 무작위로 뽑힌 사람과 차이를 나타낼까요 그리고 언제 그들의 커브가 이동할까요? 그것도 하얀색 선이 나타낸 것처럼 전염병이 최고조에 달하기 46일 전이었습니다. 그러니까 이 방법은 특정 집단에 퍼질 전염성 독감을 한 달 반이나 앞서서 눈치챌 수 있는 한 가지 기법인 것입니다.
I should say that how far advanced a notice one might get about something depends on a host of factors. It could depend on the nature of the pathogen -- different pathogens, using this technique, you'd get different warning -- or other phenomena that are spreading, or frankly, on the structure of the human network. Now in our case, although it wasn't necessary, we could also actually map the network of the students.
제각 꼭 말씀드리고 싶은 것은 어떤 사항에 대해 얼마나 앞서 알아챌 수 있느냐 하는 것이 여러 가지 요인에 달려 있다는 점입니다. 이것은 병원균의 특징에도 달려 있어서 서로 다른 병원균들은 이 기술을 사용해도 다른 신호를 포착하게 될 겁니다 -- 혹은 퍼지고 있는 현상 자체에도 달려 있고 솔직히 인간 네트워크의 구조에도 달려 있습니다. 우리의 경우 필요하지는 않았지만 우리는 또한 실제로 학생들 사이의 네트워크를 파악할 수 있었습니다.
So, this is a map of 714 students and their friendship ties. And in a minute now, I'm going to put this map into motion. We're going to take daily cuts through the network for 120 days. The red dots are going to be cases of the flu, and the yellow dots are going to be friends of the people with the flu. And the size of the dots is going to be proportional to how many of their friends have the flu. So bigger dots mean more of your friends have the flu. And if you look at this image -- here we are now in September the 13th -- you're going to see a few cases light up. You're going to see kind of blooming of the flu in the middle. Here we are on October the 19th. The slope of the epidemic curve is approaching now, in November. Bang, bang, bang, bang, bang -- you're going to see lots of blooming in the middle, and then you're going to see a sort of leveling off, fewer and fewer cases towards the end of December. And this type of a visualization can show that epidemics like this take root and affect central individuals first, before they affect others.
이것은 714 명의 학생과 그들의 친구 관계를 나타낸 것입니다. 그리고 1분 안에 이 지도는 움직일 겁니다. 매일매일의 네트워크 상태를 120일에 걸쳐 보여드리겠습니다. 빨간 점은 독감에 걸린 사람이고 노란 점은 독감에 걸린 사람의 친구들입니다. 점의 크기는 얼마나 많은 친구가 독감에 걸렸는지를 나타냅니다. 그래서 큰 점은 더 많은 친구들이 독감에 걸렸음을 나타냅니다. 이 그림을 보시면 -- 이건 9월 13일인데요 -- 여러분은 몇몇 사례가 나타난 것을 알 수 있습니다. 가운데 부분에서 독감이 증가하는 것을 보시게 됩니다. 이건 10월 19일입니다. 11월에는 전염병 곡선에 접근하고 있습니다. 빵, 빵, 빵, 빵, 빵, 여러분은 가운데 부분에서 많은 감염자가 생겼음을 아시게 됩니다. 그리고 12월 말에 가까워 지면서 점차 감염자 수가 줄어 곡선이 편평한 상태가 되는 것을 보시게 됩니다. 그리고 이렇게 보여줌으로써 이와 같은 전염병이 다른 사람들에게 영향을 미치기에 앞서 중심부의 개인을 먼저 감염시켜 이들로부터 퍼져 나갔음을 알 수 있습니다.
Now, as I've been suggesting, this method is not restricted to germs, but actually to anything that spreads in populations. Information spreads in populations, norms can spread in populations, behaviors can spread in populations. And by behaviors, I can mean things like criminal behavior, or voting behavior, or health care behavior, like smoking, or vaccination, or product adoption, or other kinds of behaviors that relate to interpersonal influence. If I'm likely to do something that affects others around me, this technique can get early warning or early detection about the adoption within the population. The key thing is that for it to work, there has to be interpersonal influence. It cannot be because of some broadcast mechanism affecting everyone uniformly.
제가 이제껏 언급한 것처럼 이 방법이 세균에만 국한되지 않고 실제로 집단에서 퍼져 나가는 모든 것에 해당됩니다. 정보는 집단에 퍼집니다. 규범 역시 집단에 퍼집니다. 행동방식도 집단에 퍼질 수 있습니다. 여기서 행동방식이라 하면 범죄 행위, 투표 행위 혹은 흡연, 예방접종 등과 같은 건강을 보호하기 위한 행동, 제품구매 행위, 혹은 사람과 사람 사이에 서로 주고 받는 영향에 관계되는 모든 행위가 해당됩니다. 제 주변의 다른 이들에게 영향을 주는 어떤 행동을 할 가능성이 있다면 이 기법을 통해 전체 집단이 그것을 얼마나 빨리 받아들일지 눈치채거나 미리 알 수 있습니다. 이 기법이 제대로 작동하는데는 상호간의 영향력이 존재한다는 것이 핵심입니다. 모든 이에게 골고루 영향을 미치는 방송과 같은 방식은 이렇게 되지 않습니다.
Now the same insights can also be exploited -- with respect to networks -- can also be exploited in other ways, for example, in the use of targeting specific people for interventions. So, for example, most of you are probably familiar with the notion of herd immunity. So, if we have a population of a thousand people, and we want to make the population immune to a pathogen, we don't have to immunize every single person. If we immunize 960 of them, it's as if we had immunized a hundred [percent] of them. Because even if one or two of the non-immune people gets infected, there's no one for them to infect. They are surrounded by immunized people. So 96 percent is as good as 100 percent. Well, some other scientists have estimated what would happen if you took a 30 percent random sample of these 1000 people, 300 people and immunized them. Would you get any population-level immunity? And the answer is no. But if you took this 30 percent, these 300 people and had them nominate their friends and took the same number of vaccine doses and vaccinated the friends of the 300 -- the 300 friends -- you can get the same level of herd immunity as if you had vaccinated 96 percent of the population at a much greater efficiency, with a strict budget constraint.
네트워크에 관련된 동일한 직관력은 또한 다른 방식으로 써먹을 수 있습니다. 예를 들어 특별한 사람들을 선정해 영향을 미치는 것 등이 되겠군요. 예를 들어 여러분 대부분은 집단 면역이라는 얘기를 들으신 적이 있을 겁니다. 그러니까 천 명이 되는 어떤 집단을 어떤 병원균에 대해 면역이 되게 하려면 우리는 모든 개개인을 면역시킬 필요가 없습니다. 그들 가운데 960명의 사람들만 면역시키면 이것은 우리가 100%를 면역시킨 것과 같게 됩니다. 왜냐하면 비록 면역되지 않은 한 두 사람이 감염되어도 그들이 감염시킬 사람이 남아 있지 않기 때문이죠. 그들은 면역된 사람들로 둘러싸여 있습니다. 그러니까 96%는 100%나 마찬가지 입니다. 음, 몇몇 다른 과학자들은 1,000명 가운데 무작위로 30%를 선정, 그 300명을 면역시키면 앞으로 무슨 일이 벌어질까를 예측해 봤습니다. 전체 집단이 면역된 것처럼 될까요? 결과는 아니었습니다. 하지만 만약 이 30%, 300명의 사람에게 친구를 지명하게 하고 같은 양의 백신으로 300명이 지목한 300명의 친구들에게 예방접종을 한다면, 여러분은 전체 집단의 96%를 면역시킨 것과 같은 수준의 집단 면역 효과를 거둘 수 있습니다. 훨씬 효율성은 큰 반면에 적은 예산이 들죠.
And similar ideas can be used, for instance, to target distribution of things like bed nets in the developing world. If we could understand the structure of networks in villages, we could target to whom to give the interventions to foster these kinds of spreads. Or, frankly, for advertising with all kinds of products. If we could understand how to target, it could affect the efficiency of what we're trying to achieve. And in fact, we can use data from all kinds of sources nowadays [to do this].
그리고 비슷한 아이디어는 예를 들어 개발 도상국에 침대 모기장과 같은 것을 공급할 대상을 선정하는 등의 일에도 적용할 수 있습니다. 만약 우리가 마을 내의 네트워크 구조를 이해할 수 있다면 누구를 선정하면 작업의 효과가 잘 퍼지게 될 것인지 알 수 있게 되는 것입니다. 솔직히 모든 종류의 제품을 광고할 대상을 찾을 때도 쓸 수 있겠죠. 어떤 사람을 대상으로 할 것인지 이해할 수 있다면 우리가 하고자 하는 일의 효율은 달라질 것입니다. 실제로 오늘날 우리는 무궁무진한 방식으로 데이터를 이용할 수 있습니다.
This is a map of eight million phone users in a European country. Every dot is a person, and every line represents a volume of calls between the people. And we can use such data, that's being passively obtained, to map these whole countries and understand who is located where within the network. Without actually having to query them at all, we can get this kind of a structural insight. And other sources of information, as you're no doubt aware are available about such features, from email interactions, online interactions, online social networks and so forth. And in fact, we are in the era of what I would call "massive-passive" data collection efforts. They're all kinds of ways we can use massively collected data to create sensor networks to follow the population, understand what's happening in the population, and intervene in the population for the better. Because these new technologies tell us not just who is talking to whom, but where everyone is, and what they're thinking based on what they're uploading on the Internet, and what they're buying based on their purchases. And all this administrative data can be pulled together and processed to understand human behavior in a way we never could before.
이것은 유럽 국가에 있는 8 백만 명의 휴대전화 사용자를 나타낸 것입니다. 모든 점은 사람이고 모든 선은 그들 사이의 통화량을 나타냅니다. 이렇게 간접적으로 수집된 정보라 할지라도 이를 이용하면 전체 국가를 파악하고 네트워크 안에서 누가 어디에 있는지 이해할 수 있습니다. 실제로 그들에게 전혀 질문하지 않고도 우리는 이와 같이 직관적으로 구조를 파악하게 됩니다. 이렇게 활용할 수 있는 정보 가운데는 누구나 아는 것도 있습니다. 이메일을 주고 받는 정보라던지 온라인 상에서 이뤄지는 접촉, 온라인 사회적 네트워크 등이 되겠죠. 실제로 우리는 제가 "대규모 간접" 정보수집 활동의 시대라 부르는 시대에 들어서 있습니다. 여기에는 대규모로 수집된 정보를 활용해 센서 네트워크를 만들고 전체 집단을 추적 그 안에서 무슨 일이 발생하는지 이해하고 더 나은 환경을 조성하기 위해 사용하는 여러 가지 수단까지 모두를 망라합니다. 왜냐하면 이런 새로운 기술을 통해 우리는 단지 누가 누구에게 이야기 하는지 뿐 아니라 다들 어디에 있고 그들이 인터넷에 업로드 한 것을 바탕으로 무슨 생각을 하는지 그들이 이미 구매한 품목을 바탕으로 무엇을 살 것인지 알 수 있기 때문입니다. 그리고 이렇게 행정적으로 모은 정보를 한데 가져다가 우리가 이전에는 할 수 없던 방법으로 분석해 인간의 행동을 이해할 수 있습니다.
So, for example, we could use truckers' purchases of fuel. So the truckers are just going about their business, and they're buying fuel. And we see a blip up in the truckers' purchases of fuel, and we know that a recession is about to end. Or we can monitor the velocity with which people are moving with their phones on a highway, and the phone company can see, as the velocity is slowing down, that there's a traffic jam. And they can feed that information back to their subscribers, but only to their subscribers on the same highway located behind the traffic jam! Or we can monitor doctors prescribing behaviors, passively, and see how the diffusion of innovation with pharmaceuticals occurs within [networks of] doctors. Or again, we can monitor purchasing behavior in people and watch how these types of phenomena can diffuse within human populations.
예를 들어 우리는 트럭 운전사가 연료를 구입한 기록을 활용할 수 있습니다. 트럭 운전사들은 단지 그들의 일을 하며 연료를 구입합니다. 트럭 운전사들이 연료를 구입한 양이 갑자기 증가했다면 경기침체가 끝나간다는 것을 알게 됩니다. 혹은 사람들이 가지고 다니는 핸드폰을 통해 고속도로에서의 속도를 추적할 수도 있습니다. 핸드폰 회사는 속도가 떨어지는 것을 보고 교통이 혼잡하다는 것을 알아챌 수가 있습니다. 그리고 이 정보를 그 회사 가입자들에게 보낼 수 있겠죠. 그것도 같은 고속도로의 교통혼잡 구역 뒷편에 있는 가입자들에게만 말이죠. 혹은 의사들이 처방하는 방식을 간접적으로 관찰해 새로운 약물이 의사들 사이에서 어떻게 선택되는지 확인할 수 있습니다. 혹은 다시 한번 사람들의 구매 행동을 관찰 이런 유형의 현상이 인구집단 안에서 어떻게 퍼져가는지 관찰할 수 있습니다.
And there are three ways, I think, that these massive-passive data can be used. One is fully passive, like I just described -- as in, for instance, the trucker example, where we don't actually intervene in the population in any way. One is quasi-active, like the flu example I gave, where we get some people to nominate their friends and then passively monitor their friends -- do they have the flu, or not? -- and then get warning. Or another example would be, if you're a phone company, you figure out who's central in the network and you ask those people, "Look, will you just text us your fever every day? Just text us your temperature." And collect vast amounts of information about people's temperature, but from centrally located individuals. And be able, on a large scale, to monitor an impending epidemic with very minimal input from people. Or, finally, it can be more fully active -- as I know subsequent speakers will also talk about today -- where people might globally participate in wikis, or photographing, or monitoring elections, and upload information in a way that allows us to pool information in order to understand social processes and social phenomena.
제 생각에 대량의 간접적 데이터를 활용하는 방식에는 세 가지가 있습니다. 하나는 제가 설명한 것과 같이 완전히 간접적이 되는 것입니다. 아까 예를 들었던 트럭 운전사의 경우와 같이 우리가 실제로 대상 집단에 어떤 전혀 개입하지 않는 거죠. 다른 하나는 약간 직접적인 방식으로 제가 이야기했던 독감의 경우처럼 우리가 몇몇 사람들에게 그들의 친구를 지명하게 하고 이후 간접적으로 그들의 친구를 관찰하는 것이죠. 그들이 독감에 걸렸는지 안걸렸는지 -- 그러면서 징후를 포착하게 되는 거죠 혹은 다른 예로 만약 여러분께서 전화 회사에 계신다면 누가 네트워크에 중심적인지 알 것이고 그 사람들에게 "매일 그냥 체온을 문자로 보내 주실 수 있을까요?"라고 부탁하는 겁니다. 그리고 중심부에 위치한 개인들의 체온만 모으는 겁니다. 이렇게 하면 임박한 전염병에 대해 각 개인이 제공하는 조그마한 정보를 대량으로 모아 추적할 수 있는 겁니다. 혹은 마지막으로 좀 더 완전히 직접적일 수 있습니다 -- 제 뒤의 연설자들께서도 오늘 이에 관해 말씀하시겠지만 -- 전세계적으로 사람들이 위키나 사진촬영, 선거감시 등에 동참하면서 정보를 쉽게 수집할 수 있는 방식으로 공유해 사회적으로 진행되고 있는 일이나 현상을 이해할 수 있게 되는 것이죠.
In fact, the availability of these data, I think, heralds a kind of new era of what I and others would like to call "computational social science." It's sort of like when Galileo invented -- or, didn't invent -- came to use a telescope and could see the heavens in a new way, or Leeuwenhoek became aware of the microscope -- or actually invented -- and could see biology in a new way. But now we have access to these kinds of data that allow us to understand social processes and social phenomena in an entirely new way that was never before possible. And with this science, we can understand how exactly the whole comes to be greater than the sum of its parts. And actually, we can use these insights to improve society and improve human well-being.
제 생각에는 실제로 이런 정보를 활용할 수 있다는 것 자체가 저나 다른 사람들이 "계산적 사회과학"이라 부르는 새로운 시대가 다가왔음을 의미한다고 봅니다. 이것은 갈릴레오가 만원경을 발명했을 때 -- 아니지 발명한게 아니죠 -- 만원경을 사용하여 새로운 방식으로 천체를 바라 본 것 혹은 레벤후크가 현미경을 알게 되었거나 -- 아니지 실제로 발명했죠 -- 새로운 방식으로 생물학을 바라볼 수 있었던 것에 비견된다고 하겠습니다. 하지만 이제는 사회적으로 진행되고 있는 일이나 사회적인 현상을 이전에는 가능하지 않았던 새로운 기법으로 이해할 수 있게 해 주는 그런 종류의 정보를 활용할 수 있습니다. 이런 과학을 통해 우리는 정확히 어째서 전체가 부분을 합한 것보다 더 클 수 있는지 이해할 수 있습니다. 실제로 사회를 개선하고 인류의 복지를 향상시키는데 우리는 이와 같은 직관력을 이용할 수 있습니다.
Thank you.
감사합니다.