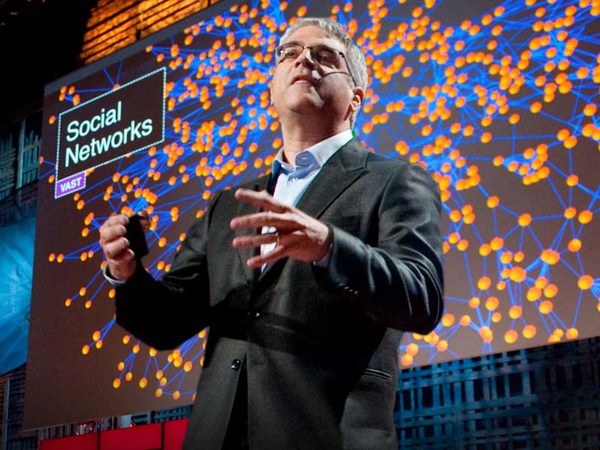
For the last 10 years, I've been spending my time trying to figure out how and why human beings assemble themselves into social networks. And the kind of social network I'm talking about is not the recent online variety, but rather, the kind of social networks that human beings have been assembling for hundreds of thousands of years, ever since we emerged from the African savannah. So, I form friendships and co-worker and sibling and relative relationships with other people who in turn have similar relationships with other people. And this spreads on out endlessly into a distance. And you get a network that looks like this. Every dot is a person. Every line between them is a relationship between two people -- different kinds of relationships. And you can get this kind of vast fabric of humanity, in which we're all embedded.
Selama 10 tahun, saya menghabiskan waktu untuk mencari tahu bagaimana dan mengapa manusia berkumpul membentuk jaringan sosial. Jaringan sosial yang saya maksud bukan jenis jaringan online baru-baru ini, tapi jaringan sosial yang dibentuk oleh manusia sejak ratusan ribu tahun lalu, sejak kita muncul di sabana Afrika. Saya menjalin hubungan pertemanan rekan kerja, saudara, dan keluarga dengan orang lain yang punya hubungan yang sama dengan orang lain. Ini menyebar terus tanpa ujung. Lalu kita dapatkan jaringan seperti ini. Setiap titik adalah orang. Setiap garis di antaranya adalah hubungan antara dua orang -- hubungan yang berbeda-beda. Yang lalu membentuk jalinan hubungan manusia seperti ini, kita semua ada di dalamnya.
And my colleague, James Fowler and I have been studying for quite sometime what are the mathematical, social, biological and psychological rules that govern how these networks are assembled and what are the similar rules that govern how they operate, how they affect our lives. But recently, we've been wondering whether it might be possible to take advantage of this insight, to actually find ways to improve the world, to do something better, to actually fix things, not just understand things. So one of the first things we thought we would tackle would be how we go about predicting epidemics.
Rekan kerja saya, James Fowler, dan saya cukup lama mempelajari aturan-aturan matematis, sosial, biologis dan psikologis yang mengatur pembentukan jaringan ini serta aturan serupa yang mengatur cara kerja, pengaruhnya pada hidup kita. Baru-baru ini, kami bertanya apakah mungkin memanfaatkan pemahaman ini, untuk menemukan cara memperbaiki dunia, melakukan dengan lebih baik, benar-benar melakukan sesuatu, bukan hanya memahami. Jadi yang pertama kami lakukan adalah memprediksi epidemi.
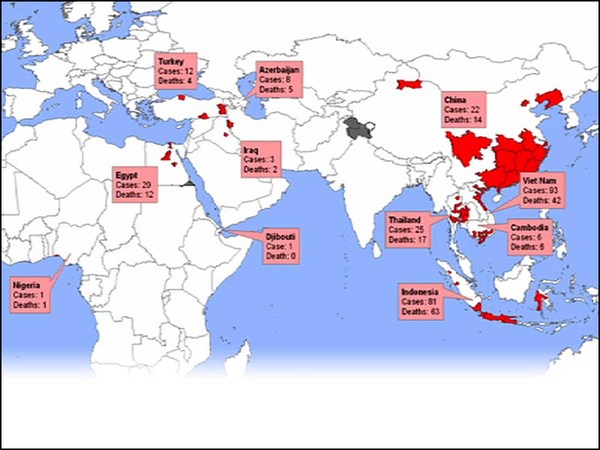
And the current state of the art in predicting an epidemic -- if you're the CDC or some other national body -- is to sit in the middle where you are and collect data from physicians and laboratories in the field that report the prevalence or the incidence of certain conditions. So, so and so patients have been diagnosed with something, or other patients have been diagnosed, and all these data are fed into a central repository, with some delay. And if everything goes smoothly, one to two weeks from now you'll know where the epidemic was today. And actually, about a year or so ago, there was this promulgation of the idea of Google Flu Trends, with respect to the flu, where by looking at people's searching behavior today, we could know where the flu -- what the status of the epidemic was today, what's the prevalence of the epidemic today.
Teknologi terdepan dalam memprediksi epidemi -- kalau Anda CDC atau badan nasional lainnya -- adalah duduk manis di kantor Anda mengumpulkan data dari dokter dan laboratorium di lapangan yang melaporkan prevalensi atau insiden kondisi tertentu. Sekian, sekian, dan sekian pasien sudah didiagnosis terkena. pasien lain sudah didiagnosis. semua data ini dimasukkan ke penyimpanan pusat, dengan jeda waktu. Kalau semua berjalan lancar, satu atau dua minggu kemudian, Anda akan tahu di mana epideminya hari itu. Sebenarnya, sekitar setahun lalu atau lebih, ada kabar tentang konsep Google Flu Trends, yang terkait dengan flu, yaitu dengan melihat perilaku pencarian hari ini, kita bisa tahu di mana ada flu ... apa status epideminya hari ini, apa prevelansi epideminya hari ini.
But what I'd like to show you today is a means by which we might get not just rapid warning about an epidemic, but also actually early detection of an epidemic. And, in fact, this idea can be used not just to predict epidemics of germs, but also to predict epidemics of all sorts of kinds. For example, anything that spreads by a form of social contagion could be understood in this way, from abstract ideas on the left like patriotism, or altruism, or religion to practices like dieting behavior, or book purchasing, or drinking, or bicycle-helmet [and] other safety practices, or products that people might buy, purchases of electronic goods, anything in which there's kind of an interpersonal spread. A kind of a diffusion of innovation could be understood and predicted by the mechanism I'm going to show you now.
Tapi yang ingin saya perlihatkan sekarang sebuah cara yang bisa digunakan tidak hanya untuk peringatan cepat adanya epidemi, tapi juga deteksi awal adanya epidemi. Ide ini bahkan bisa digunakan tidak hanya untuk epidemi kuman, tapi juga segala macam epidemi. Misalnya, apa pun yang menyebar melalui penularan sosial bisa dipahami dengan cara ini, dari ide abstrak sebelah kiri seperti patriotisme, altruisme, atau agama, sampai praktik seperti perilaku makan, pembelian buku, minum, atau helm sepeda dan praktik keamanan lainnya, produk yang mungkin dibeli orang-orang, pembelian barang elektronik, apa saja yang mengandung penyebaran interpersonal. Semacam difusi inovasi bisa dipahami dan diprediksi dengan mekanisme yang akan saya perlihatkan.
So, as all of you probably know, the classic way of thinking about this is the diffusion-of-innovation, or the adoption curve. So here on the Y-axis, we have the percent of the people affected, and on the X-axis, we have time. And at the very beginning, not too many people are affected, and you get this classic sigmoidal, or S-shaped, curve. And the reason for this shape is that at the very beginning, let's say one or two people are infected, or affected by the thing and then they affect, or infect, two people, who in turn affect four, eight, 16 and so forth, and you get the epidemic growth phase of the curve. And eventually, you saturate the population. There are fewer and fewer people who are still available that you might infect, and then you get the plateau of the curve, and you get this classic sigmoidal curve. And this holds for germs, ideas, product adoption, behaviors, and the like. But things don't just diffuse in human populations at random. They actually diffuse through networks. Because, as I said, we live our lives in networks, and these networks have a particular kind of a structure.
Seperti yang mungkin Anda tahu, pemikiran klasik tentang ini adalah difusi-inovasi, atau kurva adopsi. Jadi di sini ada sumbu Y, persentase orang yang terpengaruh, di sumbu X, waktu. Awalnya, tidak banyak orang yang terpengaruh, lalu kita dapat kurva sigmoid klasik ini, atau kurva berbentuk S. Penyebab bentuk ini adalah pada awalnya, misal saja satu atau dua orang terpengaruh, atau terinfeksi, oleh hal itu, lalu mempengaruhi, atau menginfeksi, dua orang, yang lalu mempengaruhi 4, 8, 16 dan seterusnya, kita dapatkan fase pertumbuhan epidemi pada kurva. Akhirnya populasi menyentuh titik saturasi. Semakin sedikit orang yang masih bisa terinfeksi, lalu kita menyentuh plato kurva, kita dapatkan kurva sigmoid klasik ini. Ini berlaku untuk kuman, ide, adopsi produk, perilaku, dan lain-lain. Tapi difusi dalam populasi manusia tidak terjadi secara acak. Difusi terjadi melalui jaringan. Karena kita hidup dalam jaringan. jaringan ini punya struktur tertentu.
Now if you look at a network like this -- this is 105 people. And the lines represent -- the dots are the people, and the lines represent friendship relationships. You might see that people occupy different locations within the network. And there are different kinds of relationships between the people. You could have friendship relationships, sibling relationships, spousal relationships, co-worker relationships, neighbor relationships and the like. And different sorts of things spread across different sorts of ties. For instance, sexually transmitted diseases will spread across sexual ties. Or, for instance, people's smoking behavior might be influenced by their friends. Or their altruistic or their charitable giving behavior might be influenced by their coworkers, or by their neighbors. But not all positions in the network are the same.
Misal Anda melihat jaringan seperti ini ... Ini 105 orang. Garis ini mewakili ... titik-titik ini orang, garis ini mewakili hubungan pertemanan. Kita bisa melihat bagaimana orang menempati lokasi yang berbeda dalam jaringan. Ada jenis hubungan yang berbeda antara orang-orang. Kita bisa punya hubungan pertemanan, hubungan saudara, hubungan pernikahan, hubungan kerja, hubungan tetangga, dan sebagainya. Berbagai hal yang berbeda ini menyebar melalui berbagai ikatan yang berbeda. Misal, penyakit kelamin yang menular menyebar melalui ikatan seksual. Misalnya lagi, perilaku merokok kemungkinan dipengaruhi oleh teman. Atau perilaku altruistis atau kedermawanan mungkin dipengaruhi oleh rekan kerja, atau oleh tetangga. Tapi tidak semua posisi di dalam jaringan sama.
So if you look at this, you might immediately grasp that different people have different numbers of connections. Some people have one connection, some have two, some have six, some have 10 connections. And this is called the "degree" of a node, or the number of connections that a node has. But in addition, there's something else. So, if you look at nodes A and B, they both have six connections. But if you can see this image [of the network] from a bird's eye view, you can appreciate that there's something very different about nodes A and B. So, let me ask you this -- I can cultivate this intuition by asking a question -- who would you rather be if a deadly germ was spreading through the network, A or B? (Audience: B.) Nicholas Christakis: B, it's obvious. B is located on the edge of the network. Now, who would you rather be if a juicy piece of gossip were spreading through the network? A. And you have an immediate appreciation that A is going to be more likely to get the thing that's spreading and to get it sooner by virtue of their structural location within the network. A, in fact, is more central, and this can be formalized mathematically. So, if we want to track something that was spreading through a network, what we ideally would like to do is to set up sensors on the central individuals within the network, including node A, monitor those people that are right there in the middle of the network, and somehow get an early detection of whatever it is that is spreading through the network.
Kalau kita lihat ini, Anda mungkin segera memahami masing-masing orang punya jumlah koneksi yang berbeda. Ada orang yang punya satu koneksi, ada yang dua, ada yang enam, ada yang punya 10 koneksi. Ini disebut "kelas" nodus. atau jumlah koneksi yang dimiliki oleh nodus. Tapi selain itu, ada yang lain. Kalau kita lihat nodus A dan B, keduanya punya enam koneksi. Tapi seperti yang Anda di gambar dengan skala besar ini, kita bisa melihat ada sesuatu yang sangat berbeda dari nodus A dan B. Coba Anda jawab -- saya bisa memancing intuisi ini dengan bertanya -- Anda pilih jadi siapa kalau kuman mematikan menyebar melalui jaringan, A atau B? (Pirsawan: B) Nicholas Christakis: B, jelas B berada di bagian tepi jaringan. Sekarang, Anda pilih jadi siapa kalau ada gosip hangat yang menyebar melalui jaringan? A. Kita bisa segera memahami bahwa A kemungkinannya lebih besar terkena yang sedang menyebar dan lebih cepat karena secara struktur lokasi mereka di dalam jaringan. Posisi A memang lebih memusat, ini bisa diformalkan secara matematis. Jadi, kalau kita ingin melacak sesuatu yang menyebar melalui jaringan, yang idealnya kita lakukan adalah menyiapkan sensor di individu-individu pusat di dalam jaringan, termasuk nodus A, pantau orang-orang yang tepat berada di tengah-tengah jaringan, dan dapatkan deteksi awal atas apa pun yang menyebar melalui jaringan.
So if you saw them contract a germ or a piece of information, you would know that, soon enough, everybody was about to contract this germ or this piece of information. And this would be much better than monitoring six randomly chosen people, without reference to the structure of the population. And in fact, if you could do that, what you would see is something like this. On the left-hand panel, again, we have the S-shaped curve of adoption. In the dotted red line, we show what the adoption would be in the random people, and in the left-hand line, shifted to the left, we show what the adoption would be in the central individuals within the network. On the Y-axis is the cumulative instances of contagion, and on the X-axis is the time. And on the right-hand side, we show the same data, but here with daily incidence. And what we show here is -- like, here -- very few people are affected, more and more and more and up to here, and here's the peak of the epidemic. But shifted to the left is what's occurring in the central individuals. And this difference in time between the two is the early detection, the early warning we can get, about an impending epidemic in the human population.
Kalau Anda melihat mereka terkena kuman atau informasi, Anda akan tahu, segera, semua orang akan terkena kuman ini atau informasi ini. Ini lebih baik dari pada memantau enam orang yang dipilih secara acak, tanpa referensi atas struktur populasi yang ada. Bahkan, kalau kita bisa melakukan ini, yang akan kita lihat adalah seperti ini. Di panel kiri, sekali lagi, kita punya kurva adopsi berbentuk S Di garis merah putus-putus, kita tampilkan adopsi yang terjadi pada orang-orang yang acak, di garis sebelah kiri, bergeser ke kiri, kita tampilkan adopsi pada individu-individu pusat di dalam jaringan. Di sumbu Y, jumlah kumulatif penyebaran, di sumbu X, waktu. Di sisi kanan, kita menampilkan data yang sama, tapi di sini disertai data harian. Yang kita tampilkan di sini -- seperti, di sini -- sangat sedikit orang yang terinfeksi, di atas sini semakin banyak, di sini puncak epideminya. Tapi bergeser ke kiri adalah apa yang terjadi pada individu pusat. Perbedaan waktu antara keduanya adalah deteksi awal, peringatan awal yang kita punya, terhadap ancaman epidemi pada populasi manusia.
The problem, however, is that mapping human social networks is not always possible. It can be expensive, not feasible, unethical, or, frankly, just not possible to do such a thing. So, how can we figure out who the central people are in a network without actually mapping the network? What we came up with was an idea to exploit an old fact, or a known fact, about social networks, which goes like this: Do you know that your friends have more friends than you do? Your friends have more friends than you do, and this is known as the friendship paradox. Imagine a very popular person in the social network -- like a party host who has hundreds of friends -- and a misanthrope who has just one friend, and you pick someone at random from the population; they were much more likely to know the party host. And if they nominate the party host as their friend, that party host has a hundred friends, therefore, has more friends than they do. And this, in essence, is what's known as the friendship paradox. The friends of randomly chosen people have higher degree, and are more central than the random people themselves.
Namun masalahnya, pemetaan jaringan sosial manusia tidak selalu bisa dilakukan. Biayanya mahal, sangat sulit, tidak etis, atau, sederhananya, tidak mungkin dilakukan. Jadi bagaimana cara mengetahui siapa orang pusat di suatu jaringan tanpa benar-benar memetakan jaringan? Yang kita ciptakan adalah ide untuk mengeksploitasi fakta lama, fakta yang sudah diketahui, tentang jaringan sosial, yang bunyinya: Tahukah Anda teman Anda punya lebih banyak teman dari pada Anda? Teman Anda punya lebih banyak teman dari pada Anda. Ini dikenal sebagai paradoks pertemanan. Bayangkan seorang yang sangat populer di jaringan sosial -- seperti tuan rumah pesta yang punya ratusan teman -- dan seorang antisosial hanya punya satu teman, kalau Anda memilih seseorang secara acak dari populasi itu; kemungkinan besar mereka kenal dengan tuan rumah pesta itu. Kalau mereka menominasikan dia sebagai teman mereka, dia berarti punya ratusan teman, karena itu, punya lebih banyak teman dari pada mereka. Ini, pada intinya, yang dikenal sebagai paradoks pertemanan. Teman dari orang yang dipilih secara acak punya kelas yang lebih tinggi, dan lebih memusat, dari pada orang yang dipilih acak itu sendiri.
And you can get an intuitive appreciation for this if you imagine just the people at the perimeter of the network. If you pick this person, the only friend they have to nominate is this person, who, by construction, must have at least two and typically more friends. And that happens at every peripheral node. And in fact, it happens throughout the network as you move in, everyone you pick, when they nominate a random -- when a random person nominates a friend of theirs, you move closer to the center of the network. So, we thought we would exploit this idea in order to study whether we could predict phenomena within networks. Because now, with this idea we can take a random sample of people, have them nominate their friends, those friends would be more central, and we could do this without having to map the network.
Secara intuitif Anda bisa memahami ini jika Anda bayangkan orang yang berada di tepi jaringan. Kalau Anda pilih orang ini, satu-satunya teman untuk dinominasikan adalah orang ini, yang, secara konstruksi, paling tidak punya dua teman, biasanya bahkan lebih. Itu terjadi di setiap nodus periferal. Bahkan, itu terjadi di seluruh jaringan saat Anda mulai masuk, semua yang Anda pilih, saat menominasikan secara acak... saat orang yang acak menominasikan teman mereka, Anda bergerak mendekat ke pusat jaringan. Jadi kami pikir kami bisa memanfaatkan ide ini untuk mempelajari cara memprediksi fenomena di dalam jaringan. Karena dengan ide ini, kita bisa memilih sampel secara acak, meminta mereka menominasikan teman mereka, teman mereka akan lebih memusat, kita bisa melakukan ini tanpa harus memetakan jaringan.
And we tested this idea with an outbreak of H1N1 flu at Harvard College in the fall and winter of 2009, just a few months ago. We took 1,300 randomly selected undergraduates, we had them nominate their friends, and we followed both the random students and their friends daily in time to see whether or not they had the flu epidemic. And we did this passively by looking at whether or not they'd gone to university health services. And also, we had them [actively] email us a couple of times a week. Exactly what we predicted happened. So the random group is in the red line. The epidemic in the friends group has shifted to the left, over here. And the difference in the two is 16 days. By monitoring the friends group, we could get 16 days advance warning of an impending epidemic in this human population.
Kami menguji ide ini dengan wabah flu H1N1 di Harvard College musim gugur dan dingin 2009, beberapa bulan lalu. Kami memilih secara acak 1.300 mahasiswa, kami minta mereka menominasikan teman mereka, kami ikuti mahasiswa yang kami pilih itu dan teman mereka setiap hari untuk melihat apakah mereka terkena epidemi flu. Kami melakukan ini secara pasif, melihat apakah mereka pergi ke pelayanan kesehatan universitas. Juga minta mereka secara aktif mengirimi kami email beberapa kali seminggu. Yang terjadi tepat seperti yang kami perkirakan. Grup yang acak ini ada di dalam garis merah. Epidemi grup teman bergerak ke kiri, di sini. Perbedaan keduanya adalah 16 hari. Dengan memantau grup teman, kami bisa mendapatkan peringatan awal 16 hari ancaman epidemi di populasi manusia ini.
Now, in addition to that, if you were an analyst who was trying to study an epidemic or to predict the adoption of a product, for example, what you could do is you could pick a random sample of the population, also have them nominate their friends and follow the friends and follow both the randoms and the friends. Among the friends, the first evidence you saw of a blip above zero in adoption of the innovation, for example, would be evidence of an impending epidemic. Or you could see the first time the two curves diverged, as shown on the left. When did the randoms -- when did the friends take off and leave the randoms, and [when did] their curve start shifting? And that, as indicated by the white line, occurred 46 days before the peak of the epidemic. So this would be a technique whereby we could get more than a month-and-a-half warning about a flu epidemic in a particular population.
Selain itu, kalau Anda adalah analis yang mencoba mempelajari epidemi atau memprediksi adopsi suatu produk, misalnya, yang harus Anda lakukan adalah memilih secara acak sampel dari populasi, meminta mereka menominasikan teman dan mengikuti mereka. mengikuti baik sampel acak maupun teman mereka. Pada teman, jika Anda melihat kedipan di atas nol pada adopsi inovasi, misalnya, itu akan bukti adanya ancaman epidemi. Atau jika Anda melihat kedua kurva berpisah, seperti terlihat di sebelah kiri. Kapan sampel acak... kapan teman mereka memisahkan diri meninggalkan sampel acak, kapan kurva mereka mulai bergeser? Dan seperti ditunjukkan dengan garis putih, terjadi dalam 46 hari sebelum puncak epidemi. Jadi ini akan menjadi teknik yang bisa memberi peringatan satu bulan setengah lebih awal akan epidemi flu di populasi tertentu.
I should say that how far advanced a notice one might get about something depends on a host of factors. It could depend on the nature of the pathogen -- different pathogens, using this technique, you'd get different warning -- or other phenomena that are spreading, or frankly, on the structure of the human network. Now in our case, although it wasn't necessary, we could also actually map the network of the students.
Namun, harus saya katakan Seawal apa pemberitahuan tentang sesuatu bisa diberikan tergantung pada kerentanan inang. Tergantung pada sifat alamiah patogen -- patogen yang berbeda dengan teknik ini, Anda dapat peringatan yang berbeda -- atau fenomena lain yang menyebar, atau tentang struktur jaringan manusia. Dalam kasus kami, meski pun tidak perlu, kamu juga memetakan jaringan para mahasiswa itu.
So, this is a map of 714 students and their friendship ties. And in a minute now, I'm going to put this map into motion. We're going to take daily cuts through the network for 120 days. The red dots are going to be cases of the flu, and the yellow dots are going to be friends of the people with the flu. And the size of the dots is going to be proportional to how many of their friends have the flu. So bigger dots mean more of your friends have the flu. And if you look at this image -- here we are now in September the 13th -- you're going to see a few cases light up. You're going to see kind of blooming of the flu in the middle. Here we are on October the 19th. The slope of the epidemic curve is approaching now, in November. Bang, bang, bang, bang, bang -- you're going to see lots of blooming in the middle, and then you're going to see a sort of leveling off, fewer and fewer cases towards the end of December. And this type of a visualization can show that epidemics like this take root and affect central individuals first, before they affect others.
Ini adalah peta 714 mahasiswa dan ikatan pertemanan mereka. Sesaat lagi, saya akan menjalankan peta ini. Kita akan melihat perkembangan jaringan per hari selama 120 hari. Titik merah adalah kasus flu, titik kuning adalah teman orang yang terkena flu. Ukuran titik akan proporsional terhadap banyaknya teman yang terkena flu. Jadi semakin besar titik semakin banyak teman yang terkena flu. Kalau Anda lihat gambar ini -- di sini sekarang tanggal 13 September -- Anda akan melihat beberapa kasus mulai menyala. Kita bisa melihat titik flu semakin besar di bagian tengah. Di sini tanggal 19 Oktober. Turunan kurva epidemi mulai mendekat, di bulan November. Dor, dor, dor, dor, dor, kita bisa melihat banyak titik yang membesar di tengah, kita lalu melihat semacam penurunan, semakin sedikit kasus di akhir bulan Desember. Jenis visualisasi ini bisa menunjukkan bahwa epidemi seperti ini berakar dan mempengaruhi individu pusat dulu, sebelum mempengaruhi yang lain.
Now, as I've been suggesting, this method is not restricted to germs, but actually to anything that spreads in populations. Information spreads in populations, norms can spread in populations, behaviors can spread in populations. And by behaviors, I can mean things like criminal behavior, or voting behavior, or health care behavior, like smoking, or vaccination, or product adoption, or other kinds of behaviors that relate to interpersonal influence. If I'm likely to do something that affects others around me, this technique can get early warning or early detection about the adoption within the population. The key thing is that for it to work, there has to be interpersonal influence. It cannot be because of some broadcast mechanism affecting everyone uniformly.
Seperti yang saya katakan sebelumnya, metode ini tidak terbatas pada kuman, tapi apa pun yang menyebar dalam populasi. Informasi menyebar dalam populasi. Norma menyebar dalam populasi. Perilaku menyebar dalam populasi. Perilaku bisa berarti banyak hal seperti perilaku kriminal, atau perilaku pemilih, atau pelayanan kesehatan, seperti merokok, atau vaksinasi, atau adopsi produk, atau jenis perilaku lainnya yang berhubungan dengan pengaruh interpersonal. Kalau saya bisa melakukan yang mempengaruhi yang di sekitar saya, teknik ini bisa memberikan peringatan awal, atau deteksi awal, tentang adopsi yang ada di populasi. Yang penting, agar berfungsi, harus ada pengaruh interpersonal Bukan karena adanya mekanisme penyiaran tertentu yang mempengaruhi semua bersamaan.
Now the same insights can also be exploited -- with respect to networks -- can also be exploited in other ways, for example, in the use of targeting specific people for interventions. So, for example, most of you are probably familiar with the notion of herd immunity. So, if we have a population of a thousand people, and we want to make the population immune to a pathogen, we don't have to immunize every single person. If we immunize 960 of them, it's as if we had immunized a hundred [percent] of them. Because even if one or two of the non-immune people gets infected, there's no one for them to infect. They are surrounded by immunized people. So 96 percent is as good as 100 percent. Well, some other scientists have estimated what would happen if you took a 30 percent random sample of these 1000 people, 300 people and immunized them. Would you get any population-level immunity? And the answer is no. But if you took this 30 percent, these 300 people and had them nominate their friends and took the same number of vaccine doses and vaccinated the friends of the 300 -- the 300 friends -- you can get the same level of herd immunity as if you had vaccinated 96 percent of the population at a much greater efficiency, with a strict budget constraint.
Pemahaman yang sama ini juga bisa dimanfaatkan -- terkait dengan jaringan -- juga bisa dimanfaatkan dalam cara lain, misalnya, dalam penggunaan penargetan orang-orang tertentu untuk intervensi. Misalnya, Anda mungkin pernah mendengar tentang konsep imunitas kawanan. Kalau kita punya populasi terdiri dari seribu orang, dan ingin membuat populasi itu kebal terhadap sebuah patogen, kita tidak perlu mengimunisasi semua orang. Kalau kita mengimunisasi 960 orang, itu seperti kita sudah mengimunisasi seratus persen. Karena kalau pun ada satu dua orang tidak kebal yang terinfeksi, tidak ada orang lain yang bisa mereka tulari. Mereka dikelilingi oleh orang-orang yang kebal. Jadi 96 persen sama baiknya dengan 100 persen. Beberapa ilmuwan sudah memperkirakan apa yang terjadi kalau kita mengambil sampel acak sebesar 30 persen dari 1000 orang, 300 orang dan mengimunisasi mereka. Apakah kita akan mendapatkan kekebalan tingkat populasi? Jawabannya tidak. Tapi kalau Anda ambil 30 persen ini, 300 orang ini, minta mereka menominasikan teman mereka mengambil jumlah dosis vaksin yang sama memvaksinasi teman dari yang 300 itu, 300 teman, Anda bisa mendapatkan imunitas kawanan yang sama seperti Anda memvaksinasi 96 persen populasi itu dengan efisiensi yang lebih besar, dengan batas anggaran yang ketat.
And similar ideas can be used, for instance, to target distribution of things like bed nets in the developing world. If we could understand the structure of networks in villages, we could target to whom to give the interventions to foster these kinds of spreads. Or, frankly, for advertising with all kinds of products. If we could understand how to target, it could affect the efficiency of what we're trying to achieve. And in fact, we can use data from all kinds of sources nowadays [to do this].
Ide seperti ini bisa digunakan, misalnya, untuk membidik distribusi barang seperti kelambu di negara berkembang. Jika kita bisa memahami struktur jaringan di desa, kita bisa membidik orang-orang yang akan kita intervensi untuk mengarahkan penyebaran ini. Atau bisa juga untuk periklanan dengan berbagai jenis produk. Kalau kita bisa memahami cara membidik target, ini dapat mempengaruhi efisiensi apa yang ingin kita capai. Bahkan, kita bisa menggunakan data dari segala macam jenis sumber sekarang ini untuk melakukannya.
This is a map of eight million phone users in a European country. Every dot is a person, and every line represents a volume of calls between the people. And we can use such data, that's being passively obtained, to map these whole countries and understand who is located where within the network. Without actually having to query them at all, we can get this kind of a structural insight. And other sources of information, as you're no doubt aware are available about such features, from email interactions, online interactions, online social networks and so forth. And in fact, we are in the era of what I would call "massive-passive" data collection efforts. They're all kinds of ways we can use massively collected data to create sensor networks to follow the population, understand what's happening in the population, and intervene in the population for the better. Because these new technologies tell us not just who is talking to whom, but where everyone is, and what they're thinking based on what they're uploading on the Internet, and what they're buying based on their purchases. And all this administrative data can be pulled together and processed to understand human behavior in a way we never could before.
Ini adalah peta delapan juta pengguna telepon di sebuah negara Eropa. Setiap titik adalah orang, dan setiap garis mewakili volume panggilan antara orang-orang itu. Kita bisa menggunakan data ini, yang diperoleh secara pasif, untuk memetakan seluruh negara ini dan memahami siapa yang berada di mana di dalam jaringan. Tanpa harus menanyai mereka langsung, kita bisa dapat pemahaman struktural ini. Sumber informasi lainnya, yang pastinya Anda tahu, menyediakan fitur semacam itu, dari interaksi email, interaksi online, jaringan sosial online, dan sebagainya. Bahkan, kita ini berada di era yang saya sebut usaha pengumpulan data "luas-pasif" Banyak cara yang bisa digunakan untuk mengumpulkan data secara luas untuk membuat jaringan sensor untuk mengikuti populasi, memahami apa yang terjadi dalam populasi, mengintervensi populasi dengan tujuan memperbaiki. Karena teknologi baru ini memberitahu kita bukan sekadar siapa berbicara dengan siapa, tapi di mana mereka, apa yang mereka pikirkan berdasarkan apa yang mereka unggah ke internet. apa yang mereka beli berdasarkan pembelian mereka. Semua data administratif ini bisa dikumpulkan diproses untuk memahami perilaku manusia dengan cara yang tidak bisa kita lakukan sebelumnya.
So, for example, we could use truckers' purchases of fuel. So the truckers are just going about their business, and they're buying fuel. And we see a blip up in the truckers' purchases of fuel, and we know that a recession is about to end. Or we can monitor the velocity with which people are moving with their phones on a highway, and the phone company can see, as the velocity is slowing down, that there's a traffic jam. And they can feed that information back to their subscribers, but only to their subscribers on the same highway located behind the traffic jam! Or we can monitor doctors prescribing behaviors, passively, and see how the diffusion of innovation with pharmaceuticals occurs within [networks of] doctors. Or again, we can monitor purchasing behavior in people and watch how these types of phenomena can diffuse within human populations.
Misalnya, kita bisa menggunakan data pembelian bahan bakar supir truk. Supir truk bisa menjalankan kegiatan mereka seperti biasa, mereka membeli bahan bakar. Kita bisa melihat titik berkedip pada pembelian bahan bakar supir truk, kita jadi tahu bahwa resesi akan berakhir. Kita bisa memantau kecepatan orang-orang di jalan raya dengan telepon mereka, perusahaan telepon bisa melihat, kalau kecepatannya berkurang, berarti ada kemacetan. Mereka bisa mengirimkan informasi ini ke pelanggan mereka, tapi hanya ke pelanggan yang berada di jalan yang sama yang berada di belakang kemacetan itu! Kita bisa memantau perilaku pemberian resep dokter, secara pasif, melihat bagaimana difusi inovasi dalam hal obat-obatan terjadi di jaringan para dokter. Kita juga bisa memantau perilaku pembelian orang-orang, melihat bagaimana fenomena ini berdifusi di dalam populasi manusia.
And there are three ways, I think, that these massive-passive data can be used. One is fully passive, like I just described -- as in, for instance, the trucker example, where we don't actually intervene in the population in any way. One is quasi-active, like the flu example I gave, where we get some people to nominate their friends and then passively monitor their friends -- do they have the flu, or not? -- and then get warning. Or another example would be, if you're a phone company, you figure out who's central in the network and you ask those people, "Look, will you just text us your fever every day? Just text us your temperature." And collect vast amounts of information about people's temperature, but from centrally located individuals. And be able, on a large scale, to monitor an impending epidemic with very minimal input from people. Or, finally, it can be more fully active -- as I know subsequent speakers will also talk about today -- where people might globally participate in wikis, or photographing, or monitoring elections, and upload information in a way that allows us to pool information in order to understand social processes and social phenomena.
Ada tiga cara menurut saya, untuk menggunakan data pasif-luas ini. Yang pertama, benar-benar pasif, seperti yang saya gambarkan -- misalnya dalam contoh supir truk tadi, kita tidak perlu mengintervensi populasi dengan cara apa pun. Berikutnya, quasi-aktif, seperti contoh flu di atas, kita meminta beberapa orang menominasikan teman mereka secara pasif memantau teman mereka -- apakah terkena flu atau tidak? -- dan mendapat peringatan awal. Contoh lainnya misal, kalau Anda adalah perusahaan telepon, Anda bisa tahu siapa yang jadi pusat jaringan, Anda minta ke orang-orang itu, "Maaf, bisa SMS-kan demam Anda setiap hari? SMS-kan saja suhu Anda." Kumpulkan informasi suhu orang-orang dalam jumlah yang banyak, tapi dari individu yang berada di pusat. Dalam skala yang besar, ini bisa memantau ancaman epidemi dengan input yang minimal dari orang-orang. Yang terakhir, bisa lebih aktif -- pembicara berikutnya hari ini juga akan berbicara tentang ini -- di mana orang-orang bisa berpartisipasi dalam wiki secara global, atau fotografi, atau pemantau pemilu, dan mengungah informasi dalam cara yang memungkinkan kita mengumpulkan informasi untuk memahami proses sosial dan fenomena sosial.
In fact, the availability of these data, I think, heralds a kind of new era of what I and others would like to call "computational social science." It's sort of like when Galileo invented -- or, didn't invent -- came to use a telescope and could see the heavens in a new way, or Leeuwenhoek became aware of the microscope -- or actually invented -- and could see biology in a new way. But now we have access to these kinds of data that allow us to understand social processes and social phenomena in an entirely new way that was never before possible. And with this science, we can understand how exactly the whole comes to be greater than the sum of its parts. And actually, we can use these insights to improve society and improve human well-being.
Bahkan menurut saya ketersediaan data ini menghantarkan kita ke era baru yang saya dan rekan-rekan lain ingin sebut "ilmu sosial komputasional." Ini seperti saat Galileo menciptakan -- atau tidak menciptakan -- menggunakan teleskop melihat langit dengan cara baru, atau saat Leeuwenhoek sadar akan fungsi mikroskop -- atau benar-benar menciptakannya -- melihat biologi dengan cara baru. Sekarang kita punya akses ke data semacam ini yang memungkinkan kita memahami proses sosial dan fenomena sosial dengan cara yang benar-benar baru yang sebelumnya tidak mungkin dilakukan. Dengan ilmu ini, kita bisa memahami bagaimana tepatnya kumpulan bisa menjadi lebih besar dari hasil penjumlahan bagian-bagiannya. Bahkan, kita bisa menggunakan pemahaman ini untuk memperbaiki masyarakat dan umat manusia.
Thank you.
Terima kasih.