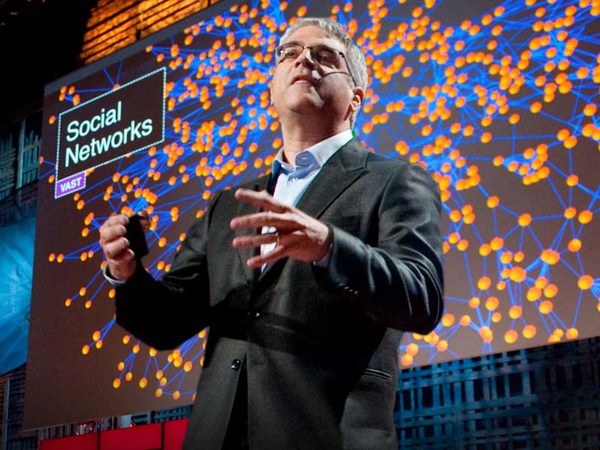
For the last 10 years, I've been spending my time trying to figure out how and why human beings assemble themselves into social networks. And the kind of social network I'm talking about is not the recent online variety, but rather, the kind of social networks that human beings have been assembling for hundreds of thousands of years, ever since we emerged from the African savannah. So, I form friendships and co-worker and sibling and relative relationships with other people who in turn have similar relationships with other people. And this spreads on out endlessly into a distance. And you get a network that looks like this. Every dot is a person. Every line between them is a relationship between two people -- different kinds of relationships. And you can get this kind of vast fabric of humanity, in which we're all embedded.
במהלך עשר השנים האחרונות, ביליתי את זמני בניסיון להבין כיצד ומדוע בני אדם מקבצים עצמם לרשתות חברתיות וסוגי הרשתות החברתיות שאני מדבר עליהן אינן הרשתות המקוונות שצצו לאחרונה אלא רשתות חברתיות מסוג שבני האדם יוצרים כבר מאות אלפי שנים מאז הגחנו מהסוואנה האפריקנית כך, אני יוצר חברויות וקשרי עבודה קשרי אחים ומערכות יחסים עם בני משפחה אחרים ולהם בתורם מערכות יחסים דומות עם אנשים אחרים. וזה מתפשט עד אין סוף למרחקים ואנו מקבלים רשת שנראית כך. כל נקודה מייצגת אדם כל קו ביניהן מייצג מערכת יחסים בין שני בני אדם -- מערכות יחסים מסוגים שונים. ואתם יכולים לקבל מין מארג עצום של האנושות, בתוכו כולנו מוטמעים.
And my colleague, James Fowler and I have been studying for quite sometime what are the mathematical, social, biological and psychological rules that govern how these networks are assembled and what are the similar rules that govern how they operate, how they affect our lives. But recently, we've been wondering whether it might be possible to take advantage of this insight, to actually find ways to improve the world, to do something better, to actually fix things, not just understand things. So one of the first things we thought we would tackle would be how we go about predicting epidemics.
ועמיתי, ג'יימס פאולר, ואני חוקרים כבר זמן רב למדי מהם החוקים המתמטיים, החברתיים הביולוגיים והפסיכולוגיים המושלים ביצירת הרשתות הללו ומהם החוקים המקבילים המושלים באופן פעולתן, באופן בו הן משפיעות על חיינו. ולאחרונה, התחלנו לתהות האם ייתכן לנצל את התובנה הזו, על מנת למצוא דרכים לשפר את העולם, לעשייה חיובית יותר, לתקן דברים, לא רק להבין דברים. אז אחד הדברים הראשונים שחשבנו שנתמודד איתם היה האופן בו אנו חוזים מגיפות.
And the current state of the art in predicting an epidemic -- if you're the CDC or some other national body -- is to sit in the middle where you are and collect data from physicians and laboratories in the field that report the prevalence or the incidence of certain conditions. So, so and so patients have been diagnosed with something, or other patients have been diagnosed, and all these data are fed into a central repository, with some delay. And if everything goes smoothly, one to two weeks from now you'll know where the epidemic was today. And actually, about a year or so ago, there was this promulgation of the idea of Google Flu Trends, with respect to the flu, where by looking at people's searching behavior today, we could know where the flu -- what the status of the epidemic was today, what's the prevalence of the epidemic today.
והשיטה העדכנית ביותר בניבוי מגיפה -- אם אתם המרכז הלאומי לבקרת מחלות או גוף לאומי אחר כלשהו -- היא לשבת במרכז, איפה שלא תהיה, ולאסוף נתונים מרופאים ומעבדות הנמצאים בשטח המדווחים מהי שכיחותם או היקפם של תנאים מסויימים. אז, כך וכך מטופלים אובחנו כחולים במשהו מסויים [במקום זה] או מטופלים אחרים אובחנו כחולים [במקום אחר] וכל הנתונים האלו מוזנים למאגר מרכזי, באיחור מסויים. ואם הכל מתנהל כשורה בעוד שבוע עד שבועיים מעכשיו, תדעו איפה נמצאת המגיפה היום. ולמעשה, לפני כשנה, הייתה אותה הכרזה על רעיון "מגמות השפעת של גוגל", בהתייחס לשפעת, שם, באמצעות התבוננות בהתנהגות החיפוש של אנשים היום נוכל לדעת איפה השפעת... מה מצבה העדכני של המגיפה היום מה שכיחות המגיפה היום
But what I'd like to show you today is a means by which we might get not just rapid warning about an epidemic, but also actually early detection of an epidemic. And, in fact, this idea can be used not just to predict epidemics of germs, but also to predict epidemics of all sorts of kinds. For example, anything that spreads by a form of social contagion could be understood in this way, from abstract ideas on the left like patriotism, or altruism, or religion to practices like dieting behavior, or book purchasing, or drinking, or bicycle-helmet [and] other safety practices, or products that people might buy, purchases of electronic goods, anything in which there's kind of an interpersonal spread. A kind of a diffusion of innovation could be understood and predicted by the mechanism I'm going to show you now.
אבל מה שהייתי רוצה להראות לכם היום זהו אמצעי שבעזרתו ייתכן שנוכל לקבל לא רק אזהרה בזמן אמת במקרה של מגיפה אלא אפילו איתור מוקדם של מגפה. ולמעשה, הרעיון הזה יכול לשמש לא רק לשם חיזוי מגפות חיידקיות אלא גם מגיפות ממגוון סוגים. לדוגמה, כל מה שמתפשט בצורה של הדבקה חברתית יוכל להיות מובן בצורה הזו, החל מרעיונות מופשטים משמאל כמו פטריוטיות, אלטרואיזם או דת וכלה במנהגים כמו הרגלי דיאטה, או קניית ספרים, או שתייה, או קסדות אופניים...[ו] נוהגי בטיחות אחרים, או מוצרים שאנשים עשויים לקנות, רכישות של מוצרי אלקטרוניקה כל דבר בו יש צורה כלשהי של התפשטות בין-אישית. מעין דיפוזיה של חדשנות הניתנת להבנה ולניבוי בעזרת המנגנון שאני עומד להראות לכם כעת.
So, as all of you probably know, the classic way of thinking about this is the diffusion-of-innovation, or the adoption curve. So here on the Y-axis, we have the percent of the people affected, and on the X-axis, we have time. And at the very beginning, not too many people are affected, and you get this classic sigmoidal, or S-shaped, curve. And the reason for this shape is that at the very beginning, let's say one or two people are infected, or affected by the thing and then they affect, or infect, two people, who in turn affect four, eight, 16 and so forth, and you get the epidemic growth phase of the curve. And eventually, you saturate the population. There are fewer and fewer people who are still available that you might infect, and then you get the plateau of the curve, and you get this classic sigmoidal curve. And this holds for germs, ideas, product adoption, behaviors, and the like. But things don't just diffuse in human populations at random. They actually diffuse through networks. Because, as I said, we live our lives in networks, and these networks have a particular kind of a structure.
אז, כמו שכולכם בוודאי יודעים, הדרך הקלאסית לחשוב על זה היא דרך ההפצה של חידוש, או עקומת ההטמעה. אז כאן, על ציר ה-Y, יש לנו את אחוז האנשים המושפעים ועל ציר ה-X, יש לנו זמן. ממש בהתחלה, לא יותר מדי אנשים מושפעים, ואנו מקבלים עקומה סיגמואידית, או עקומה דמויית-S. והסיבה לצורה הזו היא שממש בהתחלה, בואו נאמר אדם אחד או שניים מושפעים, או מודבקים, על ידי הדבר המסויים, והם משפיעים על, או מדביקים, שני אנשים, שבתורם משפיעים על ארבעה, שמונה, שישה עשר וכן הלאה, ואז מקבלים את שלב התפשטות המגיפה של העקומה. ולבסוף, אתם מרווים את האוכלוסיה. יש פחות ופחות אנשים שעדיין זמינים להדבקה, ואז מקבלים את הישור של העקומה, ואתם מקבלים את העקומה הסיגמואידית הקלאסית. וזה נכון בעבור חיידקים, רעיונות אימוץ של מוצרים, התנהגויות ודומיהם. אלא שדברים אינם מתפשטים באוכלוסיות אנושיות באופן אקראי. הם למעשה מתפשטים דרך רשתות. מאחר וכמו שאמרתי, אנו חיים את חיינו ברשתות, ולרשתות אלו יש מבנה מסוג מסוים.
Now if you look at a network like this -- this is 105 people. And the lines represent -- the dots are the people, and the lines represent friendship relationships. You might see that people occupy different locations within the network. And there are different kinds of relationships between the people. You could have friendship relationships, sibling relationships, spousal relationships, co-worker relationships, neighbor relationships and the like. And different sorts of things spread across different sorts of ties. For instance, sexually transmitted diseases will spread across sexual ties. Or, for instance, people's smoking behavior might be influenced by their friends. Or their altruistic or their charitable giving behavior might be influenced by their coworkers, or by their neighbors. But not all positions in the network are the same.
אם נסתכל על רשת כמו זו... יש כאן 105 אנשים. והקווים מייצגים.. הנקודות הם האנשים, והקווים מייצגים קשרי חברות. אולי תוכלו לראות שאנשים מאכלסים מיקומים שונים בתוך הרשת. וישנם סוגים שונים של מערכות יחסים בין האנשים. יכולים להיות לכם מערכות יחסים עם חברים, מערכות יחסים עם אחים, מערכות יחסים עם בני זוג, מערכות יחסים עם חברים לעבודה. מערכות יחסים עם שכנים וכדומה. ודברים מסוגים שונים מתפשטים דרך קשרים מסוגים שונים. למשל, מחלות מין יתפזרו לאורך קשרים מיניים או לדוגמה, הרגלי עישון של אנשים עלולים להיות מושפעים מחבריהם. או התנהגותם האלטרואיסטית או הנתינה שלהם לצדקה עשויים להיות מושפעים על ידי חבריהם לעבודה, או על ידי שכניהם. אבל לא כל העמדות ברשת דומות זו לזו.
So if you look at this, you might immediately grasp that different people have different numbers of connections. Some people have one connection, some have two, some have six, some have 10 connections. And this is called the "degree" of a node, or the number of connections that a node has. But in addition, there's something else. So, if you look at nodes A and B, they both have six connections. But if you can see this image [of the network] from a bird's eye view, you can appreciate that there's something very different about nodes A and B. So, let me ask you this -- I can cultivate this intuition by asking a question -- who would you rather be if a deadly germ was spreading through the network, A or B? (Audience: B.) Nicholas Christakis: B, it's obvious. B is located on the edge of the network. Now, who would you rather be if a juicy piece of gossip were spreading through the network? A. And you have an immediate appreciation that A is going to be more likely to get the thing that's spreading and to get it sooner by virtue of their structural location within the network. A, in fact, is more central, and this can be formalized mathematically. So, if we want to track something that was spreading through a network, what we ideally would like to do is to set up sensors on the central individuals within the network, including node A, monitor those people that are right there in the middle of the network, and somehow get an early detection of whatever it is that is spreading through the network.
אז אם תסתכלו בתמונה, ייתכן שתתפסו מיד שלאנשים שונים יש מספר שונה של קשרים. לחלק מהאנשים יש קשר אחד, לאחרים יש שניים. לחלק יש שישה, לאחרים עשרה קשרים. וזה נקרה "מעלה" של צומת, או מספר הקשרים שיש לצומת. אך בנוסף, יש משהו אחר. כך, אם תסתכלו בצמתים A ו-B, לכל אחד יש שישה קשרים. אבל אם אתם מסוגלים לראות את התמונה הזו [של הרשת] ממעוף הציפור, אתם יכולים להעריך שיש משהו שונה מאוד בין צמתים A ו-B. אז, תנו לי לשאול אתכם את זה -- אנסה לפתח את האינטואיציה הזו על ידי שאלה - מי הייתם מעדיפים להיות אם חיידק קטלני היה מתפשט דרך הרשת, A או B ? (קהל : B.) ניקולס כריסטאקיס: B, זה ברור. B ממוקם בקצה הרשת. עכשיו, מי הייתם מעדיפים להיות אם פיסת רכילות עסיסית הייתה מתפשטת דרך הרשת? A. ויש לכם יכולת להערכה מיידית שסביר יותר להניח ש-A יחשף למה שמתפשט ויחשף אליו מוקדם יותר בזכות מיקומו המבני בתוך הרשת. A, למעשה, הוא מרכזי יותר, ותכונה זו אפשר לאשר רשמית באופן מתמטי. אז, אם אנו רוצים לעקוב אחר משהו שהתפשט דרך רשת כלשהי, מה שהיינו רוצים לעשות, באופן אידיאלי, הוא להציב חיישנים בצמתים המרכזיים ברשת, כולל צומת A, לנטר אנשים אלו, שהם ממש במרכז הרשת, ובצורה כלשהי לקבל איתור מוקדם של מה שלא יהיה שמתפשט דרך הרשת..
So if you saw them contract a germ or a piece of information, you would know that, soon enough, everybody was about to contract this germ or this piece of information. And this would be much better than monitoring six randomly chosen people, without reference to the structure of the population. And in fact, if you could do that, what you would see is something like this. On the left-hand panel, again, we have the S-shaped curve of adoption. In the dotted red line, we show what the adoption would be in the random people, and in the left-hand line, shifted to the left, we show what the adoption would be in the central individuals within the network. On the Y-axis is the cumulative instances of contagion, and on the X-axis is the time. And on the right-hand side, we show the same data, but here with daily incidence. And what we show here is -- like, here -- very few people are affected, more and more and more and up to here, and here's the peak of the epidemic. But shifted to the left is what's occurring in the central individuals. And this difference in time between the two is the early detection, the early warning we can get, about an impending epidemic in the human population.
כלומר, אם הבחנתם בכך שהם נדבקים בחיידק או מתוודעים למידע כלשהו, תוכלו לדעת שבקרוב מאוד, כולם עומדים להדבק בחיידק הזה או לגלות את המידע הזה. וזה יהיה הרבה יותר טוב מאשר לנטר שישה אנשים שנבחרו בצורה אקראית, בלי התייחסות למבנה האוכלוסיה. ולמעשה, אם נוכל לעשות זאת, מה שתראו הוא משהו כמו זה. בפאנל השמאלי יש לנו, שוב, את עקומת ה-S של אימוץ החידוש. בקו המנוקד באדום, אנו מראים מה יהיה האימוץ של האנשים שנבחרו אקראית ובקו השמאלי (הצהוב), בהסטה מסויימת לשמאל, אנו רואים את עקומת האימוץ של הפרטים המרכזיים ברשת. ציר ה-Y מייצג את הצטברות מקרי ההידבקות, וציר ה-X מייצג את הזמן. ובצד ימין, אנו מראים אותם הנתונים אבל במדידה יומית. ומה שאנו מראים כאן הוא -- כאילו, כאן -- מעט מאוד אנשים מושפעים, עוד ועוד ועוד ועד למעלה, והנה שיא המגפה. מוסט לשמאל הוא מה שמתרחש אצל הפרטים המרכזיים. וההבדל הזה בזמן בין השניים הוא האיתור המוקדם, האזהרה המוקדמת שאנו יכולים לקבל, על המגפה שבדרך באוכלוסייה האנושית.
The problem, however, is that mapping human social networks is not always possible. It can be expensive, not feasible, unethical, or, frankly, just not possible to do such a thing. So, how can we figure out who the central people are in a network without actually mapping the network? What we came up with was an idea to exploit an old fact, or a known fact, about social networks, which goes like this: Do you know that your friends have more friends than you do? Your friends have more friends than you do, and this is known as the friendship paradox. Imagine a very popular person in the social network -- like a party host who has hundreds of friends -- and a misanthrope who has just one friend, and you pick someone at random from the population; they were much more likely to know the party host. And if they nominate the party host as their friend, that party host has a hundred friends, therefore, has more friends than they do. And this, in essence, is what's known as the friendship paradox. The friends of randomly chosen people have higher degree, and are more central than the random people themselves.
אולם הבעיה היא, שמיפוי רשתות חברתיות של בני אדם אינו תמיד אפשרי. זה יכול להיות יקר, [קשה מאוד], לא אתי, או, למען האמת, פשוט לא אפשרי. אז, כיצד נבין מי הם האנשים המרכזיים ברשת מבלי למעשה למפות את הרשת ? מה שהעלינו הוא רעיון המנצל עובדה ישנה, או עובדה ידועה, על רשתות חברתיות, שהולך כך: האם אתה יודע שלחברים שלך יש יותר חברים מאשר לך ? לחברים שלך יש יותר חברים מאשר לך. וזה ידוע בתור פרדוקס החברות. דמיינו לעצמכם אדם מאוד פופולרי ברשת חברתית -- כמו מארח מסיבה שיש לו מאות חברים -- ומיזנטרופ (שונא אדם) שיש לו רק חבר אחד, ותבחרו מישהו באופן אקראי מהאוכלוסיה; להם יש הרבה יותר סיכוי להכיר את מארח המסיבה. ואם הם בוחרים במארח המסיבה בתור החבר שלהם, למארח יש מאה חברים, ולכן יש לו יותר חברים מאשר להם. וזה, במהותו, ידוע כפרדוקס החברות. החברים של אנשים שנבחרו באקראי בעלי דרגה יותר גבוהה, והם יותר מרכזיים, מאשר האנשים שנבחרו באקראי.
And you can get an intuitive appreciation for this if you imagine just the people at the perimeter of the network. If you pick this person, the only friend they have to nominate is this person, who, by construction, must have at least two and typically more friends. And that happens at every peripheral node. And in fact, it happens throughout the network as you move in, everyone you pick, when they nominate a random -- when a random person nominates a friend of theirs, you move closer to the center of the network. So, we thought we would exploit this idea in order to study whether we could predict phenomena within networks. Because now, with this idea we can take a random sample of people, have them nominate their friends, those friends would be more central, and we could do this without having to map the network.
ואתם יכולים לקבל הערכה אינטואיטיבית לזה אם תדמיינו רק את האנשים שנמצאים בקצוות הרשת. אם תבחרו באדם הזה, האדם היחיד שהם יבחרו בו בתור חבר הוא האדם הזה, ולו לפחות שניים ובאופן טיפוסי - יותר חברים. וזה קורה בכל צומת הנמצאת בקצה הרשת. ולמעשה, זה קורה בכל הרשת, ככל שמתקדמים פנימה. כל אחד שתבחרו, כאשר הם מציעים מועמד אקראי.. כאשר אדם אקראי מציע חבר שלו אנו מתקרבים לכיוון מרכז הרשת. אז, חשבנו שנוכל להשתמש ברעיון זה על מנת ללמוד האם אנו יכולים לחזות תופעות בתוך רשתות. מאחר ועכשיו, עם הרעיון הזה אנו יכולים לקחת קבוצה אקראית של אנשים, לבקש מהם להציע את חבריהם אנשים אלו יהיו יותר מרכזיים, ונוכל לעשות זאת ללא הצורך למפות את הרשת כולה.
And we tested this idea with an outbreak of H1N1 flu at Harvard College in the fall and winter of 2009, just a few months ago. We took 1,300 randomly selected undergraduates, we had them nominate their friends, and we followed both the random students and their friends daily in time to see whether or not they had the flu epidemic. And we did this passively by looking at whether or not they'd gone to university health services. And also, we had them [actively] email us a couple of times a week. Exactly what we predicted happened. So the random group is in the red line. The epidemic in the friends group has shifted to the left, over here. And the difference in the two is 16 days. By monitoring the friends group, we could get 16 days advance warning of an impending epidemic in this human population.
בדקנו את הרעיון הזה עם התפרצות של שפעת H1N1 בקולג' הרווארד בסתיו וחורף של 2009, לפני מספר חודשים בלבד. לקחנו 1300 סטודנטים אקראיים לתואר ראשון, ביקשנו מהם להציע חבר אחד ועקבנו אחריהם ואחרי החברים שבחרו יום אחר יום על מנת לבדוק האם הם נדבקו במגפת השפעת. ועשינו זאת באופן פאסיבי, על ידי בדיקה האם הם הלכו לשירותי הרפואה של האוניברסיטה ובנוסף, ביקשנו מהם לשלוח לנו דוא"ל פעמיים בשבוע. קרה בדיוק מה שניבאנו. אז הקבוצה האקראית מסומנת בקו אדום. המגפה בקבוצת החברים- בהיסט לשמאל, כאן. וההבדל בין השתיים הוא 16 ימים. על ידי ניטור קבוצת החברים, היינו מסוגלים לקבל התראה מראש של 16 ימים למגפה שבדרך באוכלוסייה האנושית הזו.
Now, in addition to that, if you were an analyst who was trying to study an epidemic or to predict the adoption of a product, for example, what you could do is you could pick a random sample of the population, also have them nominate their friends and follow the friends and follow both the randoms and the friends. Among the friends, the first evidence you saw of a blip above zero in adoption of the innovation, for example, would be evidence of an impending epidemic. Or you could see the first time the two curves diverged, as shown on the left. When did the randoms -- when did the friends take off and leave the randoms, and [when did] their curve start shifting? And that, as indicated by the white line, occurred 46 days before the peak of the epidemic. So this would be a technique whereby we could get more than a month-and-a-half warning about a flu epidemic in a particular population.
ובנוסף לזה, אם היית אנליסט שמנסה לחקור מגפה או לחזות את האימוץ של מוצר, לדוגמה, מה שהייתם יכולים לעשות הוא לבחור מדגם אקראי של האוכלוסיה, שיבחרו מיהם חבריהם ולעקוב אחרי החברים, ולעקוב אחרי המדגם האקראי ואחרי החברים. בקרב החברים, הראיה הראשונה שראיתם של נקודה מעל האפס באימוץ של ההמצאה, לדוגמה, יהווה ראיה למגיפה ממשמשת ובאה. או שתוכלו לראות את הפעם הראשונה בה שתי עקומות מתפצלות, כפי שרואים משמאל. מתי האקראיים...מתי החברים המריאו והשאירו את האקראיים מאחור, ו[מתי] העקומה שלהם החלה לזוז? וזה, כפי שהראה הקו הלבן, קרה 46 ימים לפני שיא המחלה. כך שזו יכולה להיות טכניקה שבעזרתם נוכל לקבל התראה של יותר מחודש וחצי על מגיפת שפעת באוכלוסיה מסוימת.
I should say that how far advanced a notice one might get about something depends on a host of factors. It could depend on the nature of the pathogen -- different pathogens, using this technique, you'd get different warning -- or other phenomena that are spreading, or frankly, on the structure of the human network. Now in our case, although it wasn't necessary, we could also actually map the network of the students.
עלי לומר שההתראה שאדם עשוי לקבל לגבי משהו תלויה בהרבה מאוד גורמים. היא יכולה להיות תלויה בטבעו של הפתוגן -- פתוגנים שונים, בשימוש בטכניקה זו, תקבלו התראות שונות -- או תופעות מתפשטות אחרות, או, בכנות, על מבנה הרשת האנושית. עכשיו, במקרה שלנו, אף-על-פי שזה לא היה נחוץ יכולנו למעשה למפות את רשת הסטודנטים.
So, this is a map of 714 students and their friendship ties. And in a minute now, I'm going to put this map into motion. We're going to take daily cuts through the network for 120 days. The red dots are going to be cases of the flu, and the yellow dots are going to be friends of the people with the flu. And the size of the dots is going to be proportional to how many of their friends have the flu. So bigger dots mean more of your friends have the flu. And if you look at this image -- here we are now in September the 13th -- you're going to see a few cases light up. You're going to see kind of blooming of the flu in the middle. Here we are on October the 19th. The slope of the epidemic curve is approaching now, in November. Bang, bang, bang, bang, bang -- you're going to see lots of blooming in the middle, and then you're going to see a sort of leveling off, fewer and fewer cases towards the end of December. And this type of a visualization can show that epidemics like this take root and affect central individuals first, before they affect others.
אז, זו מפה של 714 סטודנטים וקשרי החברות שלהם. ובעוד דקה עכשיו, אני עומד להכניס את המפה זו לתנועה. אנחנו הולכים לקחת תמונות מצב יומיות דרך הרשת, במשך 120 ימים. הנקודות האדומות עומדות להיות מקרי שפעת, והנקודות הצהובות עומדות להיות חברים של אנשים עם שפעת. וגודל הנקודות עומד להיות פרופורציונלי למספר חבריהם החולים. כך שנקודות גדולות יותר אומרות שליותר מחבריך יש שפעת. ואם תסתכלו בתמונה זו -- כאן אנחנו עכשיו ב-13 בספטמבר -- תוכלו לראות כמה מקרים נדלקים. אתם עומדים לראות סוג של שגשוג של השפעת במרכז. כאן אנו ב-19 באוקטובר השיפוע של עקומת המגיפה מתקרב עכשיו, בנובמבר. בום, בום, בום, בום, בום, אתם עומדים לראות הרבה שגשוג באמצע, ואז אתם הולכים לראות סוג של התיישרות, מקרים מעטים יותר ויותר לקראת סוף דצמבר. וסוג כזה של ויזואליזציה יכול להראות שמגיפות כמו זו משתרשות אצל ומשפיעות על פרטים מרכזיים תחילה, לפני שהן משפיעות על אחרים.
Now, as I've been suggesting, this method is not restricted to germs, but actually to anything that spreads in populations. Information spreads in populations, norms can spread in populations, behaviors can spread in populations. And by behaviors, I can mean things like criminal behavior, or voting behavior, or health care behavior, like smoking, or vaccination, or product adoption, or other kinds of behaviors that relate to interpersonal influence. If I'm likely to do something that affects others around me, this technique can get early warning or early detection about the adoption within the population. The key thing is that for it to work, there has to be interpersonal influence. It cannot be because of some broadcast mechanism affecting everyone uniformly.
עכשיו, כפי שהצעתי, שיטה זו אינה מוגבלת לחיידקים, אלא למעשה לכל דבר שמתפשט באוכלוסיות. מידע מתפשט באוכלוסיות. נורמות יכולות להתפשט באוכלוסיות. צורות התנהגות יכולות להתפשט באוכלוסיות. ובצורות התנהגות, אני יכול להתכוון לדברים כמו התנהגות פושעת, או התנהגות של הצבעה, או התנהגות שקשורה בבריאות, כמו עישון, או חיסון, או אימוץ מוצרים, או סוגים אחרים של התנהגות הקשורים להשפעה בין-אישית. אם סביר שאעשה משהו שמשפיע על אחרים מסביבי, טכניקה זו יכולה לתת התראה מוקדמת, או איתור מוקדם, על רמת האימוץ באוכלוסיה. הדבר החשוב הוא, על מנת שזה יעבוד, חייבת להיות השפעה בין-אישית. זה לא יכול לקרות בגלל סוג כלשהו של מנגנון שידור המשפיע על כולם באופן אחיד.
Now the same insights can also be exploited -- with respect to networks -- can also be exploited in other ways, for example, in the use of targeting specific people for interventions. So, for example, most of you are probably familiar with the notion of herd immunity. So, if we have a population of a thousand people, and we want to make the population immune to a pathogen, we don't have to immunize every single person. If we immunize 960 of them, it's as if we had immunized a hundred [percent] of them. Because even if one or two of the non-immune people gets infected, there's no one for them to infect. They are surrounded by immunized people. So 96 percent is as good as 100 percent. Well, some other scientists have estimated what would happen if you took a 30 percent random sample of these 1000 people, 300 people and immunized them. Would you get any population-level immunity? And the answer is no. But if you took this 30 percent, these 300 people and had them nominate their friends and took the same number of vaccine doses and vaccinated the friends of the 300 -- the 300 friends -- you can get the same level of herd immunity as if you had vaccinated 96 percent of the population at a much greater efficiency, with a strict budget constraint.
כעת אותן התובנות יכולות להיות מנוצלות -- בהתיחס לרשתות -- יכולות גם להיות מנוצלות בדרכים אחרות, לדוגמה, בשימוש בכיוון אל אנשים ספציפיים להתערבויות (interventions). כך, למשל, רובכם קרוב לוודאי מכירים את מושג חסינות העדר. כך, אם יש לנו אוכלוסיה של אלף איש, ואנו רוצים לעשות אוכלוסיה זו חסינה לפתוגן, איננו חייבים לחסן כל אדם ואדם. אם נחסן 960 מהם כאילו חיסנו מאה [אחוזים] מהם. מכיון שאפילו אם אחד או שניים מהאנשים הלא מחוסנים נדבק, אין להם איש להדביק. הם מוקפים באנשים מחוסנים. כך ש-96 אחוזים טובים כמו 100 אחוזים. ובכן, מדענים מסוימים אחרים אמדו מה יקרה אם תיקחו מדגם אקראי של 30 אחוזים מאלף האנשים האלו, 300 אנשים, ותחסנו אותם. האם תקבלו חסינות ברמת האוכלוסיה? והתשובה היא לא. אבל אם הייתם לוקחים את שלושים האחוזים האלו, 300 האנשים האלה, והייתם מבקשים מהם להעמיד לבחירה את חבריהם והייתם לוקחים אותו מספר של מנות חיסון והייתם מחסנים את חבריהם של ה-300, 300 החברים, תוכלו לקבל אותה רמה של חסינות עדרית כאילו חיסנתם 96 אחוזים של האוכלוסיה ביעילות גדולה יותר, תחת מגבלה תקציבית נוקשה
And similar ideas can be used, for instance, to target distribution of things like bed nets in the developing world. If we could understand the structure of networks in villages, we could target to whom to give the interventions to foster these kinds of spreads. Or, frankly, for advertising with all kinds of products. If we could understand how to target, it could affect the efficiency of what we're trying to achieve. And in fact, we can use data from all kinds of sources nowadays [to do this].
וניתן להשתמש ברעיונות דומים, לדוגמה, כדי לכוון הפצה של דברים כמו כילות בעולם המתפתח. אם נוכל להבין את מבנה הרשתות בכפרים, נוכל לכוון אצל מי כדאי להתערב על מנת לעודד התפשטויות מהסוגים האלה או, בכנות, לפרסום כל סוגי המוצרים. אם נוכל להבין כיצד לכוון, זה יוכל להשפיע על היעילות של מה שאנו מנסים להשיג. ולמעשה, אנו יכולים להשתמש בנתונים ממגוון סוגי מקורות כיום [על מנת לעשות זאת]
This is a map of eight million phone users in a European country. Every dot is a person, and every line represents a volume of calls between the people. And we can use such data, that's being passively obtained, to map these whole countries and understand who is located where within the network. Without actually having to query them at all, we can get this kind of a structural insight. And other sources of information, as you're no doubt aware are available about such features, from email interactions, online interactions, online social networks and so forth. And in fact, we are in the era of what I would call "massive-passive" data collection efforts. They're all kinds of ways we can use massively collected data to create sensor networks to follow the population, understand what's happening in the population, and intervene in the population for the better. Because these new technologies tell us not just who is talking to whom, but where everyone is, and what they're thinking based on what they're uploading on the Internet, and what they're buying based on their purchases. And all this administrative data can be pulled together and processed to understand human behavior in a way we never could before.
זוהי מפה של שמונה מיליון משתמשי טלפון בארץ אירופית. כל נקודה היא אדם, וכל קו מייצג את נפח השיחות בין האנשים. ואנו יכולים להשתמש בנתונים כאלה, שהושגו בצורה פסיבית, כדי למפות ארצות שלמות ולהבין מי ממוקם היכן בתוך הרשת. בלי למעשה לשאול אותם כלל, נוכל לקבל סוג כזה של תובנה מבנית. ומקורות אחרים של אינפורמציה, כפי שאתם מודעים ללא ספק, זמינים בנוגע למאפיינים כאלה, מאינטראקציות דוא"ל, אינטראקציות מקוונות, רשתות חברתיות מקוונות, וכך הלאה. ולמעשה, אנחנו בתקופה של מה שאקרא מאמצי איסוף נתונים "מאסיביים-פסיביים". אלו הן מגוון דרכים שבהן אנחנו יכולים להשתמש בנתונים שנאספו בצורה מאסיבית כדי ליצור רשתות חיישנים לעקוב אחרי האוכלוסיה, להבין מה קורה באוכלוסיה, ולהתערב לטובה באוכלוסיה. מכיון שהטכנולוגיות החדשות האלו אומרות לנו לא רק מי מדבר עם מי, אלא איפה נמצא כל אחד, ומה הם חושבים בהתבסס על מה הם מעלים לאינטרנט, ומה הם קונים בהתבסס על רכישותיהם. וכל הנתונים המנהליים האלו יכולים להיאסף יחד ולהיות מעובדים על מנת להבין התנהגות אנושית באופן שמעולם לא יכולנו לפני כן.
So, for example, we could use truckers' purchases of fuel. So the truckers are just going about their business, and they're buying fuel. And we see a blip up in the truckers' purchases of fuel, and we know that a recession is about to end. Or we can monitor the velocity with which people are moving with their phones on a highway, and the phone company can see, as the velocity is slowing down, that there's a traffic jam. And they can feed that information back to their subscribers, but only to their subscribers on the same highway located behind the traffic jam! Or we can monitor doctors prescribing behaviors, passively, and see how the diffusion of innovation with pharmaceuticals occurs within [networks of] doctors. Or again, we can monitor purchasing behavior in people and watch how these types of phenomena can diffuse within human populations.
כך, לדוגמה, נוכל להשתמש ברכישות הדלק של נהגי משאיות. הנהגים האלו עוסקים בענייניהם, והם קונים דלק. ואנו רואים עליה ברכישות הדלק של נהגי משאיות, ואנו יודעים שהמיתון עומד להסתיים. או אנו יכולים לנטר את המהירות בה אנשים נעים עם הטלפונים שלהם בכביש ראשי, וחברת הטלפון יכולה לראות, כשהמהירות מאטה, שיש פקק תנועה. והם יכולים להזין את האינפורמציה הזו בחזרה למנויים שלהם, אבל רק למנויים שלהם באותו כביש ראשי הממוקמים מאחורי פקק התנועה! או שאנו יכולים לנטר את התנהגויות רישום המרשמים של רופאים, באופן פסיבי, ולראות כיצד התפשטות של חידושים תרופתיים קורית בין [רשת של] רופאים. או שוב, אנו יכולים לנטר התנהגות רכישה של אנשים ולצפות כיצד סוגים כאלה של תופעות יכולים להתפשט באוכלוסיות אנושיות.
And there are three ways, I think, that these massive-passive data can be used. One is fully passive, like I just described -- as in, for instance, the trucker example, where we don't actually intervene in the population in any way. One is quasi-active, like the flu example I gave, where we get some people to nominate their friends and then passively monitor their friends -- do they have the flu, or not? -- and then get warning. Or another example would be, if you're a phone company, you figure out who's central in the network and you ask those people, "Look, will you just text us your fever every day? Just text us your temperature." And collect vast amounts of information about people's temperature, but from centrally located individuals. And be able, on a large scale, to monitor an impending epidemic with very minimal input from people. Or, finally, it can be more fully active -- as I know subsequent speakers will also talk about today -- where people might globally participate in wikis, or photographing, or monitoring elections, and upload information in a way that allows us to pool information in order to understand social processes and social phenomena.
ויש שלוש דרכים, אני חושב, של שימוש בנתונים המאסיביים-פאסיביים האלה. אחת היא פאסיבית לחלוטין, כמו שרק תיארתי -- כמו, לדוגמה, אצל נהגי המשאיות, שם אנחנו לא מתערבים למעשה באוכלוסייה בדרך כלשהי. אחת היא מעין-אקטיבית, כמו בדוגמת השפעת שנתתי, שם אנו מבקשים מאנשים מסויימים להציע את חבריהם ואז מנטרים את החברים באופן פסיבי -- האם הם חולים בשפעת, או לא? -- ואז מקבלים התראה. או דוגמה אחרת יכולה להיות, אם אתם חברת טלפון, אתם תבינו מי מרכזי ברשת, ותבקשו מהאנשים האלו, "תראו, האם פשוט תשלחו לנו טקסט עם החום שלכם מדי יום? פשוט תשלחו לנו טקסט עם הטמפרטורה שלכם." ולאסוף כמויות עצומות של אינפורמציה על הטמפרטורה של אנשים, מפרטים הממוקמים במרכז. ולהיות מסוגלים, בקנה מידה גדול, לנטר מגיפה מתקרבת עם קלט מועט מאוד מאנשים. או, לבסוף, זה יכול להיות אקטיבי יותר -- כפי שאני יודע שגם הדוברים הבאים ידברו על האפשרות היום -- שאנשים עשויים להשתתף גלובלית בויקי, או צילום, או ניטור בחירות, ולהעלות את האינפורמציה בדרך שתרשה לנו לאגור אינפורמציה על מנת להבין תהליכים חברתיים ותופעות חברתיות.
In fact, the availability of these data, I think, heralds a kind of new era of what I and others would like to call "computational social science." It's sort of like when Galileo invented -- or, didn't invent -- came to use a telescope and could see the heavens in a new way, or Leeuwenhoek became aware of the microscope -- or actually invented -- and could see biology in a new way. But now we have access to these kinds of data that allow us to understand social processes and social phenomena in an entirely new way that was never before possible. And with this science, we can understand how exactly the whole comes to be greater than the sum of its parts. And actually, we can use these insights to improve society and improve human well-being.
למעשה, זמינותם של הנתונים האלו, אני חושב, מכריזה על סוג של תקופה חדשה שאני ואחרים רוצים לקרוא לה "מדע חברתי חישובי." זה בערך כמו כאשר גלילאו המציא -- או, לא המציא -- התחיל להשתמש בטלסקופ והיה יכול לראות את הרקיע בצורה חדשה או כאשר לייבנהוק הפך מודע למיקרוסקופ -- או למעשה המציא -- והיה מסוגל לראות ביולוגיה בדרך חדשה. אך כעת יש לנו גישה לסוגי נתונים כאלה שמאפשרים לנו להבין תהליכים חברתיים ותופעות חברתיות בדרך חדשה לחלוטין שמעולם לא היתה אפשרית לפני כן ובעזרת מדע זה, אנו יכולים להבין בדיוק כיצד השלם הופך להיות גדול יותר מסכום חלקיו. ולמעשה, אנו יכולים להשתמש בתובנות אלו על מנת לשפר את החברה ולשפר את הרווחה האנושית.
Thank you.
תודה לכם