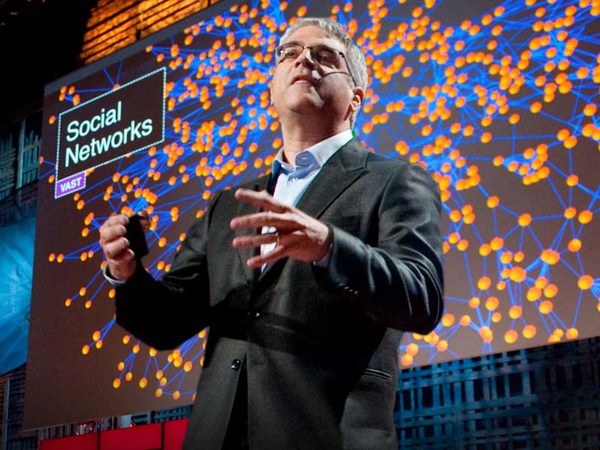
For the last 10 years, I've been spending my time trying to figure out how and why human beings assemble themselves into social networks. And the kind of social network I'm talking about is not the recent online variety, but rather, the kind of social networks that human beings have been assembling for hundreds of thousands of years, ever since we emerged from the African savannah. So, I form friendships and co-worker and sibling and relative relationships with other people who in turn have similar relationships with other people. And this spreads on out endlessly into a distance. And you get a network that looks like this. Every dot is a person. Every line between them is a relationship between two people -- different kinds of relationships. And you can get this kind of vast fabric of humanity, in which we're all embedded.
Durante los últimos 10 años he tratado de dar con la forma y la razón por la que los seres humanos se congregan en redes sociales. Y el tipo de red social de la que hablo no es la reciente variedad virtual sino más bien del tipo de redes sociales en las que los humanos nos hemos congregado durante cientos y miles de años desde que aparecimos en la sabana africana. Así, entablo amistades y relaciones laborales, y relaciones fraternales y de parentesco con otra gente, quienes a su vez tienen relaciones con otras personas. Y esto se extiende indefinidamente en la distancia. Y se tiene una red que se parece a esto. Cada punto es una persona. Cada línea entre puntos es una relación entre dos personas... distintos tipos de relaciones. Así se obtiene esta suerte de tejido de humanidad en el que todos estamos inmersos.
And my colleague, James Fowler and I have been studying for quite sometime what are the mathematical, social, biological and psychological rules that govern how these networks are assembled and what are the similar rules that govern how they operate, how they affect our lives. But recently, we've been wondering whether it might be possible to take advantage of this insight, to actually find ways to improve the world, to do something better, to actually fix things, not just understand things. So one of the first things we thought we would tackle would be how we go about predicting epidemics.
Con mi colega James Fowler hemos estado estudiando durante bastante tiempo las reglas matemáticas, sociales, biológicas y psicológicas que gobiernan la forma de ensamblaje de estas redes y las reglas similares que gobiernan la forma en que operan, en que afectan nuestras vidas. Y hace poco nos preguntábamos si sería posible sacar ventaja de este conocimiento para encontrar maneras de mejorar el mundo, de hacer algo mejor, para solucionar las cosas y no sólo para entenderlas. Uno de los primeros temas que pensamos abordar era la forma de predecir epidemias.
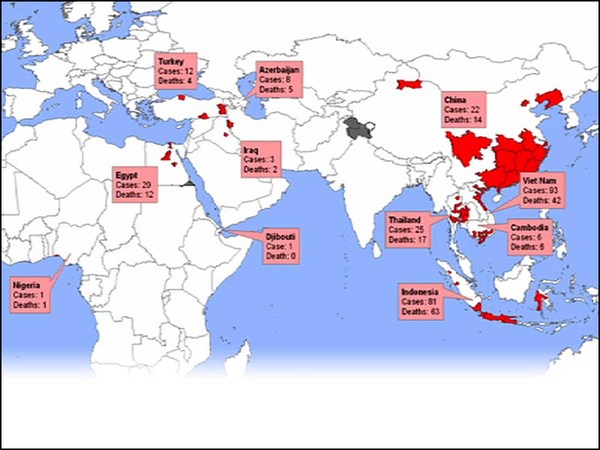
And the current state of the art in predicting an epidemic -- if you're the CDC or some other national body -- is to sit in the middle where you are and collect data from physicians and laboratories in the field that report the prevalence or the incidence of certain conditions. So, so and so patients have been diagnosed with something, or other patients have been diagnosed, and all these data are fed into a central repository, with some delay. And if everything goes smoothly, one to two weeks from now you'll know where the epidemic was today. And actually, about a year or so ago, there was this promulgation of the idea of Google Flu Trends, with respect to the flu, where by looking at people's searching behavior today, we could know where the flu -- what the status of the epidemic was today, what's the prevalence of the epidemic today.
Y la técnica actual para predecir epidemias -en el CDC o algún otro organismo nacional- es sentarse en el lugar que uno esté y recolectar datos de médicos y laboratorios en el terreno que informen de la prevalencia o la incidencia de ciertas condiciones. Pacientes así, así y así han sido diagnosticados [por aquí] u otros pacientes lo han sido [por allí] y todos estos datos van a un repositorio central con cierta demora. Y si todo va bien, en una o dos semanas, uno sabrá en qué estado estaba hoy la epidemia. En realidad hace cosa de un año se hizo conocida esta noción de tendencia gripal en Google, en relación a la gripe, según la cual mirando el comportamiento de búsqueda hoy podíamos saber de la gripe... el estado actual de la epidemia, la prevalecencia actual de la epidemia.
But what I'd like to show you today is a means by which we might get not just rapid warning about an epidemic, but also actually early detection of an epidemic. And, in fact, this idea can be used not just to predict epidemics of germs, but also to predict epidemics of all sorts of kinds. For example, anything that spreads by a form of social contagion could be understood in this way, from abstract ideas on the left like patriotism, or altruism, or religion to practices like dieting behavior, or book purchasing, or drinking, or bicycle-helmet [and] other safety practices, or products that people might buy, purchases of electronic goods, anything in which there's kind of an interpersonal spread. A kind of a diffusion of innovation could be understood and predicted by the mechanism I'm going to show you now.
Pero lo que hoy quiero mostrarles es un medio por el cual podríamos tener no sólo alertas rápidas de una epidemia sino también detección temprana de la misma. Y, de hecho, esta idea puede usarse no sólo para predecir epidemias de gérmenes sino también para predecir epidemias de todo tipo. Por ejemplo, cualquier cosa que se propague por contagio social puede ser comprendida de este modo, desde las ideas de la izquierda como el patriotismo, el altruismo o la religión hasta prácticas como las dietas o la compra de libros bebidas, cascos de bicicleta [y] otras medidas de seguridad; o productos que la gente podría adquirir, la compra de artículos electrónicos, cualquier cosa en la que haya propagación interpersonal. Una especie de difusión de la innovación podría ser entendida y predicha con el mecanismo que ahora voy a mostrarles.
So, as all of you probably know, the classic way of thinking about this is the diffusion-of-innovation, or the adoption curve. So here on the Y-axis, we have the percent of the people affected, and on the X-axis, we have time. And at the very beginning, not too many people are affected, and you get this classic sigmoidal, or S-shaped, curve. And the reason for this shape is that at the very beginning, let's say one or two people are infected, or affected by the thing and then they affect, or infect, two people, who in turn affect four, eight, 16 and so forth, and you get the epidemic growth phase of the curve. And eventually, you saturate the population. There are fewer and fewer people who are still available that you might infect, and then you get the plateau of the curve, and you get this classic sigmoidal curve. And this holds for germs, ideas, product adoption, behaviors, and the like. But things don't just diffuse in human populations at random. They actually diffuse through networks. Because, as I said, we live our lives in networks, and these networks have a particular kind of a structure.
Así, como todos probablemente saben, la manera clásica de pensar en esto es la "difusión de la innovación" o "curva de adopción". Aquí en el eje Y tenemos el porcentaje de personas afectadas y en el eje X tenemos el tiempo. Al principio no hay demasiadas personas afectadas, y se tiene esta curva sigmoidea clásica o curva en forma de S. La razón de esta forma es que muy al principio digamos que una o dos personas están afectadas o infectadas y luego ellos afectan, o infectan, a dos personas que a su vez afectan a 4, 8, 16, etc., y se obtiene la fase de crecimiento de la epidemia en la curva. Y, finalmente, se satura la población. Hay cada vez menos personas que todavía pueden ser infectadas y entonces se tiene la meseta de la curva, y se obtiene esta curva sigmoidea clásica. Y esto vale para gérmenes, ideas, adopción de productos, comportamientos y similares. Pero las cosas no se difunden aleatoriamente en las poblaciones humanas. Se difunden en redes. Porque, como dije, vivimos nuestras vidas en redes y estas redes tienen un tipo particular de estructura.
Now if you look at a network like this -- this is 105 people. And the lines represent -- the dots are the people, and the lines represent friendship relationships. You might see that people occupy different locations within the network. And there are different kinds of relationships between the people. You could have friendship relationships, sibling relationships, spousal relationships, co-worker relationships, neighbor relationships and the like. And different sorts of things spread across different sorts of ties. For instance, sexually transmitted diseases will spread across sexual ties. Or, for instance, people's smoking behavior might be influenced by their friends. Or their altruistic or their charitable giving behavior might be influenced by their coworkers, or by their neighbors. But not all positions in the network are the same.
Ahora, si vemos una red como ésta... Ésta tiene 105 personas. Y las líneas representan... los puntos son las personas y las líneas las relaciones de amistad. Puede verse que las personas ocupan distintas ubicaciones en la red. Y hay distintos tipos de relaciones entre las personas. Pueden darse relaciones de amistad, relaciones fraternales, relaciones maritales, relaciones laborales, relaciones vecinales, etc. Y distintos tipos de cosas se difunden por diferentes tipos de lazos. Por ejemplo, las enfermedades de transmisión sexual se esparcirán por los vínculos sexuales. O, por ejemplo, el hábito de fumar podría ser influencia de los amigos. O el altruismo y las donaciones caritativas podrían estar influenciados por los compañeros de trabajo, o por los vecinos. Pero no todas las ubicaciones de la red son iguales.
So if you look at this, you might immediately grasp that different people have different numbers of connections. Some people have one connection, some have two, some have six, some have 10 connections. And this is called the "degree" of a node, or the number of connections that a node has. But in addition, there's something else. So, if you look at nodes A and B, they both have six connections. But if you can see this image [of the network] from a bird's eye view, you can appreciate that there's something very different about nodes A and B. So, let me ask you this -- I can cultivate this intuition by asking a question -- who would you rather be if a deadly germ was spreading through the network, A or B? (Audience: B.) Nicholas Christakis: B, it's obvious. B is located on the edge of the network. Now, who would you rather be if a juicy piece of gossip were spreading through the network? A. And you have an immediate appreciation that A is going to be more likely to get the thing that's spreading and to get it sooner by virtue of their structural location within the network. A, in fact, is more central, and this can be formalized mathematically. So, if we want to track something that was spreading through a network, what we ideally would like to do is to set up sensors on the central individuals within the network, including node A, monitor those people that are right there in the middle of the network, and somehow get an early detection of whatever it is that is spreading through the network.
Así, si miran esto van a captar de inmediato que diferentes personas tienen distinta cantidad de conexiones. Algunas personas tienen 1 conexión, algunas tienen 2, algunas tienen 6, algunas tienen 10. Y esto se llama el "grado" de un nodo o la cantidad de conexiones que tiene un nodo. Pero hay algo más. Si uno mira los nodos A y B, ambos tienen 6 conexiones. Pero si uno mira esta imagen [de la red] a vista de pájaro, puede apreciar que hay algo muy diferente entre los nodos A y B. Déjenme preguntarles esto, puedo fomentar esta intuición haciendo una pregunta: ¿Quién les gustaría ser si un germen se esparciera por la red, A o B? (Audiencia: B) Nicholas Christakis: B, obviamente. B está ubicado al borde de la red. Ahora, ¿quién les gustaría ser si se propagara por la red un chisme jugoso? A. Y uno tiene una apreciación inmediata de que va a ser más probable que A dé primero con lo que se está propagando en virtud de su ubicación estructural dentro de la red. A, de hecho, es más central y esto se puede formalizar matemáticamente. Por lo tanto, si quisiéramos seguir algo que se está propagando por una red, lo ideal sería poner sensores en los individuos del centro de la red, incluyendo el nodo A, y monitorear a esas personas que están justo en el centro de la red, para, de algún modo, detectar en forma temprana lo que sea que se esté difundiendo por la red.
So if you saw them contract a germ or a piece of information, you would know that, soon enough, everybody was about to contract this germ or this piece of information. And this would be much better than monitoring six randomly chosen people, without reference to the structure of the population. And in fact, if you could do that, what you would see is something like this. On the left-hand panel, again, we have the S-shaped curve of adoption. In the dotted red line, we show what the adoption would be in the random people, and in the left-hand line, shifted to the left, we show what the adoption would be in the central individuals within the network. On the Y-axis is the cumulative instances of contagion, and on the X-axis is the time. And on the right-hand side, we show the same data, but here with daily incidence. And what we show here is -- like, here -- very few people are affected, more and more and more and up to here, and here's the peak of the epidemic. But shifted to the left is what's occurring in the central individuals. And this difference in time between the two is the early detection, the early warning we can get, about an impending epidemic in the human population.
Así, si los viéramos contraer un germen o una información uno sabría, muy pronto, que todos están por contraer el germen o por enterarse de esa información. Y esto sería mucho mejor que monitorear a 6 personas elegidas al azar sin hacer referencia a la estructura de la población. Y, de hecho, si uno pudiera hacer eso lo que vería sería algo como esto. De nuevo, en el panel de la izquierda tenemos la curva de adopción en forma de S. En la línea roja punteada mostramos cómo sería la adopción en las personas elegidas al azar y en la línea de la izquierda, desplazada a la izquierda, mostramos cómo sería la adopción en los individuos del centro de la red. En el eje Y están las instancias acumulativas de contagio y en el eje X está el tiempo. Y a la derecha, mostramos los mismos datos, pero aquí con incidencia diaria. Y lo que aquí mostramos, como en este caso, es que hay pocas personas afectadas, cada vez más y más hasta llegar aquí, y aquí es el pico de la epidemia. Pero desplazado a la izquierda se ve lo que ocurre con los individuos del centro. Y esta diferencia en tiempo entre los dos es la detección temprana, la alerta temprana que se dispara sobre una epidemia inminente en la población humana.
The problem, however, is that mapping human social networks is not always possible. It can be expensive, not feasible, unethical, or, frankly, just not possible to do such a thing. So, how can we figure out who the central people are in a network without actually mapping the network? What we came up with was an idea to exploit an old fact, or a known fact, about social networks, which goes like this: Do you know that your friends have more friends than you do? Your friends have more friends than you do, and this is known as the friendship paradox. Imagine a very popular person in the social network -- like a party host who has hundreds of friends -- and a misanthrope who has just one friend, and you pick someone at random from the population; they were much more likely to know the party host. And if they nominate the party host as their friend, that party host has a hundred friends, therefore, has more friends than they do. And this, in essence, is what's known as the friendship paradox. The friends of randomly chosen people have higher degree, and are more central than the random people themselves.
El problema, sin embargo, es que el mapeo de redes sociales humanas no siempre es posible. Puede que sea caro, [muy difícil], antiético, o, francamente, imposible de realizar. Entonces: ¿cómo podemos averiguar cuáles son las personas centrales de una red sin, de hecho, mapear la red? Y surgió la idea de explotar un hecho muy antiguo o un hecho conocido de las redes sociales que dice así: ¿sabías que tus amigos tienen más amigos que tú? Tus amigos tienen más amigos que tú. Y esto se conoce como la paradoja de la amistad. Imaginen una persona muy popular en la red social -como un anfitrión de una fiesta con cientos de amigos- y un misántropo que tiene un solo amigo; si uno toma una persona al azar, es mucho más probable que conozca al anfitrión. Y si señala al anfitrión como amigo, ese anfitrión tiene cientos de amigos, por lo tanto tiene más amigos que uno. Y esto, en esencia, es lo que se conoce como la paradoja de la amistad. Los amigos de las personas elegidas al azar tienen más alto grado y están más al centro que la propia gente elegida al azar.
And you can get an intuitive appreciation for this if you imagine just the people at the perimeter of the network. If you pick this person, the only friend they have to nominate is this person, who, by construction, must have at least two and typically more friends. And that happens at every peripheral node. And in fact, it happens throughout the network as you move in, everyone you pick, when they nominate a random -- when a random person nominates a friend of theirs, you move closer to the center of the network. So, we thought we would exploit this idea in order to study whether we could predict phenomena within networks. Because now, with this idea we can take a random sample of people, have them nominate their friends, those friends would be more central, and we could do this without having to map the network.
Y uno puede hacerse una idea intuitiva de esto si piensa en la gente del perímetro de la red. Si uno elige a esta persona el único amigo que tendrá para elegir es esta persona, quien, por construcción, debe tener al menos dos o, normalmente, más amigos. Y eso sucede en cada nodo periférico. De hecho, sucede en toda la red conforme uno se desplaza, cualquiera que elijamos, cuando nomine alguien al azar... cuando una persona al azar nomina a un amigo uno se mueve más cerca del centro de la red. Así, pensamos en explotar esta idea para estudiar si podíamos predecir fenómenos dentro de las redes. Porque ahora, con esta idea, podemos tomar una muestra aleatoria de gente, hacer que elijan a sus amigos, y esos amigos estarán más al centro, y podríamos hacer eso sin tener que mapear la red.
And we tested this idea with an outbreak of H1N1 flu at Harvard College in the fall and winter of 2009, just a few months ago. We took 1,300 randomly selected undergraduates, we had them nominate their friends, and we followed both the random students and their friends daily in time to see whether or not they had the flu epidemic. And we did this passively by looking at whether or not they'd gone to university health services. And also, we had them [actively] email us a couple of times a week. Exactly what we predicted happened. So the random group is in the red line. The epidemic in the friends group has shifted to the left, over here. And the difference in the two is 16 days. By monitoring the friends group, we could get 16 days advance warning of an impending epidemic in this human population.
Hemos probado esta idea con un brote de la gripe H1N1 en la universidad de Harvard en el otoño y el invierno de 2009, hace apenas unos meses. Tomamos 1.300 estudiantes seleccionados al azar, hicimos que elijan a sus amigos y seguimos a los estudiantes elegidos al azar y a sus amigos diariamente para ver si tenían o no la epidemia de gripe. Y lo hicimos pasivamente observando si habían ido a los servicios de salud universitarios. Les pedimos también que nos envíen un correo un par de veces por semana. Y sucedió exactamente lo que predijimos. El grupo aleatorio está en la línea roja. La epidemia en el grupo de amigos se desplazó a la izquierda, por aquí. Y la diferencia entre los dos es de 16 días. Monitoreando el grupo de amigos pudimos tener una alerta 16 días antes de una epidemia inminente en esta población humana.
Now, in addition to that, if you were an analyst who was trying to study an epidemic or to predict the adoption of a product, for example, what you could do is you could pick a random sample of the population, also have them nominate their friends and follow the friends and follow both the randoms and the friends. Among the friends, the first evidence you saw of a blip above zero in adoption of the innovation, for example, would be evidence of an impending epidemic. Or you could see the first time the two curves diverged, as shown on the left. When did the randoms -- when did the friends take off and leave the randoms, and [when did] their curve start shifting? And that, as indicated by the white line, occurred 46 days before the peak of the epidemic. So this would be a technique whereby we could get more than a month-and-a-half warning about a flu epidemic in a particular population.
Ahora, además de eso, si uno fuese un analista que trata de estudiar una epidemia o de predecir la adopción de un producto, por ejemplo, lo que podría hacer es tomar una muestra aleatoria de la población, pedirle que elijan a sus amigos y seguir a los amigos, y seguir tanto a los aleatorios como a los amigos. Entre los amigos, la primera evidencia de un salto sobre cero en la adopción de innovación, por ejemplo, sería la evidencia de una epidemia inminente. O uno podría ver la primera vez que divergen las dos curvas, como se muestra a la izquierda. ¿Cuándo los aleatorios... cuándo despegaron los amigos y dejaron a los aleatorios y su curva empezó a desplazarse? Y eso, como indica la línea blanca, se produjo 46 días antes del pico de la epidemia. Así que esta sería una técnica mediante la cual se podría alertar más de un mes y medio antes la epidemia de gripe en una población en particular.
I should say that how far advanced a notice one might get about something depends on a host of factors. It could depend on the nature of the pathogen -- different pathogens, using this technique, you'd get different warning -- or other phenomena that are spreading, or frankly, on the structure of the human network. Now in our case, although it wasn't necessary, we could also actually map the network of the students.
Debo decir que la antelación con la que puede conocerse una noticia depende de una serie de factores. Podría depender de la naturaleza del patógeno, distintos patógenos, usando esta técnica, se obtienen distintas alertas, u otros fenómenos que se están extendiendo o, francamente, de la estructura de la red humana. En nuestro caso, aunque no era necesario, pudimos, de hecho, mapear la red de estudiantes.
So, this is a map of 714 students and their friendship ties. And in a minute now, I'm going to put this map into motion. We're going to take daily cuts through the network for 120 days. The red dots are going to be cases of the flu, and the yellow dots are going to be friends of the people with the flu. And the size of the dots is going to be proportional to how many of their friends have the flu. So bigger dots mean more of your friends have the flu. And if you look at this image -- here we are now in September the 13th -- you're going to see a few cases light up. You're going to see kind of blooming of the flu in the middle. Here we are on October the 19th. The slope of the epidemic curve is approaching now, in November. Bang, bang, bang, bang, bang -- you're going to see lots of blooming in the middle, and then you're going to see a sort of leveling off, fewer and fewer cases towards the end of December. And this type of a visualization can show that epidemics like this take root and affect central individuals first, before they affect others.
Este es un mapeo de 714 estudiantes y sus vínculos de amistad. Y en un minuto voy a poner este mapeo en movimiento. Vamos a tomar cortes diarios de la red durante 120 días. Los puntos rojos van a ser casos de gripe y los puntos amarillos van a ser amigos de las personas con gripe. Y el tamaño de los puntos va a ser proporcional a la cantidad de amigos con gripe. Así, puntos más grandes significan más amigos con gripe. Y si miran esta imagen, aquí estamos en el 13 de septiembre, van a ver algunos casos iluminados. Van a ver una especie de florecimiento de la gripe en el medio. Aquí estamos el 19 de octubre. La pendiente de la curva de la epidemia se está acercando ahora, en noviembre. Bang, bang, bang, bang, van a ver un gran florecimiento en el medio, y luego van a ver una especie de nivelación, cada vez menos casos hasta fines de diciembre. Y este tipo de visualización puede mostrar que las epidemias como éstas echan raíces y afectan primero a los individuos del centro antes de afectar a otros.
Now, as I've been suggesting, this method is not restricted to germs, but actually to anything that spreads in populations. Information spreads in populations, norms can spread in populations, behaviors can spread in populations. And by behaviors, I can mean things like criminal behavior, or voting behavior, or health care behavior, like smoking, or vaccination, or product adoption, or other kinds of behaviors that relate to interpersonal influence. If I'm likely to do something that affects others around me, this technique can get early warning or early detection about the adoption within the population. The key thing is that for it to work, there has to be interpersonal influence. It cannot be because of some broadcast mechanism affecting everyone uniformly.
Ahora, como he estado sugiriendo, este método no se limita a los gérmenes, sino, en realidad, a cualquier cosa que se propague en la población. La información se propaga en la población. Las normas se propagan en la población. Los comportamientos pueden propagarse en la población. Y comportamiento puede significar comportamiento criminal o electoral, o del cuidado de la salud como el tabaco o las vacunas, o la adopción de productos u otro tipo de comportamiento relacionado con la influencia interpersonal. Si soy capaz de hacer algo que afecta a los demás a mi alrededor, esta técnica puede proporcionar una alerta o detección temprana sobre la adopción en la población. La clave es que, para que funcione, tiene que haber influencia interpersonal. No puede deberse a un mecanismo de difusión que afecte a todos por igual.
Now the same insights can also be exploited -- with respect to networks -- can also be exploited in other ways, for example, in the use of targeting specific people for interventions. So, for example, most of you are probably familiar with the notion of herd immunity. So, if we have a population of a thousand people, and we want to make the population immune to a pathogen, we don't have to immunize every single person. If we immunize 960 of them, it's as if we had immunized a hundred [percent] of them. Because even if one or two of the non-immune people gets infected, there's no one for them to infect. They are surrounded by immunized people. So 96 percent is as good as 100 percent. Well, some other scientists have estimated what would happen if you took a 30 percent random sample of these 1000 people, 300 people and immunized them. Would you get any population-level immunity? And the answer is no. But if you took this 30 percent, these 300 people and had them nominate their friends and took the same number of vaccine doses and vaccinated the friends of the 300 -- the 300 friends -- you can get the same level of herd immunity as if you had vaccinated 96 percent of the population at a much greater efficiency, with a strict budget constraint.
Ahora, los mismos conocimientos de las redes pueden ser explotados también de otras maneras por ejemplo, para seleccionar personas específicas para intervenciones. Muchos de Uds. están familiarizados probablemente con la noción de inmunidad de grupo. Así, si tenemos una población de mil personas y queremos hacer que la población sea inmune a un patógeno no tenemos que inmunizar a todos. Si inmunizamos a 960 de ellos es como si hubiéramos inmunizado al 100% de ellos. Porque incluso si una o dos de las personas no inmunes se infectan, no hay nadie a quien puedan infectar. Están rodeados de personas inmunizadas. Así que el 96% es tan bueno como el 100%. Bueno, algunos científicos han estimado qué pasaría si se toma una muestra aleatoria del 30% y de estas 1.000 personas se inmuniza a 300. ¿Se obtendría alguna inmunidad a nivel poblacional? Y la respuesta es no. Pero si uno toma este 30%, estas 300 personas, y hacemos que elijan a sus amigos y tomamos la misma cantidad de dosis de vacunas y vacunamos a los amigos de los 300, los 300 amigos, se obtiene el mismo nivel de inmunidad de grupo que si vacunáramos al 96% de la población con mucha mayor eficiencia y una restricción presupuestaria estricta.
And similar ideas can be used, for instance, to target distribution of things like bed nets in the developing world. If we could understand the structure of networks in villages, we could target to whom to give the interventions to foster these kinds of spreads. Or, frankly, for advertising with all kinds of products. If we could understand how to target, it could affect the efficiency of what we're trying to achieve. And in fact, we can use data from all kinds of sources nowadays [to do this].
Y pueden usarse ideas similares, por ejemplo, para enfocar la distribucion de cosas como mosquiteros en el mundo en desarrollo. Si pudiésemos identificar la estructura de las redes en los pueblos podríamos elegir a quién darle las intervenciones para fomentar este tipo de propagación. O bien, francamente, para publicitar todo tipo de productos. Si pudiéramos entender cómo seleccionar, eso podría afectar la eficiencia de lo que estamos tratando de lograr. Y, de hecho, podemos usar datos de todo tipo de fuentes hoy en día [para hacerlo].
This is a map of eight million phone users in a European country. Every dot is a person, and every line represents a volume of calls between the people. And we can use such data, that's being passively obtained, to map these whole countries and understand who is located where within the network. Without actually having to query them at all, we can get this kind of a structural insight. And other sources of information, as you're no doubt aware are available about such features, from email interactions, online interactions, online social networks and so forth. And in fact, we are in the era of what I would call "massive-passive" data collection efforts. They're all kinds of ways we can use massively collected data to create sensor networks to follow the population, understand what's happening in the population, and intervene in the population for the better. Because these new technologies tell us not just who is talking to whom, but where everyone is, and what they're thinking based on what they're uploading on the Internet, and what they're buying based on their purchases. And all this administrative data can be pulled together and processed to understand human behavior in a way we never could before.
Este es un mapeo de 8 millones de usuarios de teléfono en un país europeo. Cada punto es una persona, y cada línea representa un volumen de llamadas entre personas. Y podemos usar estos datos obtenidos de manera pasiva para mapear estos países enteros y comprender dónde se ubica cada quien en la red. Sin tener que interrogarlos en absoluto podemos obtener este tipo de conocimiento estructural. Y otras fuentes de información, que Uds. sin duda conocen, están disponibles a partir de las interacciones de correo electrónico, interacciones en línea, redes sociales virtuales, etc. Y, de hecho, estamos en la era de lo que llamaría esfuerzos de recolección de datos "masivo-pasivos". Hay todo tipo de maneras de recolectar datos en forma masiva para crear redes de sensores para seguir a la población y comprender lo que sucede en la población e intervenir en la población para mejor. Porque estas nuevas tecnologías nos dicen no sólo quién habla con quién sino dónde está cada uno y lo que están pensando en base a lo que están subiendo a internet, y lo que están consumiendo en base a sus compras. Y todos estos datos administrativos pueden juntarse y ser procesados para comprender el comportamiento humano en modos nunca antes posibles.
So, for example, we could use truckers' purchases of fuel. So the truckers are just going about their business, and they're buying fuel. And we see a blip up in the truckers' purchases of fuel, and we know that a recession is about to end. Or we can monitor the velocity with which people are moving with their phones on a highway, and the phone company can see, as the velocity is slowing down, that there's a traffic jam. And they can feed that information back to their subscribers, but only to their subscribers on the same highway located behind the traffic jam! Or we can monitor doctors prescribing behaviors, passively, and see how the diffusion of innovation with pharmaceuticals occurs within [networks of] doctors. Or again, we can monitor purchasing behavior in people and watch how these types of phenomena can diffuse within human populations.
Por ejemplo: podríamos usar las compras de combustible de transportistas. Los transportistas hacen lo suyo y compran combustible. Vemos una suba en la compra de combustible de los transportistas y sabemos que una recesión está por terminar. O podemos analizar la velocidad a la que se mueve la gente con sus celulares en la autopista y la compañía telefónica puede ver, conforme la velocidad disminuye, que hay un atasco de tráfico. Y se puede enviar esa información a los clientes, pero sólo a los clientes que están en esa misma autopista ubicados detrás del atasco. O podemos monitorear diagnósticos médicos, de forma pasiva, y ver la difusión de innovación en productos farmacéuticos en las redes de médicos. O, de vuelta, podemos seguir los hábitos de compra de la gente y observar cómo estos tipos de fenómenos pueden difundirse en las poblaciones humanas.
And there are three ways, I think, that these massive-passive data can be used. One is fully passive, like I just described -- as in, for instance, the trucker example, where we don't actually intervene in the population in any way. One is quasi-active, like the flu example I gave, where we get some people to nominate their friends and then passively monitor their friends -- do they have the flu, or not? -- and then get warning. Or another example would be, if you're a phone company, you figure out who's central in the network and you ask those people, "Look, will you just text us your fever every day? Just text us your temperature." And collect vast amounts of information about people's temperature, but from centrally located individuals. And be able, on a large scale, to monitor an impending epidemic with very minimal input from people. Or, finally, it can be more fully active -- as I know subsequent speakers will also talk about today -- where people might globally participate in wikis, or photographing, or monitoring elections, and upload information in a way that allows us to pool information in order to understand social processes and social phenomena.
Y creo que hay tres maneras en que pueden usarse estos datos masivo-pasivos. Una es totalmente pasiva como acabo de describir. Por ejemplo, el caso de los transportistas en el que no se interviene en la población de ningún modo. Otro es casi activo, como el ejemplo que di de la gripe, en el que pedimos a la gente que elija a sus amigos, y luego controlamos pasivamente a sus amigos: ¿tienen la gripe o no? Y luego la advertencia. Y otro ejemplo sería si uno es una compañía telefónica, averigua quiénes son el centro de la red, y le pregunta a esa gente: "¿Podrías mandarnos un sms con tu temperatura todos los días? Y uno junta ingentes cantidades de información de la temperatura de la gente pero de los individuos del centro. Y se es capaz, a gran escala, de monitorear una epidemia inminente con una participación mínima de la gente. O podría ser algo completamente activo, sé que los próximos oradores también hablarán de esto hoy, donde la gente participará globalmente en wikis o fotografiando, o siguiendo elecciones, y subiendo información de modo que pueda consolidarse para comprender los procesos sociales y los fenómenos sociales.
In fact, the availability of these data, I think, heralds a kind of new era of what I and others would like to call "computational social science." It's sort of like when Galileo invented -- or, didn't invent -- came to use a telescope and could see the heavens in a new way, or Leeuwenhoek became aware of the microscope -- or actually invented -- and could see biology in a new way. But now we have access to these kinds of data that allow us to understand social processes and social phenomena in an entirely new way that was never before possible. And with this science, we can understand how exactly the whole comes to be greater than the sum of its parts. And actually, we can use these insights to improve society and improve human well-being.
De hecho, la disponibilidad de estos datos, creo, anuncian una nueva era de lo que tanto yo como otros daríamos en llamar "ciencias sociales de cómputo". Es como cuando Galileo inventó -o no inventó- utilizó un telescopio y pudo ver el firmamento de otra manera; o cuando Leeuwenhoek conoció el microscopio -o en realidad lo inventó- y pudo ver la biología de manera nueva. Pero ahora tenemos acceso a estos datos que nos permiten entender los procesos sociales y los fenómenos sociales de una forma totalmente nueva que nunca antes fue posible. Y con esa ciencia podemos entender exactamente cómo el todo viene a ser más grande que la suma de las partes. Y, en realidad, podemos usar estos conocimientos para mejorar la sociedad y el bienestar del hombre.
Thank you.
Gracias.