(Music)
(音乐)
What you just heard are the interactions of barometric pressure, wind and temperature readings that were recorded of Hurricane Noel in 2007. The musicians played off a three-dimensional graph of weather data like this. Every single bead, every single colored band, represents a weather element that can also be read as a musical note. I find weather extremely fascinating. Weather is an amalgam of systems that is inherently invisible to most of us. So I use sculpture and music to make it, not just visible, but also tactile and audible.
你刚刚听到的 是我们在2007年录下的诺尔飓风的 气压,风速和气温数据 音乐家演奏的是这个一个三维的气象数据图 每一个珠子和彩带 代表着一个气象元素 也可以视作一个音符 我发现气候是非常令人惊叹的东西 气候是我们大多数人 看不见的系统的结合 所以我用雕塑和音乐 来创造它,不只是让其可见 并且可以触摸和听到
All of my work begins very simple. I extract information from a specific environment using very low-tech data collecting devices -- generally anything I can find in the hardware store. I then compare my information to the things I find on the Internet -- satellite images, weather data from weather stations as well as offshore buoys. That's both historical as well as real data. And then I compile all of these numbers on these clipboards that you see here. These clipboards are filled with numbers. And from all of these numbers, I start with only two or three variables. That begins my translation process.
我所有的工作开始都很简单 我用很低技术含量的数据收集装置 提取特定环境的信息-- 工具就是你能在五金店找到的那些 然后我把收集到的信息和网上可查的 气象站和海上浮标的 卫星云图及气象数据进行对比 包括历史数据和实时数据 你可以在这些速记板上看见我汇编的这些数据 上面全是数字 在这些数字里 我从两三个变量开始 进行翻译工作
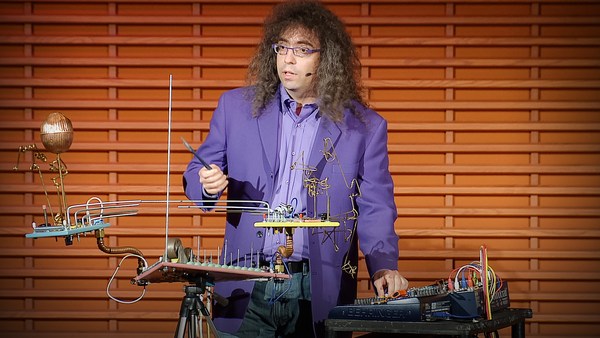
My translation medium is a very simple basket. A basket is made up of horizontal and vertical elements. When I assign values to the vertical and horizontal elements, I can use the changes of those data points over time to create the form. I use natural reed, because natural reed has a lot of tension in it that I cannot fully control. That means that it is the numbers that control the form, not me. What I come up with are forms like these. These forms are completely made up of weather data or science data. Every colored bead, every colored string, represents a weather element. And together, these elements, not only construct the form, but they also reveal behavioral relationships that may not come across through a two-dimensional graph.
我的翻译工具就是个篮子 一个由经纬线组成的篮子 当我对纵轴和横轴赋值 我就能用长期积累的数据 来编织其形态 我用的是芦苇 因为芦苇很有韧性 我无法完全控制 这就意味着这些数字控制其形状 而不是我 最后得到的造型是这样的 这些造型完全的通过 气象数据或者说科学数据形成的 每一个珠子和彩带 都是一个气象元素 这些元素不仅仅组成了这个雕塑 也展示了二维图片 无法展现的 元素间的行为关系
When you step closer, you actually see that it is indeed all made up of numbers. The vertical elements are assigned a specific hour of the day. So all the way around, you have a 24-hour timeline. But it's also used to assign a temperature range. On that grid, I can then weave the high tide readings, water temperature, air temperature and Moon phases. I also translate weather data into musical scores. And musical notation allows me a more nuanced way of translating information without compromising it.
当你靠近它 可以看出它确实由数字产生 纵轴是 一天里的具体时间 所以一圈是24小时 同时也表示气温的范围 在此框架下我就能把高潮数据 水温,气温和月相编进去 我也把气象数据翻译成乐谱 音符提供了一种更细致的 没有损失的 信息翻译方式
So all of these scores are made up of weather data. Every single color, dot, every single line, is a weather element. And together, these variables construct a score. I use these scores to collaborate with musicians. This is the 1913 Trio performing one of my pieces at the Milwaukee Art Museum. Meanwhile, I use these scores as blueprints to translate into sculptural forms like this, that function still in the sense of being a three-dimensional weather visualization, but now they're embedding the visual matrix of the musical score, so it can actually be read as a musical score.
这些乐谱都是用气象数据写成的 每一个颜色,每一条线 都是一个气象元素 这些变量共同组成乐谱 我用这些乐谱和音乐家门编曲 这是1913 Trio 在 Milwaukee艺术博物馆 演奏我的一个作品 同时我使用这些乐谱作为蓝图 转变这样的雕塑 仍然具备 三维化可视气候的功能 但现在有了可视的 乐谱嵌入其中 它就可以作为一个乐谱阅读
What I love about this work is that it challenges our assumptions of what kind of visual vocabulary belongs in the world of art, versus science. This piece here is read very differently depending on where you place it. You place it in an art museum, it becomes a sculpture. You place it in a science museum, it becomes a three-dimensional visualization of data. You place it in a music hall, it all of a sudden becomes a musical score. And I really like that, because the viewer is really challenged as to what visual language is part of science versus art versus music.
我喜欢这个作品的一点是 它挑战了我们对可视词汇 在科学世界和艺术世界中的假设 这个作品被放置不同的地方 有不同的解读方法 你把它放在艺术博物馆,这是个雕塑 放在科学博物馆 它就是数据的三维可视化 放在音乐厅 它又成了一份乐谱 我喜欢这点 因为这对观众常认为 可视化语言是科学的一部分 而不是艺术和音乐的看法是一种挑战
The other reason why I really like this is because it offers an alternative entry point into the complexity of science. And not everyone has a Ph.D. in science. So for me, that was my way into it.
另一个原因是 它提供了一种不同的 接触科学复杂性的视角 不是每个人都有个自然科学学科的博士学位 因为对我来说,这是我的方式
Thank you.
谢谢
(Applause)
(鼓掌)