(Music)
(Müzik)
What you just heard are the interactions of barometric pressure, wind and temperature readings that were recorded of Hurricane Noel in 2007. The musicians played off a three-dimensional graph of weather data like this. Every single bead, every single colored band, represents a weather element that can also be read as a musical note. I find weather extremely fascinating. Weather is an amalgam of systems that is inherently invisible to most of us. So I use sculpture and music to make it, not just visible, but also tactile and audible.
Duyduğunuz şey 2007'deki Noel Kasırgası sırasında kaydedilen barometrik basınç, rüzgar ve ısı değerlerinin etkileşimi. Müzisyenler bunun gibi üç boyutlu hava verileri grafiğini çaldılar. Her bir boncuk, her bir renkli şerit, aynı zamanda bir müzik notası gibi okunabilecek bir hava elemanını temsil ediyor. Havayı son derece büyüleyici bulurum. Hava bir çoğumuzun doğal olarak göremediği bir sistemler birleşimidir. Bunu sadece görülebilir değil, aynı zamanda elle tutulur ve duyulabilir yapmak için heykel ve müzik kullanıyorum.
All of my work begins very simple. I extract information from a specific environment using very low-tech data collecting devices -- generally anything I can find in the hardware store. I then compare my information to the things I find on the Internet -- satellite images, weather data from weather stations as well as offshore buoys. That's both historical as well as real data. And then I compile all of these numbers on these clipboards that you see here. These clipboards are filled with numbers. And from all of these numbers, I start with only two or three variables. That begins my translation process.
Çalışmalarımın hepsi çok basit bir şekilde başlıyor. Çok düşük teknolojili veri toplama cihazları kullanarak belli bir bölgeden bilgi topluyorum -- genellikle hırdavatçıdan bulabileceğim herhangi bir şeyle. Sonra bilgilerimi internetten bulduklarımla karşılaştırıyorum -- meteoroloji istasyonlarından ve denizdeki veri şamandıralarından edindiğim uydu görüntüleri ve hava verileriyle. Bunlar hem tarihi hem de gerçek veriler. Ve sonra burada gördüğünüz panolardaki rakamları düzenliyorum. Bu panolar rakamlarla dolu. Ve tüm bu rakamlardan, sadece değişken olan iki ya da üç tanesiyle başlıyorum. Bu çeviri sürecimi başlatıyor.
My translation medium is a very simple basket. A basket is made up of horizontal and vertical elements. When I assign values to the vertical and horizontal elements, I can use the changes of those data points over time to create the form. I use natural reed, because natural reed has a lot of tension in it that I cannot fully control. That means that it is the numbers that control the form, not me. What I come up with are forms like these. These forms are completely made up of weather data or science data. Every colored bead, every colored string, represents a weather element. And together, these elements, not only construct the form, but they also reveal behavioral relationships that may not come across through a two-dimensional graph.
Çeviri aracım çok basit bir sepet. Yatay ve dikey elemanlardan oluşan bir sepet. Yatay ve dikey elementlere veri atadığımda, zaman içinde bir şekil yaratmak için bu veri noktalarının değerlerini kullanabiliyorum. Doğal kamış kullanıyorum, çünkü doğal kamışta tamamen kontrol edemediğim çok fazla gerilim var. Bu şu demek oluyor, şekli kontrol eden rakamlar, ben değilim. Bunlara benzer şekiller buluyorum. Bu şekiller tamamen ikilim verileri ya da bilimsel verilerden oluşuyor. Her renkli boncuk, her renkli tel, bir hava elemanını temsil ediyor. Ve bu elementler hep beraber sadece şekil oluşturmakla kalmıyor, aynı zamanda iki boyutlu bir grafikte göremeyebileceğimiz davranışsal ilişkiler de meydana çıkarıyor.
When you step closer, you actually see that it is indeed all made up of numbers. The vertical elements are assigned a specific hour of the day. So all the way around, you have a 24-hour timeline. But it's also used to assign a temperature range. On that grid, I can then weave the high tide readings, water temperature, air temperature and Moon phases. I also translate weather data into musical scores. And musical notation allows me a more nuanced way of translating information without compromising it.
Yaklaştığınızda, aslında tamamen rakamlardan oluştuğunu görürsünüz. Dikey elemetler günün belli bir saatini saptıyor. Ve bu şekilde, 24 saatlik zaman çizelgesi elde ediyorsunuz. Ve ayrıca sıcaklık aralığını belirlemek için de kullanılıyor. Bu şebekede, sonra deniz kabarması okumalarını, su ısısını, hava ısısını ve Ay'ın evrelerini dokuyabiliyorum. Ayrıca hava verilerini müzik notalarına çeviriyorum. Nota sistemi bilgileri değiştirmeden çevirebilmem için daha incelikli bir yol sağlıyor.
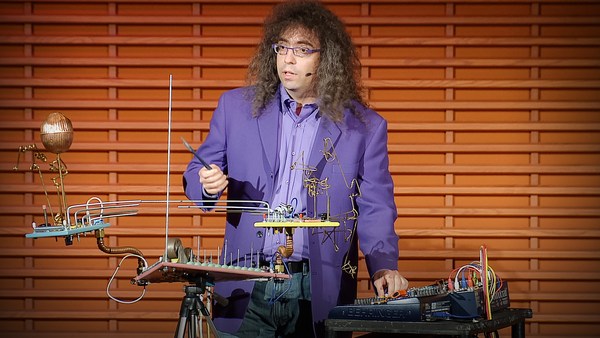
So all of these scores are made up of weather data. Every single color, dot, every single line, is a weather element. And together, these variables construct a score. I use these scores to collaborate with musicians. This is the 1913 Trio performing one of my pieces at the Milwaukee Art Museum. Meanwhile, I use these scores as blueprints to translate into sculptural forms like this, that function still in the sense of being a three-dimensional weather visualization, but now they're embedding the visual matrix of the musical score, so it can actually be read as a musical score.
Yani tüm bu notalar hava verilerinden oluşuyor. Her bir renk, nokta, her bir sıra, bir hava elementi. Ve bu değişkenler birlikte bir partisyon oluşturuyor. Bu partisyonları müzisyenlerle çalışmak için kullanıyorum. Burada 1913 Trio Milwaukee Sanat Müzesinde benim parçalarımdan birini çalıyor. Bu arada, bu partisyonları hala üç boyutlu hava görselleri olarak iş gören buna benzer heykellere çevirmek için ayrıntılı planlar olarak kullanıyorum, ama artık gerçekten müzik notası gibi okunabilsin diye görsel bir partisyon kalıbının içine yerleşiyorlar.
What I love about this work is that it challenges our assumptions of what kind of visual vocabulary belongs in the world of art, versus science. This piece here is read very differently depending on where you place it. You place it in an art museum, it becomes a sculpture. You place it in a science museum, it becomes a three-dimensional visualization of data. You place it in a music hall, it all of a sudden becomes a musical score. And I really like that, because the viewer is really challenged as to what visual language is part of science versus art versus music.
Bu çalışmada sevdiğim şey hangi görsel kelime dağarcığının bilim yerine sanat dünyasına ait olduğu varsayımımızı sorgulaması. Buradaki parça bulunduğu yere bağlı olarak çok farklı şekilde okunabilir. Sanat müzesine konursa, bir heykel olur. Bilim müzesine konursa, üç boyutlu veri görüntülemesi olur. Bir müzikhole koyarsanız, aniden bir partisyona dönüşür. Ve bunu çok seviyorum, çünkü izleyici gerçekten hangi görsel dilin bilimin, sanatın ya da müziğin parçası olduğu konusunda sorgulanıyor.
The other reason why I really like this is because it offers an alternative entry point into the complexity of science. And not everyone has a Ph.D. in science. So for me, that was my way into it.
Bunu sevmemin bir diğer nedeni de bilimin karmaşıklığına alternatif bir giriş noktası öneriyor olması. Ve herkesin bilimde doktora derecesi olmuyor. Benim için giriş noktası da buydu.
Thank you.
Teşekkürler.
(Applause)
(Alkışlar)