(Music)
(Muzyka)
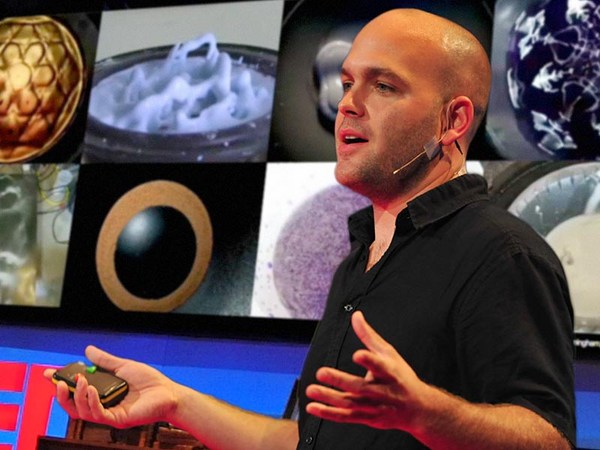
What you just heard are the interactions of barometric pressure, wind and temperature readings that were recorded of Hurricane Noel in 2007. The musicians played off a three-dimensional graph of weather data like this. Every single bead, every single colored band, represents a weather element that can also be read as a musical note. I find weather extremely fascinating. Weather is an amalgam of systems that is inherently invisible to most of us. So I use sculpture and music to make it, not just visible, but also tactile and audible.
To, co usłyszeliście, to zależności między ciśnieniem, wiatrem i temperaturą, które zostały zarejestowane podczas huraganu Noel w 2007. Muzycy odegrali trójwymiarowy graf danych meteorologicznych, takich jak te. Każdy koralik, każda kolorowa tasiemka reprezentuje element pogody, który również może być odczytany jako nuta. Pogoda ogromnie mnie fascynuje. Pogoda to amalgamat systemów, którego większość z nas prawie nie dostrzega. Używam więc rzeźby i muzyki, aby nie tylko stał się dostrzegalny, ale również namacalny i słyszalny.
All of my work begins very simple. I extract information from a specific environment using very low-tech data collecting devices -- generally anything I can find in the hardware store. I then compare my information to the things I find on the Internet -- satellite images, weather data from weather stations as well as offshore buoys. That's both historical as well as real data. And then I compile all of these numbers on these clipboards that you see here. These clipboards are filled with numbers. And from all of these numbers, I start with only two or three variables. That begins my translation process.
Moja praca zaczyna się bardzo prosto. Wydobywam informacje ze specyficznego środowiska, używając bardzo tradycyjnych urządzeń do zbioru danych, generalnie wszystkiego, co mogę znaleźć w sklepie z narzędziami. Porównuję informacje do tych znalezionych w Internecie: zdjęć satelitarnych, danych ze stacji meteorologicznych i z przybrzeżnych boi. Są to zarówno historyczne jak i bieżące dane. Zbieram wszystkie liczby na na widocznych tu podkładkach. Kartki na podkładkach są pełne liczb. Ze wszystkich tych liczb, biorę na początku tylko dwie czy trzy zmienne. Tak rozpoczyna się proces przekładu.
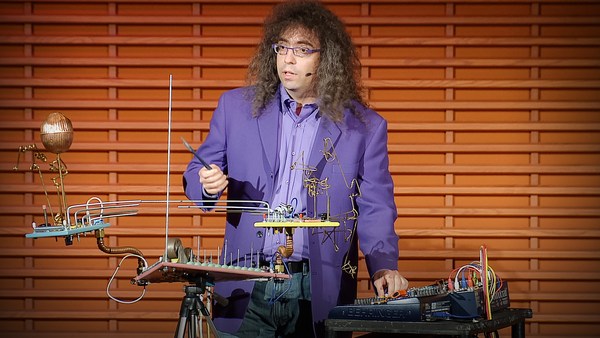
My translation medium is a very simple basket. A basket is made up of horizontal and vertical elements. When I assign values to the vertical and horizontal elements, I can use the changes of those data points over time to create the form. I use natural reed, because natural reed has a lot of tension in it that I cannot fully control. That means that it is the numbers that control the form, not me. What I come up with are forms like these. These forms are completely made up of weather data or science data. Every colored bead, every colored string, represents a weather element. And together, these elements, not only construct the form, but they also reveal behavioral relationships that may not come across through a two-dimensional graph.
Środkiem mojej przekładu jest bardzo prosty koszyk. Kosz jest zrobiony z pionowych i poziomych elementów. Kiedy przypisuję dane do pionowych i poziomych elementów, mogę używać zmian w tych danych do tworzenia formy. Używam naturalnej trzciny, ponieważ jest ona dosyć sztywna i nie mogę jej w pełni kontrolować. Oznacza to, że to liczby kontrolują formę, a nie ja. Efekt końcowy to formy takie. jak ta. Te formy składają się wyłącznie z danych meteorologicznych lub naukowych. Każdy kolorowy koralik, każdy kolorowy sznurek reprezentuje element pogody. Te elementy razem nie tylko tworzą formę, lecz również ujawniają behawioralne zależności, które można przeoczyć na dwuwymiarowym grafie.
When you step closer, you actually see that it is indeed all made up of numbers. The vertical elements are assigned a specific hour of the day. So all the way around, you have a 24-hour timeline. But it's also used to assign a temperature range. On that grid, I can then weave the high tide readings, water temperature, air temperature and Moon phases. I also translate weather data into musical scores. And musical notation allows me a more nuanced way of translating information without compromising it.
Podchodząc bliżej zauważycie, że całość jest stworzona z liczb. Pionowe elementy mają przypisaną konkretną godzinę dnia. Czyli uzyskujemy koło, 24 godzinną oś czasową. Jest stosowane także do przypisywania przedziałów temperatury. Na kracie mogę wyplatać dane o przypływach temperaturze wody i powietrza, oraz o fazach Księżyca. Przekładam również dane meteorologiczne na zapis nutowy. Zapis nutowy umożliwia bardziej zniuansowany przekład informacji bez utraty danych.
So all of these scores are made up of weather data. Every single color, dot, every single line, is a weather element. And together, these variables construct a score. I use these scores to collaborate with musicians. This is the 1913 Trio performing one of my pieces at the Milwaukee Art Museum. Meanwhile, I use these scores as blueprints to translate into sculptural forms like this, that function still in the sense of being a three-dimensional weather visualization, but now they're embedding the visual matrix of the musical score, so it can actually be read as a musical score.
Wszystkie te nuty są stworzone z danych meteorologicznych. Każdy kolor, kropka, każda linia jest elementem pogody. Razem wszystkie te czynniki tworzą nuty. Używam tych nut do współpracy z muzykami. To jest trio 1913, wykonujące jeden z moich utworów w Muzeum Sztuki w Milwaukee. Używam również nut jako szkiców do przekładów na rzeźby, takie jak ta, które nadal funkcjonują jako trójwymiarowe wizualizacje meteorologiczne. Teraz są osadzone w wizualnej matrycy zapisu nutowego, więc mogą być czytane jako nuty.
What I love about this work is that it challenges our assumptions of what kind of visual vocabulary belongs in the world of art, versus science. This piece here is read very differently depending on where you place it. You place it in an art museum, it becomes a sculpture. You place it in a science museum, it becomes a three-dimensional visualization of data. You place it in a music hall, it all of a sudden becomes a musical score. And I really like that, because the viewer is really challenged as to what visual language is part of science versus art versus music.
Kocham w tej pracy to, że podważa nasze założenia o tym, które wizualne słownictwo należy do świata sztuki, a które do nauki. To dzieło jest odczytywane zupełnie inaczej w zależności od umiejscowienia. Jeśli postawisz je w muzeum sztuki, staje się rzeźbą. Jeśli postawisz je w muzeum nauki, staje się trójwymiarową wizualizacją danych. Jeśli postawisz je w Music Hall, staje się nagle nutami. Podoba mi się to, ponieważ widz musi zdecydować, jaki język wizualny przynależy do nauki, jaki do sztuki, a jaki do muzyki.
The other reason why I really like this is because it offers an alternative entry point into the complexity of science. And not everyone has a Ph.D. in science. So for me, that was my way into it.
Lubię to również dlatego, że oferuje alternatywne punkty patrzenia na kompleksowość nauki. Nie każdy ma doktorat z nauk ścisłych. To jest moja droga do nauki.
Thank you.
Dziękuję.
(Applause)
(Brawa)