(Music)
(Muziek)
What you just heard are the interactions of barometric pressure, wind and temperature readings that were recorded of Hurricane Noel in 2007. The musicians played off a three-dimensional graph of weather data like this. Every single bead, every single colored band, represents a weather element that can also be read as a musical note. I find weather extremely fascinating. Weather is an amalgam of systems that is inherently invisible to most of us. So I use sculpture and music to make it, not just visible, but also tactile and audible.
Wat jullie zojuist hoorden, zijn de interacties tussen de barometrische druk, de wind en de temperatuur die zijn geregistreerd bij orkaan Noël in 2007. De muzikanten speelden een driedimensionale weergave van weergegevens zoals deze. Elke kraal, elke gekleurde strook staat voor een element van het weer dat ook kan worden gelezen als een muzieknoot. Ik vind het weer buitengewoon fascinerend. Het weer is een mengelmoes van systemen die de meesten van ons niet kunnen zien. Daarom gebruik ik beeld en muziek, niet alleen om het zichtbaar te maken, maar ook tastbaar en hoorbaar.
All of my work begins very simple. I extract information from a specific environment using very low-tech data collecting devices -- generally anything I can find in the hardware store. I then compare my information to the things I find on the Internet -- satellite images, weather data from weather stations as well as offshore buoys. That's both historical as well as real data. And then I compile all of these numbers on these clipboards that you see here. These clipboards are filled with numbers. And from all of these numbers, I start with only two or three variables. That begins my translation process.
Al mijn werken beginnen heel eenvoudig. Ik haal informatie uit een bepaalde omgeving met behulp van hele simpele meetinstrumenten -- eigenlijk alles wat ik in een ijzerhandel kan vinden. Dan vergelijk ik mijn data met wat ik op internet vind -- satellietbeelden, weergegevens van zowel weerstations als bakens in zee. Deze gegevens zijn zowel historisch als concreet. Dan verzamel ik alle getallen op de klemborden die je hier ziet. Deze klemborden staan vol met getallen. En van al deze getallen begin ik met slechts twee of drie variabelen. Daarmee begint mijn vertaalproces.
My translation medium is a very simple basket. A basket is made up of horizontal and vertical elements. When I assign values to the vertical and horizontal elements, I can use the changes of those data points over time to create the form. I use natural reed, because natural reed has a lot of tension in it that I cannot fully control. That means that it is the numbers that control the form, not me. What I come up with are forms like these. These forms are completely made up of weather data or science data. Every colored bead, every colored string, represents a weather element. And together, these elements, not only construct the form, but they also reveal behavioral relationships that may not come across through a two-dimensional graph.
Mijn vertaalmiddel is een simpele mand. Een mand bestaat uit horizontale en verticale elementen. Als ik waarden toeken aan de verticale en horizontale elementen, kan ik de veranderingen in het tijdsverloop van die datapunten gebruiken om de vorm te creëren. Ik gebruik natuurlijk riet, omdat er in natuurlijk riet veel spanning zit die ik niet helemaal kan beheersen. De getallen bepalen dus de vorm, niet ik. Waar ik op uitkom, zijn vormen als deze. Deze vormen zijn volledig gebaseerd op weergegevens of wetenschappelijke gegevens. Elke gekleurde kraal, elke gekleurde strook staat voor een element van het weer. En samen vormen deze elementen niet alleen de vorm, maar onthullen ze ook gedragsverhoudingen die misschien niet duidelijk worden uit een tweedimensionale weergave.
When you step closer, you actually see that it is indeed all made up of numbers. The vertical elements are assigned a specific hour of the day. So all the way around, you have a 24-hour timeline. But it's also used to assign a temperature range. On that grid, I can then weave the high tide readings, water temperature, air temperature and Moon phases. I also translate weather data into musical scores. And musical notation allows me a more nuanced way of translating information without compromising it.
Als je wat dichterbij kijkt, kun je zien dat hij daadwerkelijk helemaal bestaat uit getallen. De verticale elementen zijn een specifieke tijd van de dag toegekend. Over de hele omtrek heb je dus een tijdlijn van 24 uur. Maar hij geeft ook temperatuurverschillen aan. Op dat raster kan ik dan de vloedmetingen, watertemperatuur, luchttemperatuur en de maanfasen inweven. Ook vertaal ik de weergegevens naar muziek. Met de muzieknotatie kan ik op een genuanceerdere manier informatie vertalen zonder die te beïnvloeden.
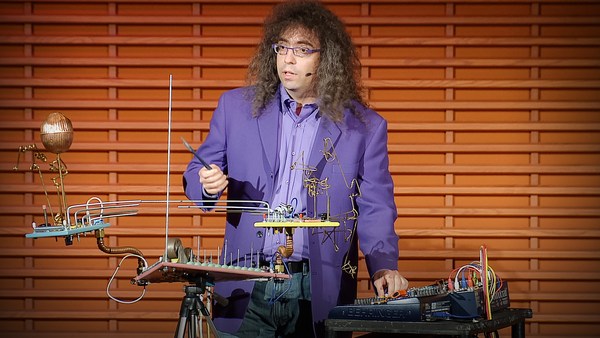
So all of these scores are made up of weather data. Every single color, dot, every single line, is a weather element. And together, these variables construct a score. I use these scores to collaborate with musicians. This is the 1913 Trio performing one of my pieces at the Milwaukee Art Museum. Meanwhile, I use these scores as blueprints to translate into sculptural forms like this, that function still in the sense of being a three-dimensional weather visualization, but now they're embedding the visual matrix of the musical score, so it can actually be read as a musical score.
Dus al deze noten bestaan uit weergegevens. Elke kleur, stip, elke regel is een element van het weer. En samen vormen deze variabelen een muziekstuk. Die gebruik ik om met muzikanten samen te werken. Dit is het 1913 Trio, dat een van mijn werken uitvoert in het Milwaukee Art Museum. Intussen gebruik ik deze muziekstukken als blauwdrukken, om te vertalen naar beeldende vormen als deze, die nog wel functioneren als driedimensionale voorstellingen van het weer. Maar nu omvatten ze ook het visuele model van het muziekschrift, waardoor ze als muziekstuk gelezen kunnen worden.
What I love about this work is that it challenges our assumptions of what kind of visual vocabulary belongs in the world of art, versus science. This piece here is read very differently depending on where you place it. You place it in an art museum, it becomes a sculpture. You place it in a science museum, it becomes a three-dimensional visualization of data. You place it in a music hall, it all of a sudden becomes a musical score. And I really like that, because the viewer is really challenged as to what visual language is part of science versus art versus music.
Het leuke van dit werk is dat we worden uitgedaagd opnieuw te bedenken welke visuele stijlvorm thuishoort in de wereld van kunst tegenover wetenschap. Dit stuk hier wordt verschillend gelezen, afhankelijk van waar het wordt geplaatst. In een kunstmuseum wordt het een sculptuur. In een wetenschapsmuseum wordt het een driedimensionale voorstelling van informatie. In een concertzaal wordt het opeens een muziekstuk. En dat vind ik wel mooi, omdat de kijker echt wordt uitgedaagd over welke visuele taal bij de wetenschap hoort of bij kunst of de muziek.
The other reason why I really like this is because it offers an alternative entry point into the complexity of science. And not everyone has a Ph.D. in science. So for me, that was my way into it.
De andere reden waarom ik dit erg mooi vind is omdat het een alternatieve inleiding biedt tot de complexiteit van wetenschap. En niet iedereen heeft een doctorsgraad in de wetenschap. Dit was dus mijn manier van kennismaking.
Thank you.
Dank jullie wel.
(Applause)
(Applaus)