(موسيقى)
(Music)
ما سمعتموه للتو هي تفاعلات الضغط البارومتري، قراءات الرياح ودرجة الحرارة التي تم تسجيلها من إعصار نويل في 2007. قام الموسيقيون بعزف رسم بياني ثلاثي الأبعاد لبيانات الطقس مثل هذا. كل خرزة لوحدها، كل شريط ملون لوحده، يمثل عنصرا من الطقس يمكن أن يقرأ كذلك كنوتة موسيقية. أجد الطقس فاتنا للغاية. الطقس مزيج من الأنظمة واضحة بطبيعتها لمعظمنا. لذلك أستخدم النحت والموسيقى لجعلها ليس فقط ظاهرة، بل كذلك ملموسة ومسموعة.
What you just heard are the interactions of barometric pressure, wind and temperature readings that were recorded of Hurricane Noel in 2007. The musicians played off a three-dimensional graph of weather data like this. Every single bead, every single colored band, represents a weather element that can also be read as a musical note. I find weather extremely fascinating. Weather is an amalgam of systems that is inherently invisible to most of us. So I use sculpture and music to make it, not just visible, but also tactile and audible.
كل أعمالي تبدأ بسيطة جدا. أستخرج المعلومات من محيط معين باستخدام أجهزة غير متطورة لتجميع البيانات -- و عادة كل ما أستطيع إيجاده في متجر المعدات. ثم أقارن معلوماتي مع الأشياء التي أجدها في الأنترنيت -- صور الأقمار الاصطناعية، بيانات الطقس من محطات الأرصاد الجوية وكذلك من العوامات البحرية. والتي هي في نفس الوقت بيانات تاريخية وحقيقية. ثم أجمع كل هذه الأرقام في هذه الحافظات التي ترون هنا. هذه الحافظات مملوءة بهذه الأرقام. ومن كل هذه الأرقام، أبدأ بمتغيرين أو ثلاثة فقط. التي أستند عليها لبدء عملية الترجمة.
All of my work begins very simple. I extract information from a specific environment using very low-tech data collecting devices -- generally anything I can find in the hardware store. I then compare my information to the things I find on the Internet -- satellite images, weather data from weather stations as well as offshore buoys. That's both historical as well as real data. And then I compile all of these numbers on these clipboards that you see here. These clipboards are filled with numbers. And from all of these numbers, I start with only two or three variables. That begins my translation process.
فحوى الترجمة لدي هو سلة بسيطة للغاية. السلة مصنوعة من عناصر أفقية وعمودية. حيث حين أربط القيم بالعناصر الأفقية والعمودية، أستطيع استخدام التغييرات في نقاط البيانات تلك مع مرور الوقت لإنشاء الشكل. أستخدم قصبا طبيعيا، لأن القصب الطبيعي لديه الكثير من الجهد والذي لا يمكنني التحكم فيه كليا. هذا يعني أن الأرقام هي التي تتحكم في الشكل، وليس أنا. ما خرجت به هو أشكال مثل هذه. هذه الأشكال مصنوعة بالكامل من بيانات الطقس أو بيانات علمية. كل خرزة ملونة، كل خيط ملون، يمثل عنصر طقس. وهذه العناصر مجتمعة، لا تنشئ الشكل فقط، لكنها تكشف عن العلاقات السلوكية والتي قد لا تتضح من خلال رسم بياني ثنائي الأبعاد.
My translation medium is a very simple basket. A basket is made up of horizontal and vertical elements. When I assign values to the vertical and horizontal elements, I can use the changes of those data points over time to create the form. I use natural reed, because natural reed has a lot of tension in it that I cannot fully control. That means that it is the numbers that control the form, not me. What I come up with are forms like these. These forms are completely made up of weather data or science data. Every colored bead, every colored string, represents a weather element. And together, these elements, not only construct the form, but they also reveal behavioral relationships that may not come across through a two-dimensional graph.
حين تقترب، ترى بالفعل أنها مصنوعة بالكامل من أرقام. العناصر العمودية عينت لها ساعة معينة من اليوم. وبالتالي على طول المدار لدينا خط زمني ل24 ساعة. لكنه مستخدم كذلك لتعيين نطاق درجة حرارة. على تلك الشبكة، يمكنني نسج قراءات المد العالي، درجة حرارة الماء ودرجة حرارة الهواء والأطوار القمرية. أقوم كذلك بترجمة بيانات الطقس إلى علامات موسيقية. ونوتات موسيقية تسمح لي بطريقة متنوعة من ترجمة المعلومات بدون إهمال أي جزء منها .
When you step closer, you actually see that it is indeed all made up of numbers. The vertical elements are assigned a specific hour of the day. So all the way around, you have a 24-hour timeline. But it's also used to assign a temperature range. On that grid, I can then weave the high tide readings, water temperature, air temperature and Moon phases. I also translate weather data into musical scores. And musical notation allows me a more nuanced way of translating information without compromising it.
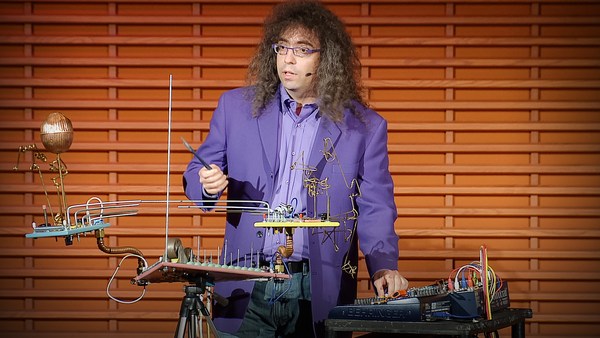
وبالتالي كل هذه العلامات مصنوعة من بيانات الطقس. كل لون لذاته ونقطة وكل سطر بعينه هو عنصر طقس. ومجتمعة تكون هذه البيانات علامة. أستخدم هذه العلامات للتعاون مع الموسيقيين. هذه تريو 1913 تؤدي إحدى قطعي في متحف الفن بميلووكي. في الوقت نفسه، أستخدم هذه العلامات كمخططات لترجمتها إلى أشكال منحوتة مثل هذه، والتي لاتزال حيوية بصورة ما كونها تصورات ثلاثية الأبعاد للطقس، لكنهم الآن يدمجون المصفوفة البصرية للعلامة الموسيقية، بحيث يمكن أن تقرأ بالفعل كعلامة موسيقية.
So all of these scores are made up of weather data. Every single color, dot, every single line, is a weather element. And together, these variables construct a score. I use these scores to collaborate with musicians. This is the 1913 Trio performing one of my pieces at the Milwaukee Art Museum. Meanwhile, I use these scores as blueprints to translate into sculptural forms like this, that function still in the sense of being a three-dimensional weather visualization, but now they're embedding the visual matrix of the musical score, so it can actually be read as a musical score.
ما أحبه في هذا العمل هو أنه يتحدى افتراضاتنا حول نوع القاموس البصري المنتمي إلى عالم الفن في مقابل العلم. هذه القطعة هنا تقرأ باختلاف شديد اعتماد على مكان وضعها. إن وضعتها في متحف فني، تصير منحوتة. إن وضعتها في متحف علمي، تصبح تصورا ثلاثي الأبعاد للبيانات. تضعها في قاعة موسيقى، فتصير فجأة علامة موسيقية. ويعجبني ذلك حقا، لأن المشاهد يتعرض للتحدي بالفعل من حيث ما إن كانت اللغة البصرية تنتمي إلى العلم في مقابل الفن أو في مقابل الموسيقى.
What I love about this work is that it challenges our assumptions of what kind of visual vocabulary belongs in the world of art, versus science. This piece here is read very differently depending on where you place it. You place it in an art museum, it becomes a sculpture. You place it in a science museum, it becomes a three-dimensional visualization of data. You place it in a music hall, it all of a sudden becomes a musical score. And I really like that, because the viewer is really challenged as to what visual language is part of science versus art versus music.
السبب الآخر الذي جعل ذلك يعجبني حقا هو أنه يعطي نقطة دخول بديلة لتعقيد العلوم. فليس الجميع لديهم دكتوراه فلسفة في العلوم. وبالتالي بالنسبة لي، كان ذلك طريق دخولي إلى عالم العلوم .
The other reason why I really like this is because it offers an alternative entry point into the complexity of science. And not everyone has a Ph.D. in science. So for me, that was my way into it.
شكرا لكم.
Thank you.
(تصفيق)
(Applause)