Over the past 10 years, I've been researching the way people organize and visualize information. And I've noticed an interesting shift.
过去的十年, 我一直在研究, 人们如何整理和构想信息 期间我发现了一个有趣的变化。
For a long period of time, we believed in a natural ranking order in the world around us, also known as the great chain of being, or "Scala naturae" in Latin, a top-down structure that normally starts with God at the very top, followed by angels, noblemen, common people, animals, and so on. This idea was actually based on Aristotle's ontology, which classified all things known to man in a set of opposing categories, like the ones you see behind me. But over time, interestingly enough, this concept adopted the branching schema of a tree in what became known as the Porphyrian tree, also considered to be the oldest tree of knowledge.
很长一段时间里, 我们相信我们所置身的 这个世界的自然秩序, 也称作“生存巨链”, 或拉丁文里的“自然级别” 一般以神为顶点 而开端自上而下 下面是天使、贵族、 平民、动物等。 这理念其实是基于 亚里士多德的本体论, 它将人类所知的东西 按对立关系分类, 比如我身后这个例子。 但随着时间的推移,有趣的是 这个理念吸收了来自树的分支结构, 后被称为“波菲利之树”, 这也被认为是最早的智慧之树。
The branching scheme of the tree was, in fact, such a powerful metaphor for conveying information that it became, over time, an important communication tool to map a variety of systems of knowledge. We can see trees being used to map morality, with the popular tree of virtues and tree of vices, as you can see here, with these beautiful illustrations from medieval Europe. We can see trees being used to map consanguinity, the various blood ties between people. We can also see trees being used to map genealogy, perhaps the most famous archetype of the tree diagram. I think many of you in the audience have probably seen family trees. Many of you probably even have your own family trees drawn in such a way. We can see trees even mapping systems of law, the various decrees and rulings of kings and rulers. And finally, of course, also a very popular scientific metaphor, we can see trees being used to map all species known to man. And trees ultimately became such a powerful visual metaphor because in many ways, they really embody this human desire for order, for balance, for unity, for symmetry.
实际上,树的分支结构 可以有效而形象地传递信息。 它逐渐变成了一个重要的交流工具, 用以描绘不同的知识系统。 我们可以发现树曾被用来描绘道德。 如人们熟知的善与恶之树。 比如这些来自欧洲中世纪的美丽插图。 树也被用以描述血缘关系。 人们之间各种血缘关系。 树也被用来描述家族谱系, 这可能是最著名而原始的树形图表。 我想在座很多听众都见过树形族谱。 你们之中的很多人的族谱 可能和这些图类似。 树也被用来描绘法律系统, 各种国王和掌权者的法令和规定。 最后,当然它通常还是科学的象征。 如图,树被用来归纳人类已知物种。 最终,树变为一种有效的视觉象征。 因为它在很多方面都能体现, 人类对秩序、平衡、 统一、对称的渴望。
However, nowadays we are really facing new complex, intricate challenges that cannot be understood by simply employing a simple tree diagram. And a new metaphor is currently emerging, and it's currently replacing the tree in visualizing various systems of knowledge. It's really providing us with a new lens to understand the world around us. And this new metaphor is the metaphor of the network. And we can see this shift from trees into networks in many domains of knowledge.
但如今, 我们正面临错中复杂的新难题, 它们难以用简单的树形来描绘。 一种新的视觉隐喻在逐渐成型, 它在逐渐取代树。 在各种图形化的知识系统中, 它为我们对世界的认识提供了新视角。 这种新形象就是网络结构。 我们可以发现网络逐渐取代树, 出现在各知识领域。
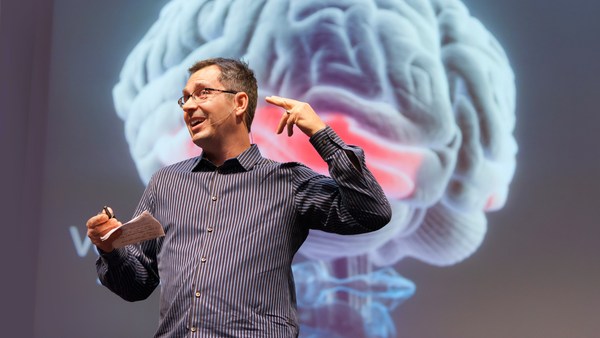
We can see this shift in the way we try to understand the brain. While before, we used to think of the brain as a modular, centralized organ, where a given area was responsible for a set of actions and behaviors, the more we know about the brain, the more we think of it as a large music symphony, played by hundreds and thousands of instruments. This is a beautiful snapshot created by the Blue Brain Project, where you can see 10,000 neurons and 30 million connections. And this is only mapping 10 percent of a mammalian neocortex. We can also see this shift in the way we try to conceive of human knowledge.
这种转变也发生在我们对大脑的认识。 过去我们把大脑看作 一个分块的中枢器官, 特定的区域控制特定的反应和行为。 当我们对大脑了解越多, 就越觉得它像一部大型交响乐, 由数以千计的乐器演奏出来。 这幅美妙的快照来自于蓝脑计划, 里面有一万个神经元和三千万条连接。 这仅表现了哺乳类的新大脑皮质的10%。 这种转变也体现在我们对人类知识的构想。
These are some remarkable trees of knowledge, or trees of science, by Spanish scholar Ramon Llull. And Llull was actually the precursor, the very first one who created the metaphor of science as a tree, a metaphor we use every single day, when we say, "Biology is a branch of science," when we say, "Genetics is a branch of science." But perhaps the most beautiful of all trees of knowledge, at least for me, was created for the French encyclopedia by Diderot and d'Alembert in 1751. This was really the bastion of the French Enlightenment, and this gorgeous illustration was featured as a table of contents for the encyclopedia. And it actually maps out all domains of knowledge as separate branches of a tree.
这是些很出色的知识树或科学树, 出自西班牙学者 Ramon Llull。 Llull 是一个先驱, 是首个用树形结构来表现科学的人。 一个我们每天都用到的形象,例如: “生物学是科学的分支。” 当我们说: “遗传学是科学的分支。” 于我而言,最美的知识树可能是, Diderot 和 d'Alembert 在1751年为法国大百科全书创作的。 它体现了法国启蒙运动的成就, 这幅美妙的图表成为了最具特色的目录 出现在百科全书上。 事实上它将各领域的知识, 划分于树的各个分支上。
But knowledge is much more intricate than this. These are two maps of Wikipedia showing the inter-linkage of articles -- related to history on the left, and mathematics on the right. And I think by looking at these maps and other ones that have been created of Wikipedia -- arguably one of the largest rhizomatic structures ever created by man -- we can really understand how human knowledge is much more intricate and interdependent, just like a network.
但知识是更错综复杂的。 这两幅来自维基的图, 表现了文章间的关联, 与左边的历史和右边的数学有关联。 我认为,这两幅图 以及维基百科上的其他图, 可以说是人类创造的最庞大的根茎结构。 由此可看出, 人类知识是如此错综复杂、 相互关联,就像一个网络。
We can also see this interesting shift in the way we map social ties between people. This is the typical organization chart. I'm assuming many of you have seen a similar chart as well, in your own corporations, or others. It's a top-down structure that normally starts with the CEO at the very top, and where you can drill down all the way to the individual workmen on the bottom. But humans sometimes are, well, actually, all humans are unique in their own way, and sometimes you really don't play well under this really rigid structure.
这种有趣的转变, 也体现在我们描绘人们的社会关系中。 这是张典型的组织机构图。 我相信在座很多听众也见过类似的, 在你们的公司或其他机构中。 这是个至上而下结构, 一般是CEO在顶端, 往下一直延伸到底部的各工作人员。 但每个人都有自己的独特之处。 但有时你无法在这种僵硬的框架下 施展所有才能。
I think the Internet is really changing this paradigm quite a lot. This is a fantastic map of online social collaboration between Perl developers. Perl is a famous programming language, and here, you can see how different programmers are actually exchanging files, and working together on a given project. And here, you can notice that this is a completely decentralized process -- there's no leader in this organization, it's a network.
网络大幅度改变了这一架构。 这张奇妙的图形展示了网络上 Perl 开发者间的社群合作。 Perl 是种著名的编程语言, 在此,你可以看到那些不同的程序员 在为定制的项目交换文件和协同工作。 你可以发现, 这个开发过程是完全分散的。 这个组织里没有领导人, 这是个网络。
We can also see this interesting shift when we look at terrorism. One of the main challenges of understanding terrorism nowadays is that we are dealing with decentralized, independent cells, where there's no leader leading the whole process. And here, you can actually see how visualization is being used. The diagram that you see behind me shows all the terrorists involved in the Madrid attack in 2004. And what they did here is, they actually segmented the network into three different years, represented by the vertical layers that you see behind me. And the blue lines tie together the people that were present in that network year after year. So even though there's no leader per se, these people are probably the most influential ones in that organization, the ones that know more about the past, and the future plans and goals of this particular cell.
这种有趣的转变, 也出现在恐怖主义者中。 当今研究恐怖主义最主要的挑战是 我们正在和一个权力分散、个体独立, 没有领导人统筹整个过程的组织打交道。 这里,你看到了信息的视觉化的应用。 我身后这个图, 展示了参与 2004年马德里袭击的恐怖分子。 这张图展示了他们所做的, 事实上他们将整个过程按年份分为三段, 如我身后所展示的这三个垂直平面。 将平面联系起来的蓝线, 代表了每年都参与了的人。 因此,虽然没有领导人, 这些人可能是组织中最具影响力的。 他们是这个特殊结构中最了解计划的过去 未来以及最终目的人。
We can also see this shift from trees into networks in the way we classify and organize species. The image on the right is the only illustration that Darwin included in "The Origin of Species," which Darwin called the "Tree of Life." There's actually a letter from Darwin to the publisher, expanding on the importance of this particular diagram. It was critical for Darwin's theory of evolution. But recently, scientists discovered that overlaying this tree of life is a dense network of bacteria, and these bacteria are actually tying together species that were completely separated before, to what scientists are now calling not the tree of life, but the web of life, the network of life.
这种从树到网络的转变, 也出现在我们对物种的分类。 右边这幅图, 是达尔文的《物种起源》中唯一的图。 达尔文称之为“生命之树”。 这实际是他给出版社的信, 用以解释这种结构的重要性。 对于达尔文进化论,这很重要。 但科学家最近发现在这生命之树下, 是个密集的细菌网络。 而正是这些细菌 将那些原本无关的物种联系起来, 科学家不再称之为生命之树, 而称为生命之网, 一张连接生命的网络。
And finally, we can really see this shift, again, when we look at ecosystems around our planet. No more do we have these simplified predator-versus-prey diagrams we have all learned at school. This is a much more accurate depiction of an ecosystem. This is a diagram created by Professor David Lavigne, mapping close to 100 species that interact with the codfish off the coast of Newfoundland in Canada. And I think here, we can really understand the intricate and interdependent nature of most ecosystems that abound on our planet.
最后一个例子,这种转变 也体现于地球生态系统中。 不再是这简化的捕食与被捕食, 如在校学到的那样。 这图更准确地描绘了生态系统。 这个图出自David Lavigne教授。 描绘了与鳕鱼相关的近100种物种, 位于加拿大纽芬兰沿岸。 由此,可以明白地球各生态系统中, 错综复杂、相互依存的本质。
But even though recent, this metaphor of the network, is really already adopting various shapes and forms, and it's almost becoming a growing visual taxonomy. It's almost becoming the syntax of a new language. And this is one aspect that truly fascinates me. And these are actually 15 different typologies I've been collecting over time, and it really shows the immense visual diversity of this new metaphor. And here is an example. On the very top band, you have radial convergence, a visualization model that has become really popular over the last five years. At the top left, the very first project is a gene network, followed by a network of IP addresses -- machines, servers -- followed by a network of Facebook friends. You probably couldn't find more disparate topics, yet they are using the same metaphor, the same visual model, to map the never-ending complexities of its own subject. And here are a few more examples of the many I've been collecting, of this growing visual taxonomy of networks.
而如今,这种网络状的形象 已经有不同的形状和形式, 变成一门逐渐壮大的视觉分类学, 几乎成为一门新语言的语法。 这一点非常吸引我。 实际上,有15种类型学, 是我逐渐收集到的, 图中显示了这新形象极具多样性。 举例而言, 最上排是径向会聚型。 过去5年中,这个视觉模型广受欢迎。 左上角,它最初是个基因网络, 紧接着是IP 地址、机器、服务器、 以及脸书网友的网络。 可能你难以找到与此迥异的话题, 但它们都用着相同的形象与视觉模型, 用以表现这一主题其自身 永无止境的复杂性。 再举些我收集到的例子, 它们运用了这种视觉分类网络。
But networks are not just a scientific metaphor. As designers, researchers, and scientists try to map a variety of complex systems, they are in many ways influencing traditional art fields, like painting and sculpture, and influencing many different artists. And perhaps because networks have this huge aesthetical force to them -- they're immensely gorgeous -- they are really becoming a cultural meme, and driving a new art movement, which I've called "networkism." And we can see this influence in this movement in a variety of ways. This is just one of many examples, where you can see this influence from science into art. The example on your left side is IP-mapping, a computer-generated map of IP addresses; again -- servers, machines. And on your right side, you have "Transient Structures and Unstable Networks" by Sharon Molloy, using oil and enamel on canvas. And here are a few more paintings by Sharon Molloy, some gorgeous, intricate paintings.
但网络不仅仅有科学化的形象。 当设计师、研究员、科学家 尽力地表达各种复杂系统, 它们正以不同方式影响着传统艺术领域, 如绘画和雕塑, 同样影响着不同的艺术家们。 或许网络对他们有着巨大的美学推动力, 它们如此多彩绚烂, 以致成为一种文化因子, 促成了一种新艺术运动, 我称之为“网络主义”。 它从多个方面影响着这场艺术运动。 这是其中一个例子, 表明这种影响从科学延伸到艺术。 左边的是IP 映射, 一幅电脑生成的映射图, 及服务器、机器的网络。 在右边的是, Sharon Molloy 的 《瞬时结构与非稳定网络》, 用油彩与珐琅绘于帆布上。 这些作品也来自于 Sharon Molloy, 是些美妙、繁复的画作。
And here's another example of that interesting cross-pollination between science and art. On your left side, you have "Operation Smile." It is a computer-generated map of a social network. And on your right side, you have "Field 4," by Emma McNally, using only graphite on paper. Emma McNally is one of the main leaders of this movement, and she creates these striking, imaginary landscapes, where you can really notice the influence from traditional network visualization.
这是另一个例子,关于科学与艺术之间 异花授粉式的交融和影响。 左边的是 《微笑行动》, 是幅电脑生成的社交网络图。 在右边的是出自 Emma McNally 的《字段4》, 仅用石墨绘于纸上。 Emma McNally 是这场艺术运动中的主要领袖之一, 她创造了这些惊艳而富想象力的作品, 由此可见传统网络视觉化对其的影响。
But networkism doesn't happen only in two dimensions. This is perhaps one of my favorite projects of this new movement. And I think the title really says it all -- it's called: "Galaxies Forming Along Filaments, Like Droplets Along the Strands of a Spider's Web." And I just find this particular project to be immensely powerful. It was created by Tomás Saraceno, and he occupies these large spaces, creates these massive installations using only elastic ropes. As you actually navigate that space and bounce along those elastic ropes, the entire network kind of shifts, almost like a real organic network would.
但网络主义不仅限于二维平面。 这可能是这场新运动中 我最喜欢的作品之一。 我认为它的名字很好的描述了它, “陷落在丝状中的星系, 犹如蜘蛛网上的悬挂的水珠。” 我觉得这个作品非常震撼, 它是 Tomás Saraceno 的作品。 他在这种大空间中, 仅用弹性绳来编织这巨大的装置。 当你在其中穿梭,碰到这些弹性绳, 整个网会变形, 就像个活生生的有机网络。
And here's yet another example of networkism taken to a whole different level. This was created by Japanese artist Chiharu Shiota in a piece called "In Silence." And Chiharu, like Tomás Saraceno, fills these rooms with this dense network, this dense web of elastic ropes and black wool and thread, sometimes including objects, as you can see here, sometimes even including people, in many of her installations.
这是另一个例子, 网络主义被发挥至一个全新的水平。 它是日本艺术家塩田千春的作品, 名为《寂静》。 如同Tomás Saraceno的作品, 她让这些空间布满网络, 由弹性绳、黑毛线、棉线编织的巨网。 有时加入了一些物品, 在她的一些作品中有时还有人。
But networks are also not just a new trend, and it's too easy for us to dismiss it as such. Networks really embody notions of decentralization, of interconnectedness, of interdependence. And this new way of thinking is critical for us to solve many of the complex problems we are facing nowadays, from decoding the human brain, to understanding the vast universe out there. On your left side, you have a snapshot of a neural network of a mouse -- very similar to our own at this particular scale. And on your right side, you have the Millennium Simulation. It was the largest and most realistic simulation of the growth of cosmic structure. It was able to recreate the history of 20 million galaxies in approximately 25 terabytes of output. And coincidentally or not, I just find this particular comparison between the smallest scale of knowledge -- the brain -- and the largest scale of knowledge -- the universe itself -- to be really quite striking and fascinating. Because as Bruce Mau once said, "When everything is connected to everything else, for better or for worse, everything matters."
但网络不仅仅是种趋势, 我们容易认为它的影响仅此而已。 网络很好地表现了 零散、关联、以及互相依存这些概念。 这种新思维非常对我们来说很重要, 可用以解决很多现今面临的复杂难题。 从对人脑的解析, 到探索广袤的宇宙。 左边是一张有关老鼠的神经网络图片。 这种尺度下看和人类的很像。 右边的是“千禧模拟” 它是最大型且最接近现实的 关于宇宙演化的模拟。 它能再现两千万星系的历史, 并输出成大约有25TB的数据。 无独有偶, 当我对比这两张图, 一个是最小尺度的知识——大脑, 一个是最大尺度的知识——宇宙。 都如此繁复而美妙。 正如 Bruce Mau 所说, “当所有事物彼此互相关联, 无论好坏,所有的事物都变得重要。”
Thank you so much.
谢谢。
(Applause)
(掌声)