Over the past 10 years, I've been researching the way people organize and visualize information. And I've noticed an interesting shift.
Останні 10 років я досліджував способи аналізу та візуалізації інформації. І помітив цікаву зміну.
For a long period of time, we believed in a natural ranking order in the world around us, also known as the great chain of being, or "Scala naturae" in Latin, a top-down structure that normally starts with God at the very top, followed by angels, noblemen, common people, animals, and so on. This idea was actually based on Aristotle's ontology, which classified all things known to man in a set of opposing categories, like the ones you see behind me. But over time, interestingly enough, this concept adopted the branching schema of a tree in what became known as the Porphyrian tree, also considered to be the oldest tree of knowledge.
Довгий період часу ми вірили в природній порядок речей в світі навколо нас, також відомий як великий ланцюг буття чи Scala naturae латиною. Ієрархічна структура, яка розпочинається від Бога на самій вершині, слідом ангели, визначні люди, звичайні люди, тварини і так далі. Ця ідея базувалась на онтології Аристотеля, яка класифікувала всі відомі людині речі, як набір протилежних категорій, як ті, що ви бачите позаду мене. Але з плином часу, що досить цікаво, ця концепція прийняла вигляд дерева з розгалуженими гілками, що стало відоме, як Порфирійське дерево, яке вважається найстарішим деревом пізнання.
The branching scheme of the tree was, in fact, such a powerful metaphor for conveying information that it became, over time, an important communication tool to map a variety of systems of knowledge. We can see trees being used to map morality, with the popular tree of virtues and tree of vices, as you can see here, with these beautiful illustrations from medieval Europe. We can see trees being used to map consanguinity, the various blood ties between people. We can also see trees being used to map genealogy, perhaps the most famous archetype of the tree diagram. I think many of you in the audience have probably seen family trees. Many of you probably even have your own family trees drawn in such a way. We can see trees even mapping systems of law, the various decrees and rulings of kings and rulers. And finally, of course, also a very popular scientific metaphor, we can see trees being used to map all species known to man. And trees ultimately became such a powerful visual metaphor because in many ways, they really embody this human desire for order, for balance, for unity, for symmetry.
Розгалужені гілки того дерева, фактично, є такою сильною метафорою вираження інформації, що з плином часу воно стало важливим інструментом зв'язку, для відображення різних систем знань. Ми бачимо, як з допомогою дерев ілюструється моральність, з популярним древом чеснот та деревом пороків, як ви можете побачити на цих прекрасних ілюстраціях середньовічної Європи. Ми бачимо, як дерева використовуються, щоб показати спорідненість, кровні зв'язки між різними людьми. Ми бачимо, що дерево використовується на мапі генеалогії, можливо, найвідоміший архетип діаграми у вигляді дерева. Я думаю, що багато хто з аудиторії, ймовірно, бачив сімейні дерева. Багато з вас, ймовірно, навіть мають власні сімейні дерева, створені таким чином. Ми бачили дерева, які відображають систему законів, різних указів та постанов королів та правителів. І нарешті, звичайно, дуже популярна наукова метафора, ми можемо поглянути на дерева, які показують всі види, відомі людині. У кінцевому підсумку дерева стали такою сильною візуальною метафорою, тому що в багатьох відносинах дійсно втілювали бажання людей до порядку, балансу, єдності, симетрії.
However, nowadays we are really facing new complex, intricate challenges that cannot be understood by simply employing a simple tree diagram. And a new metaphor is currently emerging, and it's currently replacing the tree in visualizing various systems of knowledge. It's really providing us with a new lens to understand the world around us. And this new metaphor is the metaphor of the network. And we can see this shift from trees into networks in many domains of knowledge.
Проте зараз ми стикаємось з новим комплексом заплутаних проблем, які не можна зрозуміти, просто застосовуючи просту діаграму дерева. Наразі виникає нова метафора, яка в даний час замінює дерево по візуалізації різних систем знань. Вона дійсно дає нам нові окуляри, щоб роздивитись світ навколо нас. Це нова метафора, це метафора мережі. Ми бачимо цей перехід від дерев до мереж у багатьох областях знання.
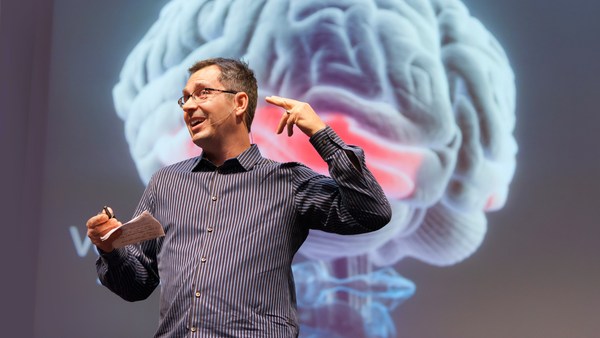
We can see this shift in the way we try to understand the brain. While before, we used to think of the brain as a modular, centralized organ, where a given area was responsible for a set of actions and behaviors, the more we know about the brain, the more we think of it as a large music symphony, played by hundreds and thousands of instruments. This is a beautiful snapshot created by the Blue Brain Project, where you can see 10,000 neurons and 30 million connections. And this is only mapping 10 percent of a mammalian neocortex. We can also see this shift in the way we try to conceive of human knowledge.
Ми бачимо цю зміну в наших спробах зрозуміти мозок. У той час, як раніше ми думали про мозок, як про модульний, централізований орган, де певна область відповідала за набір дій та поведінки, що більше ми дізнаємося про мозок, то більше ми думаємо про нього, як про грандіозну музичну симфонію, яку виконують сотні й тисячі музичних інструментів. Цей чудовий знімок створено проектом Blue Brain. Тут ви можете побачити 10 000 нейронів та 30 мільйонів зв'язків. Тут відображено тільки 10 відсотків неокортексу ссавців. Ми також бачимо зміну в спробах відобразити людські знання.
These are some remarkable trees of knowledge, or trees of science, by Spanish scholar Ramon Llull. And Llull was actually the precursor, the very first one who created the metaphor of science as a tree, a metaphor we use every single day, when we say, "Biology is a branch of science," when we say, "Genetics is a branch of science." But perhaps the most beautiful of all trees of knowledge, at least for me, was created for the French encyclopedia by Diderot and d'Alembert in 1751. This was really the bastion of the French Enlightenment, and this gorgeous illustration was featured as a table of contents for the encyclopedia. And it actually maps out all domains of knowledge as separate branches of a tree.
Це надзвичайні дерева знань чи дерева науки іспанського вченого Рамона Лулла. І Лулл, власне, був попередником, найпершим, хто створив метафору науки у вигляді дерева, метафору, яку ми використовуємо кожен день, коли говоримо, що "біологія - гілка науки", коли кажемо, що "генетика - це гілка науки". Але, можливо, найпрекрасніше з усіх дерев знань, принаймні для мене, було створено для французької енциклопедії Дідро і Даламбера в 1751 році. Це був дійсно бастіон французького просвітництва. Ці прекрасні ілюстрації зображені замість змісту для енциклопедії. Вони, насправді, ілюструють всі області знання, як окремі гілки дерева.
But knowledge is much more intricate than this. These are two maps of Wikipedia showing the inter-linkage of articles -- related to history on the left, and mathematics on the right. And I think by looking at these maps and other ones that have been created of Wikipedia -- arguably one of the largest rhizomatic structures ever created by man -- we can really understand how human knowledge is much more intricate and interdependent, just like a network.
Але знання набагато складніше, ніж це. Це дві карти Вікіпедії, які показують взаємозв'язок статей - пов'язаних з історією зліва і з математикою справа. Дивлячись на ці та інші мапи, що було створено у Вікіпедії - можливо, найбільш ризоматичній структурі, будь-коли створеній людиною - ми справді можемо зрозуміти, як людські знання є набагато складнішими та взаємозалежними, так само як мережа.
We can also see this interesting shift in the way we map social ties between people. This is the typical organization chart. I'm assuming many of you have seen a similar chart as well, in your own corporations, or others. It's a top-down structure that normally starts with the CEO at the very top, and where you can drill down all the way to the individual workmen on the bottom. But humans sometimes are, well, actually, all humans are unique in their own way, and sometimes you really don't play well under this really rigid structure.
Ми також бачимо цікаву зміну, в тому, як ми відображаємо соціальні зв'язки між людьми. Це типова схема організації. Я припускаю, що багато з вас також бачили подібну схему, у власній корпорації чи іншій. Це ієрархічна структура, що зазвичай починається з генерального директора на верхівці, і де ви можете постійно переходити до окремих робітників внизу. Але кожна людина по-своєму особлива, тому люди іноді не підпадають в рамки цієї дійсно жорсткої структури.
I think the Internet is really changing this paradigm quite a lot. This is a fantastic map of online social collaboration between Perl developers. Perl is a famous programming language, and here, you can see how different programmers are actually exchanging files, and working together on a given project. And here, you can notice that this is a completely decentralized process -- there's no leader in this organization, it's a network.
Я вважаю, що інтернет дійсно змінює цю парадигму. Це фантастична карта соціального онлайн співробітництва між розробниками мови Perl. Perl - відома мова програмування, і тут ви можете побачити, як різні програмісти обмінюються файлами та працюють разом у даному проекті. Як бачите, це цілком децентралізований процес, в цій організації немає лідера, це мережа.
We can also see this interesting shift when we look at terrorism. One of the main challenges of understanding terrorism nowadays is that we are dealing with decentralized, independent cells, where there's no leader leading the whole process. And here, you can actually see how visualization is being used. The diagram that you see behind me shows all the terrorists involved in the Madrid attack in 2004. And what they did here is, they actually segmented the network into three different years, represented by the vertical layers that you see behind me. And the blue lines tie together the people that were present in that network year after year. So even though there's no leader per se, these people are probably the most influential ones in that organization, the ones that know more about the past, and the future plans and goals of this particular cell.
Ми побачимо цікаво зміну, коли поглянемо на тероризм. На сьогодні одна з головних проблем розуміння тероризму - те, що ми маємо справу з децентралізованими самостійними осередками, де немає лідера, який керує всім процесом. Ось тут видно як, власне, використовується візуалізація. Діаграма, яку ви бачите позаду, показує всіх терористів, які брали участь в мадридській атаці 2004 року. Те, що вони зробили тут, власне розбиття мережі на сегменти на три різні роки, представлено вертикальними листами, які ви бачите позаду мене. Голубі лінії зв'язують разом усіх людей, котрі знаходилися в мережі рік за роком. Навіть коли немає лідера, як такого, ці люди, ймовірно, найвпливовіші в усій організації, ті, які більше знають про минулі та майбутні плани та цілі окремого осередку.
We can also see this shift from trees into networks in the way we classify and organize species. The image on the right is the only illustration that Darwin included in "The Origin of Species," which Darwin called the "Tree of Life." There's actually a letter from Darwin to the publisher, expanding on the importance of this particular diagram. It was critical for Darwin's theory of evolution. But recently, scientists discovered that overlaying this tree of life is a dense network of bacteria, and these bacteria are actually tying together species that were completely separated before, to what scientists are now calling not the tree of life, but the web of life, the network of life.
Ми бачимо, як дерева переросли в мережі, у нашу класифікацію та організацію видів. Зображення справа - це єдина ілюстрація, яку включив Дарвін в "Походження видів", яку Дарвін звав "Дерево життя". Насправді, це лист Дарвіна до видавця, де докладно викладено важливість цієї окремої діаграми. Це було вирішальним для теорії еволюції Дарвіна. Але нещодавно вчені відкрили, що це дерево життя покриває густа мережа бактерій, і ці бактерії, власне, зв'язують разом види, що були цілковито відокремлені раніше, і тим, що науковці зараз називають не деревом життя, а павутиною життя, мережею життя.
And finally, we can really see this shift, again, when we look at ecosystems around our planet. No more do we have these simplified predator-versus-prey diagrams we have all learned at school. This is a much more accurate depiction of an ecosystem. This is a diagram created by Professor David Lavigne, mapping close to 100 species that interact with the codfish off the coast of Newfoundland in Canada. And I think here, we can really understand the intricate and interdependent nature of most ecosystems that abound on our planet.
Врешті-решт, ми знову можемо побачити зміни, коли ми розглядаємо екосистеми нашої планети. Більше не буде цих спрощених діаграм по схемі хижак-жертва-здобич, які ми вчили в школі. Це набагато точніше описання екосистем. Цю діаграму створив професор Девід Лавінь. Тут відображено близько 100 видів, які взаємодіють з тріскою на узбережжі Ньюфаундленду в Канаді. Я вважаю, що тут ми справді зрозуміємо заплутаний та незалежний характер більшості екосистем, якими рясніє наша планета.
But even though recent, this metaphor of the network, is really already adopting various shapes and forms, and it's almost becoming a growing visual taxonomy. It's almost becoming the syntax of a new language. And this is one aspect that truly fascinates me. And these are actually 15 different typologies I've been collecting over time, and it really shows the immense visual diversity of this new metaphor. And here is an example. On the very top band, you have radial convergence, a visualization model that has become really popular over the last five years. At the top left, the very first project is a gene network, followed by a network of IP addresses -- machines, servers -- followed by a network of Facebook friends. You probably couldn't find more disparate topics, yet they are using the same metaphor, the same visual model, to map the never-ending complexities of its own subject. And here are a few more examples of the many I've been collecting, of this growing visual taxonomy of networks.
Та навіть зараз ця метафора мережі приймає дійсно різноманітні форми та майже стала популярною візуальною таксономією. Вона майже стала синтаксисом нової мови. І один цей аспект по-справжньому зачаровує мене. Це власне 15 різних типологій, які я збирав довгий час. Це демонструє величезне візуальне різноманіття нової метафори. Ось приклад. У верхньому рядку у вас є радіальна конвергенція, модель візуалізації, яка стала популярною впродовж останніх п'яти років. У лівому верхньому кутку перший проект, це мережа генів, потім йде мережа IP-адрес (пристроїв, серверів), потім мережа друзів на Фейсбуці. Ви, ймовірно, й не знайшли б більш розрізнених тем, поки вони не використали одну метафору, ту саму візуальну модель, щоб проілюструвати нескінченну заплутаність власного предмету. Кілька прикладів, які я зібрав, цієї популярної візуальної таксономії мереж.
But networks are not just a scientific metaphor. As designers, researchers, and scientists try to map a variety of complex systems, they are in many ways influencing traditional art fields, like painting and sculpture, and influencing many different artists. And perhaps because networks have this huge aesthetical force to them -- they're immensely gorgeous -- they are really becoming a cultural meme, and driving a new art movement, which I've called "networkism." And we can see this influence in this movement in a variety of ways. This is just one of many examples, where you can see this influence from science into art. The example on your left side is IP-mapping, a computer-generated map of IP addresses; again -- servers, machines. And on your right side, you have "Transient Structures and Unstable Networks" by Sharon Molloy, using oil and enamel on canvas. And here are a few more paintings by Sharon Molloy, some gorgeous, intricate paintings.
Але мережі - це не тільки наукова метафора. Коли дизайнери, дослідники та науковці ілюструють різноманітні комплексні системи, вони суттєво впливають на традиційне мистецтво, як-от на живопис і скульптуру, а також на чимало різних митців. Можливо, тому що мережі мають для них величезний естетичний потенціал, вони неймовірно яскраві, вони дійсно стали культурним мемом і очолили новий мистецький рух, який я назвав "нетворкізм". Ми бачимо цей вплив на рух у різних формах. Це лише один із багатьох прикладів, де ви бачите вплив науки на мистецтво. Приклад зліва - це IP-картографія, карта IP-адрес, згенерована комп'ютером, знову серверів, пристроїв. Праворуч маємо "Перехідні структури та нестабільні мережі" Шерон Моллой, з використання олії та емалі на полотні. Ось ще кілька картин Шерон Моллой, чудові, заплутані картини.
And here's another example of that interesting cross-pollination between science and art. On your left side, you have "Operation Smile." It is a computer-generated map of a social network. And on your right side, you have "Field 4," by Emma McNally, using only graphite on paper. Emma McNally is one of the main leaders of this movement, and she creates these striking, imaginary landscapes, where you can really notice the influence from traditional network visualization.
Ось ще один приклад цікавого взаємозбагачення науки та мистецтва. Зліва ви бачите "Операцію посмішка". Це згенерована комп'ютером карта соціальної мережі. Справа - "Поле 4" Емми Макнеллі, яка використовує лише графіт на папері. Емма Макнеллі - одна з головних лідерів цього руху, вона створює вражаючі уявні ландшафти, де можна помітити вплив традиційної мережевої візуалізації.
But networkism doesn't happen only in two dimensions. This is perhaps one of my favorite projects of this new movement. And I think the title really says it all -- it's called: "Galaxies Forming Along Filaments, Like Droplets Along the Strands of a Spider's Web." And I just find this particular project to be immensely powerful. It was created by Tomás Saraceno, and he occupies these large spaces, creates these massive installations using only elastic ropes. As you actually navigate that space and bounce along those elastic ropes, the entire network kind of shifts, almost like a real organic network would.
Нетворкізм не існує лише в двох вимірах. Це, можливо, один із моїх найулюбленіших проектів цього нового руху. Я вважаю, що заголовком сказано все, він звучить так: "Формування галактик на струнах, як крапель води на павутинці". А цей проект особливо потужний. Його створив Томас Сарасено. Він займає величезний простір, створюючи масивні інсталяції лише за допомогою еластичного канату. Якщо ви насправді вирішите пройтися там та балансувати на еластичних канатах, вся мережа буде переміщуватись, майже як справжня органічна мережа.
And here's yet another example of networkism taken to a whole different level. This was created by Japanese artist Chiharu Shiota in a piece called "In Silence." And Chiharu, like Tomás Saraceno, fills these rooms with this dense network, this dense web of elastic ropes and black wool and thread, sometimes including objects, as you can see here, sometimes even including people, in many of her installations.
Ось ще один приклад нетворкізму, взятий на цілком іншому рівні. Його створив японський митець Чіхару Шіота на картині під назвою "В мовчанні". Чіхару, як і Томас Сарасеро, заповнює кімнати густою мережею, густою павутиною еластичних канатів і чорною вовною та нитками, іноді включаючи об'єкти, які ви тут бачите, іноді захоплюючи людей, в багатьох інсталяціях.
But networks are also not just a new trend, and it's too easy for us to dismiss it as such. Networks really embody notions of decentralization, of interconnectedness, of interdependence. And this new way of thinking is critical for us to solve many of the complex problems we are facing nowadays, from decoding the human brain, to understanding the vast universe out there. On your left side, you have a snapshot of a neural network of a mouse -- very similar to our own at this particular scale. And on your right side, you have the Millennium Simulation. It was the largest and most realistic simulation of the growth of cosmic structure. It was able to recreate the history of 20 million galaxies in approximately 25 terabytes of output. And coincidentally or not, I just find this particular comparison between the smallest scale of knowledge -- the brain -- and the largest scale of knowledge -- the universe itself -- to be really quite striking and fascinating. Because as Bruce Mau once said, "When everything is connected to everything else, for better or for worse, everything matters."
Але мережі - не лише новий тренд, занадто легко ігнорувати їх, як таких. Мережі дійсно втілюють собою принципи децентралізації, взаємозалежності, взаємопов'язаності. Цей новий спосіб мислення є вирішальним для розв'язання комплексу проблем, з яким ми зараз стикаємось - від розшифрування людського мозку до розуміння неосяжного Всесвіту поза нашим зором. Зліва ви бачите знімок нейронної системи миші, дуже схожої на нашу власну в даному масштабі. Справа ми маємо Модель Тисячоліття. Це найбільша і найреалістичніша симуляція зростання космічної структури. Їй вдалося відтворити історію 20 мільйонів галактик приблизно в 25 терабайтах інформації. І випадково чи ні, я знаходжу це конкретне порівняння між найменшою мірою знання - мозком - та найбільшою мірою знання - самим Усесвітом - дійсно вражаючим та захоплюючим. Тому що, як сказав одного разу Брюс Мау: "Коли все пов'язане з усім іншим, на краще це чи на гірше, все має значення".
Thank you so much.
Дякую за увагу.
(Applause)
(Оплески)