Over the past 10 years, I've been researching the way people organize and visualize information. And I've noticed an interesting shift.
ตลอด 10 ปี ที่ผ่านมา เราได้ทำการศึกษาวิธี ที่คนจัดระเบียบและสร้างภาพข้อมูล และผมได้สังเกตการเปลี่ยนแปลงที่สำคัญ
For a long period of time, we believed in a natural ranking order in the world around us, also known as the great chain of being, or "Scala naturae" in Latin, a top-down structure that normally starts with God at the very top, followed by angels, noblemen, common people, animals, and so on. This idea was actually based on Aristotle's ontology, which classified all things known to man in a set of opposing categories, like the ones you see behind me. But over time, interestingly enough, this concept adopted the branching schema of a tree in what became known as the Porphyrian tree, also considered to be the oldest tree of knowledge.
ตลอดช่วงเวลาอันยาวนาน เราเชื่อในอันดับตามธรรมชาติ ของโลกรอบตัวเรา ที่เป็นที่รู้จักกันในชื่อ โซ่ใหญ่ของการมีอยู่ หรือ "สเกลล่า เนทูเรย์" ในภาษาละติน โครงสร้างจากบนลงสู่ล่างที่ปกติแล้ว จะเริ่มด้วยพระเจ้าที่ส่วนบน ตามมาด้วยเทวดา, คนสูงศักดิ์, คนทั่วไป, สัตว์ต่างๆ และอื่นๆ อันที่จริงแล้วแนวคิดนี้มีรากฐานมาจาก การศึกษาภาวะการมีอยู่ของอริสโตเติล ซึ่งจัดจำแนกทุกสิ่งที่คนรู้จัก เป็นชุดของกลุ่มที่ตรงข้ามกัน อย่างเช่นที่คุณได้เห็นด้านหลังผม แต่เมื่อเวลาผ่านไป น่าสนใจนะครับ แนวคิดนี้รับเอาแผนภาพต้นไม้ ที่แตกกิ่งก้านนี้ ที่ต่อมารู้จักกันว่า พอร์ไฟริน ทรี (Porphyrin tree) ยังถูกจัดว่าเป็นต้นไม้แห่งความรู้ ที่เก่าแก่ที่สุด
The branching scheme of the tree was, in fact, such a powerful metaphor for conveying information that it became, over time, an important communication tool to map a variety of systems of knowledge. We can see trees being used to map morality, with the popular tree of virtues and tree of vices, as you can see here, with these beautiful illustrations from medieval Europe. We can see trees being used to map consanguinity, the various blood ties between people. We can also see trees being used to map genealogy, perhaps the most famous archetype of the tree diagram. I think many of you in the audience have probably seen family trees. Many of you probably even have your own family trees drawn in such a way. We can see trees even mapping systems of law, the various decrees and rulings of kings and rulers. And finally, of course, also a very popular scientific metaphor, we can see trees being used to map all species known to man. And trees ultimately became such a powerful visual metaphor because in many ways, they really embody this human desire for order, for balance, for unity, for symmetry.
กิ่งก้านของรายการของต้นไม้ อันที่จริงแล้ว เป็นการอุปมาที่ทรงประสิทธิภาพ ในการสื่อถึงข้อมูล ที่มันกลายเป็นเครื่องมือในการสื่อสารที่สำคัญ ในเวลาต่อมา ในการทำแผนที่ความหลากหลาย ของระบบความรู้ เราสามารถเห็นต้นไม้ถูกใช้ เพื่อทำแผนที่จริยธรรม ด้วยต้นไม้ความดีที่เป็นที่รู้จักกันดี และต้นไม้แห่งความฉลาด ดังที่คุณเห็นได้ตรงนี้ ด้วยภาพที่สวยงามเหล่านี้ จากยุโรปยุคกลาง พวกเราเห็นต้นไม้ถูกใช้ เพื่อทำแผนผังเครือญาติ สายโลหิตที่ผูกพันระหว่างบุคคล พวกเรายังเห็นต้นไม้ถูกใช้ เพื่อทำแผนผังชาติวงศ์ บางทีมันต้นแบบที่โด่งดังที่สุด ของแผนภาพต้นไม้ ผมคิดถึงว่า ผู้ฟังหลายท่านในที่นี้ อาจเคยเห็นต้นไม้เครือญาติ พวกคุณหลายคนอาจเคยมีภาพวาด ต้นไม้เครือญาติไม่แบบใดก็แบบหนึ่ง พวกเราเห็นต้นไม้ที่เป็นแผนที่ ระบบกฎหมาย ฎีกาและการปกครองหลากหลาย ของกษัตริย์และผู้ปกครอง และในที่สุด แน่นอน มันยังมีอุปมาทางวิทยาศาสตร์ที่โด่งดังมาก เราสามารถเห็นต้นไม้ถูกใช้ เพื่อทำแผนที่สายพันธุ์ทั้งหมดที่มนุษย์รู้จัก และต้นไม้สุดท้ายก็กลายเป็นอุปมาเชิงภาพ ที่มีศักยภาพ เพราะว่าในหลายๆ แง่ พวกมันเป็นตัวแทนทางความคิดมนุษย์จริงๆ สำหรับลำดับ สำหรับสมดุล สำหรับความเป็นเอกภาพ สำหรับความสมมาตร
However, nowadays we are really facing new complex, intricate challenges that cannot be understood by simply employing a simple tree diagram. And a new metaphor is currently emerging, and it's currently replacing the tree in visualizing various systems of knowledge. It's really providing us with a new lens to understand the world around us. And this new metaphor is the metaphor of the network. And we can see this shift from trees into networks in many domains of knowledge.
อย่างไรก็ดี ทุกวันนี้ พวกเรากำลังเผชิญหน้า กับความท้าทายใหม่ที่ซับซ้อน ละเอียดอ่อน ที่ไม่สามารถจะเข้าใจได้โดยแค่การใช้ แผนภาพต้นไม้ง่ายๆ และอุปมาใหม่ก็กำลังถือกำเนิดขึ้น และมันกำลังแทนที่ต้นไม้ในตอนนี้ ในการแสดงภาพระบบของความรู้ต่างๆ มันทำให้เรามีมุมมองใหม่ ในการทำความเข้าใจโลกรอบๆ ตัวเราจริงๆ และอุปมาใหม่นี้ เป็นอุปมาของเครือข่าย และเราสามารถเห็นการเปลี่ยนแปลงนี้ จากต้นไม้ไปสู่เครือข่าย ในหลายๆ ขอบเขตความรู้
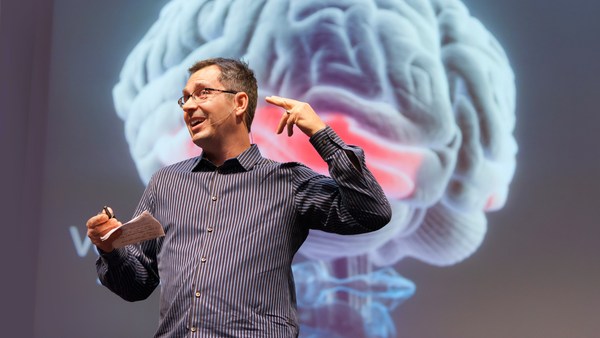
We can see this shift in the way we try to understand the brain. While before, we used to think of the brain as a modular, centralized organ, where a given area was responsible for a set of actions and behaviors, the more we know about the brain, the more we think of it as a large music symphony, played by hundreds and thousands of instruments. This is a beautiful snapshot created by the Blue Brain Project, where you can see 10,000 neurons and 30 million connections. And this is only mapping 10 percent of a mammalian neocortex. We can also see this shift in the way we try to conceive of human knowledge.
เราสามารถเห็นการเปลี่ยนแปลงนี้ ในวิธีที่เราพยายามเข้าใจสมอง ในขณะที่ก่อนหน้านี้ เราเคยที่จะคิดว่าสมอง เป็นอวัยวะศูนย์กลาง ที่มีสัดส่วนต่างๆ ที่บริเวณต่างๆ นั้น ทำหน้าที่รับผิดชอบ การกระทำและพฤติกรรมต่างๆ และยิ่งเรารู้เกี่ยวกับสมองมากเท่าไร เรายิ่งคิดว่ามัน เป็นเหมือนกับวงซิมโฟนีขนาดใหญ่ ที่บรรเลงโดยเครื่องดนตรี นับน้อยนับพัน มันเป็นภาพนิ่งที่สวยงามที่ถูกสร้างโดย โครงการบลูเบรน (Blue Brane Project) ซึ่งคุณสามารถเห็นเซลล์ประสาท 10,000 เซลล์ และการเชื่อมต่อ 30 ล้านจุด และมันเป็นเพียงการทำแผนที่ 10 เปอร์เซ็นต์ ของนีโอคอร์เท็กซ์ของสัตว์เลี้ยงลูกด้วยนม พวกเรายังสามารถเห็นการเปลี่ยนแปลง ในวิธีที่เราพยายามทำให้ได้มาซึ่งความรู้
These are some remarkable trees of knowledge, or trees of science, by Spanish scholar Ramon Llull. And Llull was actually the precursor, the very first one who created the metaphor of science as a tree, a metaphor we use every single day, when we say, "Biology is a branch of science," when we say, "Genetics is a branch of science." But perhaps the most beautiful of all trees of knowledge, at least for me, was created for the French encyclopedia by Diderot and d'Alembert in 1751. This was really the bastion of the French Enlightenment, and this gorgeous illustration was featured as a table of contents for the encyclopedia. And it actually maps out all domains of knowledge as separate branches of a tree.
นี่เป็นต้นไม้แห่งความรู้ที่น่าสนใจ หรือต้นไม้แห่งวิทยาศาสตร์ โดยนักวิชาการชาวสเปน รามอน ยัลล์ (Ramon Llull) และยัลล์ก็เป็นต้นกำเนิด คนแรกๆ ที่สร้างอุปมาทางวิทยาศาสตร์ ว่าเป็นดังต้นไม้ อุปมาที่เราใช้ในชีวิตประจำวัน เมื่อเราพูดว่า "ชีววิทยาเป็นสาขาหนึ่งของวิทยาศาสตร์" เมื่อเราพูดว่า "พันธุศาสตร์เป็นสาขาหนึ่งของวิทยาศาสตร์" แต่บางที ต้นไม้แห่งความรู้ที่งดงามที่สุด อย่างน้อยก็สำหรับผม ถูกสร้างขึ้นโดยสารานุกรมฝรั่งเศส โดย ดิเดอโร และ ดาลัมเบอร์ช ใน ค.ศ. 1751 มันเป็นปราการของยุคเรืองปัญญาแห่งฝรั่งเศส อย่างแท้จริง และภาพที่อลังการนี้ ปรากฎอยู่ในตารางสารบัญ ของสารานุกรม และอันที่จริงมันทำแผนที่ส่วนต่างๆ ของความรู้ทั้งหมด เป็นดังสาขาต่างๆ ของต้นไม้
But knowledge is much more intricate than this. These are two maps of Wikipedia showing the inter-linkage of articles -- related to history on the left, and mathematics on the right. And I think by looking at these maps and other ones that have been created of Wikipedia -- arguably one of the largest rhizomatic structures ever created by man -- we can really understand how human knowledge is much more intricate and interdependent, just like a network.
แต่ความรู้ก็ละเอียดอ่อนมากกว่านี้ มีแผนที่สองอันในวิกิพีเดีย ที่แสดงความเชื่อมโยงลิงก์ระหว่างหัวข้อ ที่เกี่ยวข้องกับประวัติศาสตร์ทางซ้าย และคณิตศาสตร์ทางขวา และจากการดูที่แผนที่เหล่านี้ และแผนที่ที่สร้างในวิกิพีเดีย ผมคิดว่ามันเป็นหนึ่งในโครงสร้างรากที่ใหญ่ที่สุด ที่ถูกสร้างขึ้นโดยมนุษย์อย่างไม่อาจเถียงได้ เราเข้าใจได้จริงๆ ว่าความรู้มนุษย์ ละเอียดอ่อน และต้องพึ่งพาซึ่งกันและกัน เช่นเดียวกันกับเครือข่าย
We can also see this interesting shift in the way we map social ties between people. This is the typical organization chart. I'm assuming many of you have seen a similar chart as well, in your own corporations, or others. It's a top-down structure that normally starts with the CEO at the very top, and where you can drill down all the way to the individual workmen on the bottom. But humans sometimes are, well, actually, all humans are unique in their own way, and sometimes you really don't play well under this really rigid structure.
พวกเรายังเห็นการเปลี่ยนแปลงที่น่าสนใจนี้ ในวิธีที่เราทำแผนที่เงี่อนสังคม ระหว่างบุคคล นี่เป็นแผนภูมิองค์กรทั่วๆ ไป ผมคิดว่าพวกคุณส่วนใหญ่ เคยเห็นแผนภูมิคล้ายๆ กันนี้ ในบริษัทของคุณเอง หรือบริษัทอื่นๆ มันเป็นโครงสร้างจากบนลงล่าง ที่ปกติแล้วเริ่มด้วยประธานคณะเจ้าหน้าที่บริหาร ทางตอนบนสุด และคุณสามารถเจาะลงมาตามทาง จนไปถึงคนงานแต่ละคนทางด้านล่าง แต่บางครั้ง ที่จริง คนทุกคน ก็มีความเป็นอัตลักษณ์ในแบบของตัวเอง และบางครั้ง คุณก็แสดงบทบาทได้ไม่ค่อยดี ภายใต้โครงสร้างที่ไม่ยืดหยุ่นนี้
I think the Internet is really changing this paradigm quite a lot. This is a fantastic map of online social collaboration between Perl developers. Perl is a famous programming language, and here, you can see how different programmers are actually exchanging files, and working together on a given project. And here, you can notice that this is a completely decentralized process -- there's no leader in this organization, it's a network.
ผมคิดว่า อินเทอร์เน็ตเปลี่ยนแปลงกรอบแนวคิด ไปค่อนข้างมาก นี่เป็นแผนที่ที่ยอดเยี่ยน ของความร่วมมือทางสังคมออนไลน์ ระหว่าง ผู้พัฒนาเพอร์ (Perl) เพอร์เป็นภาษาโปรแกรมที่ได้รับความนิยม และที่นี่ คุณสามารถได้เห็นว่า นักเขียนโปรแกรม กำลังแลกเปลี่ยนไฟล์ และกำลังทำงานด้วยกันในงานที่ได้รับมอบหมาย และที่นี้ คุณสังเกตได้ว่า นี่เป็นกระบวนการที่ถูกกระจายออกอย่างสมบูรณ์ -- มันไม่มีผู้นำในองค์กรนี้ มันเป็นเครือข่าย
We can also see this interesting shift when we look at terrorism. One of the main challenges of understanding terrorism nowadays is that we are dealing with decentralized, independent cells, where there's no leader leading the whole process. And here, you can actually see how visualization is being used. The diagram that you see behind me shows all the terrorists involved in the Madrid attack in 2004. And what they did here is, they actually segmented the network into three different years, represented by the vertical layers that you see behind me. And the blue lines tie together the people that were present in that network year after year. So even though there's no leader per se, these people are probably the most influential ones in that organization, the ones that know more about the past, and the future plans and goals of this particular cell.
เรายังสามารถเห็นการเปลี่ยนแปลงที่น่าสนใจ เมื่อพวกเราดูการก่อการร้าย หนึ่งในความท้าทาย ในการทำความเข้าใจการก่อการร้ายในปัจจุบัน คือพวกเรากำลังเผชิญกับการกระจายอำนาจ หน่วยที่เป็นอิสระ ที่ซึ่งไม่มีผู้นำที่จะกำกับทั้งกระบวนการ และในที่นี้ คุณสามารถเห็นได้ ว่าการแสดงภาพถูกใช้อย่างไร แผนภาพที่คุณเห็นข้างหลังผม แสดงผู้ก่อการร้ายทั้งหมดที่เกี่ยวข้อง ในการโจมตีที่มาดริดใน ค.ศ. 2004 และที่เขาทำตรงนี้คือ พวกเราแบ่งเครือข่ายเป็นส่วนๆ เป็นสามปี ที่แทนด้วยชั้นแนวตั้ง ที่คุณเห็นข้างหลังผม และเส้นสีฟ้าพัน คนที่ปรากฏอยู่ในเครือข่ายปีแล้วปีเล่า เข้าด้วยกัน ฉะนั้น แม้ว่ามันจะไม่มีผู้นำด้วยตัวมันเอง คนเหล่านี้อาจเป็นคนที่ทรงอิทธิพลมากที่สุด ในองค์กรนั้นๆ คนที่รู้มากเกี่ยวกับแผนและเป้าหมาย ในอดีตและในอนาคต ของหน่วยดังกล่าว
We can also see this shift from trees into networks in the way we classify and organize species. The image on the right is the only illustration that Darwin included in "The Origin of Species," which Darwin called the "Tree of Life." There's actually a letter from Darwin to the publisher, expanding on the importance of this particular diagram. It was critical for Darwin's theory of evolution. But recently, scientists discovered that overlaying this tree of life is a dense network of bacteria, and these bacteria are actually tying together species that were completely separated before, to what scientists are now calling not the tree of life, but the web of life, the network of life.
เราสามารถเห็นการเปลี่ยนแปลงนี้ จากต้นไม้ในเครือข่าย ในวิธีที่เราจำแนกและจัดระเบียบสปีชีส์ ภาพทางด้านขวา เป็นเพียงภาพ ที่ดาวินรวมเอาไว้ใน "กำเนิดสปีชีส์" ซึ่งดาวินเรียกมันว่า "ต้นไม้แห่งชีวิต" นี่คือจดหมายจริงๆ จากดาวิน ถึงสำนักพิมพ์ ที่ขยายความสำคัญของแผนภาพดังกล่าว มันสำคัญสำหรับทฤษฎีวิวัฒนาการของดาวิน แต่เมื่อไม่นานมานี้ นักวิทยาศาสตร์ ค้นพบว่า สิ่งที่ซ้อนทับต้นไม้แห่งชีวิตนี้ คือเครือข่ายแน่นหนาของแบคทีเรีย และแบคทีเรียเหล่านี้ เชื่อมโยงกัน มันเป็นสปีชีส์ที่แยกกันอยู่มาก่อน ตอนนี้ นักวิทยาศาสตร์ไม่ได้เรียกมันว่า ต้นไม้แห่งชีวิต แต่เป็นใยแห่งชีวิต เป็นเน็ตเวิร์คแห่งชีวิต
And finally, we can really see this shift, again, when we look at ecosystems around our planet. No more do we have these simplified predator-versus-prey diagrams we have all learned at school. This is a much more accurate depiction of an ecosystem. This is a diagram created by Professor David Lavigne, mapping close to 100 species that interact with the codfish off the coast of Newfoundland in Canada. And I think here, we can really understand the intricate and interdependent nature of most ecosystems that abound on our planet.
และท้ายที่สุด เราสามารถเห็นการเปลี่ยนแปลง อีกครั้ง เมื่อเรามองที่ระบบนิเวศรอบๆ โลกของเรา ไม่มีอีกแล้วที่เราจะมีแผนภาพง่ายๆ ของผู้ล่าและเหยื่อ แบบที่เรียนที่โรงเรียน นี่คือภาพที่ถูกต้องมากกว่าของระบบนิเวศ นี่คือแผนภาพที่ถูกสร้าง โดยศาสตราจารย์ เดวิด ลาวิกนี การทำแผนที่เกือบ 100 สปีชีส์ ที่มีความสัมพันกับปลาค๊อด นอกฝั่งนิวฟาวแลนด์ ในแคนาดา และผมว่า พวกเราสามารถเข้าใจได้จริงๆ ว่า ธรรมชาติที่ต้องพึ่งพากันและละเอียดอ่อน ของระบบนิเวศส่วนใหญ่ที่ผูกพันกับโลกของเรา
But even though recent, this metaphor of the network, is really already adopting various shapes and forms, and it's almost becoming a growing visual taxonomy. It's almost becoming the syntax of a new language. And this is one aspect that truly fascinates me. And these are actually 15 different typologies I've been collecting over time, and it really shows the immense visual diversity of this new metaphor. And here is an example. On the very top band, you have radial convergence, a visualization model that has become really popular over the last five years. At the top left, the very first project is a gene network, followed by a network of IP addresses -- machines, servers -- followed by a network of Facebook friends. You probably couldn't find more disparate topics, yet they are using the same metaphor, the same visual model, to map the never-ending complexities of its own subject. And here are a few more examples of the many I've been collecting, of this growing visual taxonomy of networks.
แต่แม้ว่าเร็วๆ นี้ อุปมาของเครือข่ายนี้ ก็พัฒนาปรับรับเอารูปร่างรูปทรง และก็เกือบกลายเป็น อนุกรมวิธานเชิงภาพที่กำลังเติบโต มันเกือบที่จะกลายเป็นไวยกรณ์ ของภาษาใหม่ และนี่ก็เป็นมุมมองหนึ่ง ที่น่าสนใจสำหรับผม และนี่ก็เป็นการจัดกลุ่มต่างๆ 15 กลุ่ม ที่ผมได้รวบรวมมา และมันแสดงความแตกต่างเชิงภาพ ของอุปมาใหม่นี้ และนี่ก็คือตัวอย่าง ที่แถบด้านบน เรามีการลู่เข้าเชิงรัศมี แบบจำลองการมองภาพที่เป็นที่นิยม ตลอดห้าปีที่ผ่านมา ตอนบนทางด้านซ้าย โครงการแรก คือเครือข่ายยีน ที่ตามมาด้วยเครือข่ายของ ที่อยู่ ไอพี -- เครื่องยนต์, เซอร์ฟเวอร์ -- ตามมาด้วยเครือข่ายของเพื่อนๆ ในเฟสบุ๊ค คุณอาจไม่พบหัวข้อ ที่แตกต่างกันไปมากกว่านี้ แต่พวกเขาก็ใช้อุปมาเดียวกัน แบบจำลองเชิงภาพเดียวกัน เพื่อทำแผนที่ความซับซ้อนที่ไม่มีวันสิ้นสุด ของศาสตร์ของมันเอง และนี่คือตัวอย่างอีกบางส่วน ของอีกหลายๆ งานที่ผมได้เก็บข้อมูล ของการเติบโตของอนุกรมวิธานเชิงภาพ ของเครือข่าย
But networks are not just a scientific metaphor. As designers, researchers, and scientists try to map a variety of complex systems, they are in many ways influencing traditional art fields, like painting and sculpture, and influencing many different artists. And perhaps because networks have this huge aesthetical force to them -- they're immensely gorgeous -- they are really becoming a cultural meme, and driving a new art movement, which I've called "networkism." And we can see this influence in this movement in a variety of ways. This is just one of many examples, where you can see this influence from science into art. The example on your left side is IP-mapping, a computer-generated map of IP addresses; again -- servers, machines. And on your right side, you have "Transient Structures and Unstable Networks" by Sharon Molloy, using oil and enamel on canvas. And here are a few more paintings by Sharon Molloy, some gorgeous, intricate paintings.
แต่เครือข่ายไม่ได้เป็นแค่อุปมา นักออกแบบ นักวิจัย และนักวิทยาศาสตร์ พยายาม ทำแผนที่ความหลากหลายของระบบที่ซับซ้อน พวกเขาได้ให้แรงบันดาลใจ กับศาสตร์ของศิลปะดั้งเดิม เช่นการวาดภาพ การปั้นขึ้นรูป และให้แรงบันดาลใจศิลปินหลายคน และบางที เพราะว่าเครือข่าย มีพลังอันงดงามที่ยิ่งใหญ่ -- พวกมันอลังการอย่างมาก -- พวกมันกลายเป็นกระแสทางวัฒนธรรม และขับเคลื่อนศิลปะกระแสใหม่ ซึ่งเรียกว่า "ศิลปะเครือข่าย" และพวกเราสามารถเห็นแรงบันดาลใจ ที่มีต่อกระแสนี้ในหลายๆ ทาง นี่เป็นแค่บางส่วนของตัวอย่าง ที่คุณสามารถเห็นแรงบันดาลใจนี้ จากวิทยาศาสตร์ไปยังศิลปะ ตัวอย่างทางซ้ายคือ การทำแผนที่ไอพี แผนที่ ไอพี ที่ถูกสร้างขึ้นโดยคอมพิวเตอร์ และทางด้านขวาของคุณ คุณมี "โครงสร้างชั่วคราวและเครือข่ายที่ไม่เสถียร" โดย ชารอน มอลลี่ ที่ใช้นำมันและสารเคลือบบนผ้าใบ และนี่คือภาพวาดอีกจำนวนหนึ่ง โดย ชารอน มอลลี่ ภาพวาดที่อลังการ และละเอียดอ่อน
And here's another example of that interesting cross-pollination between science and art. On your left side, you have "Operation Smile." It is a computer-generated map of a social network. And on your right side, you have "Field 4," by Emma McNally, using only graphite on paper. Emma McNally is one of the main leaders of this movement, and she creates these striking, imaginary landscapes, where you can really notice the influence from traditional network visualization.
และนี่คืออีกตัวอย่าง ของการถ่ายเทข้ามกันอย่างน่าสนใจ ระหว่างวิทยาศาสตร์และศิลปะ ทางด้านซ้าย คุณมี "ปฏิบัติการยิ้ม" มันเป็นแผนที่โลกโซเชียวเน็ตเวิร์ค ที่ถูกสร้างโดยคอมพิวเตอร์ และทางด้านขวา คุณมี "สนาม 4" โดย เอ็มมา แม็คแนลลี่ ที่ใช้เพียงรอยดินสอบนกระดาษ เอ็มมา แม็คเนลลี่ เป็นหนึ่งในผู้นำหลัก ของแนวคิดนี้ และเธอสร้างสรรค์แผนภาพจินตนาการ ที่น่าทึ่งเหล่านี้ ที่คุณสังเกตเห็นแรงบันดาลใจ จากการสร้างภาพเน็ตเวิร์คแบบดั้งเดิม
But networkism doesn't happen only in two dimensions. This is perhaps one of my favorite projects of this new movement. And I think the title really says it all -- it's called: "Galaxies Forming Along Filaments, Like Droplets Along the Strands of a Spider's Web." And I just find this particular project to be immensely powerful. It was created by Tomás Saraceno, and he occupies these large spaces, creates these massive installations using only elastic ropes. As you actually navigate that space and bounce along those elastic ropes, the entire network kind of shifts, almost like a real organic network would.
แต่ความเป็นเน็ตเวิร์คไม่ได้เกิดเพียงแค่สองมิติ บางที่นี่อาจเป็นหนึ่งในโครงการที่ผมชอบที่สุด ของแนวคิดใหม่นี้ และผมคิดว่าหัวข้อช่างสมบูรณ์แบบ --มันถูกเรียกว่า "กาแล็คซี่ที่เกิดขึ้นตามเส้นใย เช่นเดียวกับหยดน้ำตามสาย ของใยแมงมุม" และผมก็คิดว่าโครงการดังกล่วนี้ มีพลังอย่างมาก มันถูกสร้างขึ้นโดย โทมัส ซาราสิโน และเขาใช้พื้นที่กว้างเหล่านี้ สร้างงานชิ้นใหญ่เหล่านี้ โดยใช้เพียงเชือกรัดของ เสมือนคุณนำทางพื้นที่ และเด้นไปตามเชื่อกรัดของ เครือข่ายทั้งหมดเคลื่อนไหว เกือบเหมือนกับเครือข่ายอินทรีย์จริงๆ
And here's yet another example of networkism taken to a whole different level. This was created by Japanese artist Chiharu Shiota in a piece called "In Silence." And Chiharu, like Tomás Saraceno, fills these rooms with this dense network, this dense web of elastic ropes and black wool and thread, sometimes including objects, as you can see here, sometimes even including people, in many of her installations.
และนี่ก็ยังเป็นอีกตัวอย่างหนึ่ง ของการเชื่อมต่อในอีกระดับ มันถูกสร้างโดยศิลปินชาวญี่ปุ่น ชิฮารุ ชิโอตะ ในชิ้นงานที่เรียกว่า "ในความเงียบ" และชิฮารุ เช่นเดียวกับ โทมัส ซาราสิโน ที่เติมเต็มห้องนี้ด้วยเครือข่ายหนาแน่นนี้ เว็ปไซด์ที่หนาแน่นของเชือกรัดของ และขนสัตว์สีดำ และเส้นสายนี้ บางครั้งมีวัตถุอย่างที่คุณได้เห็นตรงนี้ บางครั้งมีคน ในงานอื่นๆ ของเธอ
But networks are also not just a new trend, and it's too easy for us to dismiss it as such. Networks really embody notions of decentralization, of interconnectedness, of interdependence. And this new way of thinking is critical for us to solve many of the complex problems we are facing nowadays, from decoding the human brain, to understanding the vast universe out there. On your left side, you have a snapshot of a neural network of a mouse -- very similar to our own at this particular scale. And on your right side, you have the Millennium Simulation. It was the largest and most realistic simulation of the growth of cosmic structure. It was able to recreate the history of 20 million galaxies in approximately 25 terabytes of output. And coincidentally or not, I just find this particular comparison between the smallest scale of knowledge -- the brain -- and the largest scale of knowledge -- the universe itself -- to be really quite striking and fascinating. Because as Bruce Mau once said, "When everything is connected to everything else, for better or for worse, everything matters."
แต่เครือข่ายไม่ได้เป็นเพียงกระแสใหม่ และมันก็ง่ายเกินไปสำหรับเรา ที่จะปฏิเสธว่ามันเป็นอย่างนั้น เครือข่ายเป็นตัวแทน ของความเข้าใจการกระจาย ของความเชื่อมโยง ของการพึ่งพากัน และวิธีการคิดใหม่นี้ก็สำคัญมาก สำหรับเราในการแก้ปัญหาซับซ้อนมากมาย ที่เรากำลังเผชิญหน้าในปัจจุบัน สำหรับการถอดรหัสสมองมนุษย์ เพื่อที่จะเข้าใจ จักรวาลที่ยิ่งใหญ่ข้างนอกนั่น และทางด้านซ้ายมือของคุณ คุณมีภาพถ่ายของเครือข่ายธรรมชาติของหนู -- ที่คล้ายกันกับของเราในระดับนี้ และทางด้านขวาของคุณ คุณมีแบบจำลองสหัสวรรษ มันเป็นแบบจำลองที่ใหญ่ที่สุด และเหมือนจริงที่สุด ของการเติบโตของโครงสร้างอวกาศ มันสามารถที่จะสร้างประวัติศาสตร์ ของกาแล็คซี่ 20 ล้านกาแล็คซี่ ขึ้นใหม่ ในประมาณผลที่ได้ประมาณ 25 เทระไบต์ และไม่ว่ามันจะเป็นเรื่องบังเอิญหรือไม่ ผมเพิ่งได้พบข้อเปรียบเทียบ ระหว่างระดับที่เล็กที่สุดของความรู้ -- สมอง -- และระดับที่ใหญ่ที่สุดของความรู้ -- จักรวาลเอง -- ว่ามันช่างน่าทึ่งและน่าสนใจยิ่งนัก เพราะว่า บรูส มัว (Bruce Mau) เคยกล่าวไว้ว่า "เมื่อทุกสิ่งเชื่อมต่อกันกับทุกๆ สิ่ง ไม่ว่าจะอย่างไร ทุกอย่างก็มีความหมาย"
Thank you so much.
ขอบคุณมากครับ
(Applause)
(เสียงปรบมือ)