Over the past 10 years, I've been researching the way people organize and visualize information. And I've noticed an interesting shift.
Nos últimos dez anos, venho pesquisando a forma como as pessoas organizam e visualizam a informação. E notei uma mudança interessante.
For a long period of time, we believed in a natural ranking order in the world around us, also known as the great chain of being, or "Scala naturae" in Latin, a top-down structure that normally starts with God at the very top, followed by angels, noblemen, common people, animals, and so on. This idea was actually based on Aristotle's ontology, which classified all things known to man in a set of opposing categories, like the ones you see behind me. But over time, interestingly enough, this concept adopted the branching schema of a tree in what became known as the Porphyrian tree, also considered to be the oldest tree of knowledge.
Durante muito tempo, acreditamos num ordenamento natural no mundo que nos cerca, também conhecida como A Grande Cadeia dos Seres ou, em latim, "scala naturae", uma estrutura hierárquica que normalmente começa com Deus no topo, seguido por anjos, nobres, pessoas comuns, animais, e assim por diante. Na verdade, essa ideia se baseia na ontologia de Aristóteles, que classifica todas as coisas conhecidas num grupo de categorias opostas, como podem ver aqui. Mas, curiosamente, com o tempo, esse conceito adotou o esquema de ramificações de uma árvore, no que se tornou conhecido como a Árvore de Porfírio, também considerada a árvore mais velha do conhecimento.
The branching scheme of the tree was, in fact, such a powerful metaphor for conveying information that it became, over time, an important communication tool to map a variety of systems of knowledge. We can see trees being used to map morality, with the popular tree of virtues and tree of vices, as you can see here, with these beautiful illustrations from medieval Europe. We can see trees being used to map consanguinity, the various blood ties between people. We can also see trees being used to map genealogy, perhaps the most famous archetype of the tree diagram. I think many of you in the audience have probably seen family trees. Many of you probably even have your own family trees drawn in such a way. We can see trees even mapping systems of law, the various decrees and rulings of kings and rulers. And finally, of course, also a very popular scientific metaphor, we can see trees being used to map all species known to man. And trees ultimately became such a powerful visual metaphor because in many ways, they really embody this human desire for order, for balance, for unity, for symmetry.
O sistema de ramificações era, de fato, uma metáfora tão poderosa para transmitir informação que se tornou, com o tempo, uma importante ferramenta de comunicação para mapear diversos sistemas do conhecimento. Temos árvores sendo usadas para mapear a moralidade, como a famosa árvore das virtudes e a árvore dos vícios, como podem ver aqui nessas lindas ilustrações da Europa medieval. Temos árvores sendo usadas para mapear a consanguinidade, os laços de sangue entre as pessoas. Também temos árvores sendo usadas para mapear a genealogia, talvez o arquétipo mais famoso do diagrama da árvore. Imagino que muitos aqui já tenham visto uma árvore genealógica. Provavelmente alguns até tenham a árvore da sua família nesse formato. Temos árvores mapeando os sistemas legais, os vários decretos e normas de reis e governantes. E, finalmente, é claro, uma metáfora científica muito popular são as árvores usadas para mapear as espécies conhecidas pelo homem. E, no final das contas, elas se tornaram uma metáfora visual muito poderosa por encarnarem, de muitas formas, esse desejo humano pela ordem, pelo equilíbrio, pela unidade, pela simetria.
However, nowadays we are really facing new complex, intricate challenges that cannot be understood by simply employing a simple tree diagram. And a new metaphor is currently emerging, and it's currently replacing the tree in visualizing various systems of knowledge. It's really providing us with a new lens to understand the world around us. And this new metaphor is the metaphor of the network. And we can see this shift from trees into networks in many domains of knowledge.
No entanto, hoje em dia enfrentamos novos desafios complexos e intrincados que não podem ser entendidos meramente com um simples diagrama de árvore. Atualmente, está surgindo uma nova metáfora que está substituindo a árvore na visualização dos diversos sistemas do conhecimento e nos oferecendo de fato novas lentes para entender o mundo que nos cerca. E essa nova metáfora é a metáfora da rede. Podemos observar essa mudança de árvores para redes em muitos campos do conhecimento.
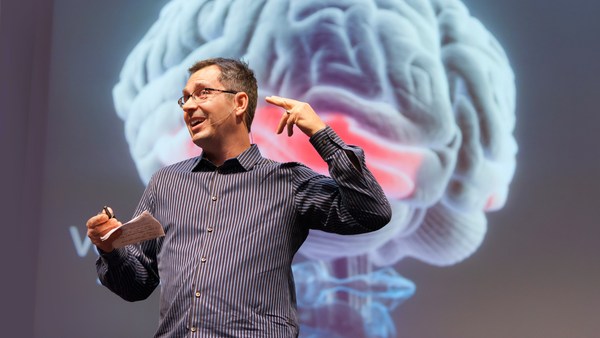
We can see this shift in the way we try to understand the brain. While before, we used to think of the brain as a modular, centralized organ, where a given area was responsible for a set of actions and behaviors, the more we know about the brain, the more we think of it as a large music symphony, played by hundreds and thousands of instruments. This is a beautiful snapshot created by the Blue Brain Project, where you can see 10,000 neurons and 30 million connections. And this is only mapping 10 percent of a mammalian neocortex. We can also see this shift in the way we try to conceive of human knowledge.
Vemos essa mudança na forma como tentamos entender o cérebro. Se, no passado, pensávemos no cérebro como um órgão centralizado, modular, em que uma dada área era responsável por um grupo de ações e comportamentos, quanto mais conhecemos o cérebro, mais pensamos nele como uma grande sinfonia, tocada por centenas e milhares de instrumentos. Esta é uma linda imagem criada pelo "Blue Brain Project", na qual vemos 10 mil neurônios e 30 milhões de conexões. E estes são apenas 10% do mapeamento do neocórtex dos mamíferos. Percebemos também a mudança na forma de se conceber o conhecimento humano.
These are some remarkable trees of knowledge, or trees of science, by Spanish scholar Ramon Llull. And Llull was actually the precursor, the very first one who created the metaphor of science as a tree, a metaphor we use every single day, when we say, "Biology is a branch of science," when we say, "Genetics is a branch of science." But perhaps the most beautiful of all trees of knowledge, at least for me, was created for the French encyclopedia by Diderot and d'Alembert in 1751. This was really the bastion of the French Enlightenment, and this gorgeous illustration was featured as a table of contents for the encyclopedia. And it actually maps out all domains of knowledge as separate branches of a tree.
Estas são árvores notáveis do conhecimento, ou árvores da ciência, do estudioso espanhol Raimundo Lúlio. E Lúlio foi, na verdade, um precursor, o primeiríssimo a criar a metáfora da ciência como uma árvore, uma metáfora que usamos todo santo dia quando dizemos: "A biologia é um ramo da ciência", quando dizemos: "A genética é um ramo da ciência". Mas, talvez, a árvore do conhecimento mais linda, pelo menos para mim, foi a criada pela enciclopédia francesa de Diderot e d'Alembert em 1751. Esse foi realmente o baluarte do Iluminismo francês, e esta linda ilustração foi concebida como o índice da enciclopédia. Ela, na verdade, mapeia todos os domínios do conhecimento como ramos separados de uma árvore.
But knowledge is much more intricate than this. These are two maps of Wikipedia showing the inter-linkage of articles -- related to history on the left, and mathematics on the right. And I think by looking at these maps and other ones that have been created of Wikipedia -- arguably one of the largest rhizomatic structures ever created by man -- we can really understand how human knowledge is much more intricate and interdependent, just like a network.
Mas o conhecimento é muito mais intrincado que isso. Existem dois mapas da Wikipédia mostrando a interligação entre os artigos relacionados à história, à esquerda, e à matemática, à direita. Penso que, observando estes mapas e outros que foram criados pela Wikipédia, provavelmente uma das maiores estruturas rizomáticas criadas pelo homem, conseguimos entender como o conhecimento humano é muito mais intrincado e interdependente, exatamente como uma rede.
We can also see this interesting shift in the way we map social ties between people. This is the typical organization chart. I'm assuming many of you have seen a similar chart as well, in your own corporations, or others. It's a top-down structure that normally starts with the CEO at the very top, and where you can drill down all the way to the individual workmen on the bottom. But humans sometimes are, well, actually, all humans are unique in their own way, and sometimes you really don't play well under this really rigid structure.
Também pode-se observar a interessante mudança na forma como mapeamos os laços sociais entre as pessoas. Este é um organograma típico. Estou supondo que muitos aqui já viram um semelhante em suas empresas, ou em outras. É uma estrutura hierárquica que normalmente começa com o presidente no topo, e onde podemos ir descendo até os trabalhadores individuais na base. Mas os humanos são únicos, cada um a seu modo, e, às vezes, não se adaptam a uma estrutura tão rígida.
I think the Internet is really changing this paradigm quite a lot. This is a fantastic map of online social collaboration between Perl developers. Perl is a famous programming language, and here, you can see how different programmers are actually exchanging files, and working together on a given project. And here, you can notice that this is a completely decentralized process -- there's no leader in this organization, it's a network.
Acho que a Internet está realmente mudando esse paradigma. Este é um mapa fantástico de colaboração social on-line entre desenvolvedores "Perl". "Perl" é uma famosa linguagem de programação, e aqui vocês podem ver como diferentes programadores estão, de fato, trocando arquivos e trabalhando juntos num dado projeto. E dá para notar que este é um processo completamente descentralizado, não existe um líder nessa organização, é uma rede.
We can also see this interesting shift when we look at terrorism. One of the main challenges of understanding terrorism nowadays is that we are dealing with decentralized, independent cells, where there's no leader leading the whole process. And here, you can actually see how visualization is being used. The diagram that you see behind me shows all the terrorists involved in the Madrid attack in 2004. And what they did here is, they actually segmented the network into three different years, represented by the vertical layers that you see behind me. And the blue lines tie together the people that were present in that network year after year. So even though there's no leader per se, these people are probably the most influential ones in that organization, the ones that know more about the past, and the future plans and goals of this particular cell.
Também podemos ver essa interessante mudança quando analisamos o terrorismo. Um dos maiores desafios para se entender o terrorismo hoje em dia é o fato de estarmos lidando com células descentralizadas, independentes, onde não há um líder conduzindo o processo todo. E aqui podem ver como a visualização está sendo usada. O diagrama aqui atrás de mim mostra todos os terroristas envolvidos no ataque de Madri em 2004. E, na verdade, o que eles fizeram foi segmentar a rede em três anos diferentes, representados por camadas verticais que vocês veem atrás de mim. As linhas azuis unem as pessoas que estavam naquela rede ano a ano. Daí, mesmo sem um líder propriamente dito, provavelmente essas pessoas são as mais influentes da organização, as que mais sabem sobre o passado e os planos e os objetivos dessa célula em particular.
We can also see this shift from trees into networks in the way we classify and organize species. The image on the right is the only illustration that Darwin included in "The Origin of Species," which Darwin called the "Tree of Life." There's actually a letter from Darwin to the publisher, expanding on the importance of this particular diagram. It was critical for Darwin's theory of evolution. But recently, scientists discovered that overlaying this tree of life is a dense network of bacteria, and these bacteria are actually tying together species that were completely separated before, to what scientists are now calling not the tree of life, but the web of life, the network of life.
Vemos também essa mudança de árvores para redes na forma como classificamos e organizamos as espécies. A imagem à direita é a única ilustração que Darwin incluiu em "A Origem das Espécies", a qual ele chamou de a "Árvore da Vida". Na verdade, existe uma carta de Darwin para o editor do livro ressaltando a importância desse diagrama em particular. Ele foi crucial para a teoria da evolução de Darwin. Mas, recentemente, os cientistas descobriram que, recobrindo essa árvore, existe uma densa rede de bactérias, e essas bactérias na verdade estão ligando espécies que eram completamente separadas, naquilo que os cientistas chamam hoje não de árvore da vida, mas de teia da vida, rede da vida.
And finally, we can really see this shift, again, when we look at ecosystems around our planet. No more do we have these simplified predator-versus-prey diagrams we have all learned at school. This is a much more accurate depiction of an ecosystem. This is a diagram created by Professor David Lavigne, mapping close to 100 species that interact with the codfish off the coast of Newfoundland in Canada. And I think here, we can really understand the intricate and interdependent nature of most ecosystems that abound on our planet.
E, finalmente, podemos ver essa mudança de novo quando observamos os ecossistemas do nosso planeta. Nada de diagramas simplificados de predador versus presa que todos aprendemos na escola. Esta é uma representação muito mais precisa de um ecossistema. Este diagrama foi criado pelo professor David Lavigne, mapeando cerca de 100 espécies que interagem com o bacalhau na costa da Terra Nova, no Canadá. Acho que assim vamos conseguir entender a natureza intrincada e interdependente da maioria dos ecossistemas que abundam em nosso planeta.
But even though recent, this metaphor of the network, is really already adopting various shapes and forms, and it's almost becoming a growing visual taxonomy. It's almost becoming the syntax of a new language. And this is one aspect that truly fascinates me. And these are actually 15 different typologies I've been collecting over time, and it really shows the immense visual diversity of this new metaphor. And here is an example. On the very top band, you have radial convergence, a visualization model that has become really popular over the last five years. At the top left, the very first project is a gene network, followed by a network of IP addresses -- machines, servers -- followed by a network of Facebook friends. You probably couldn't find more disparate topics, yet they are using the same metaphor, the same visual model, to map the never-ending complexities of its own subject. And here are a few more examples of the many I've been collecting, of this growing visual taxonomy of networks.
Mas, mesmo sendo recente, essa metáfora da rede já está adotando várias formas e formatos e quase se tornando uma taxonomia visual dominante. Quase se tornando a sintaxe de uma nova linguagem. E esse aspecto realmente me fascina. Estas são, na verdade, 15 tipologias diferentes que venho coletando ao longo do tempo, que mostram a imensa diversidade visual dessa nova metáfora. Eis aqui um exemplo. Na parte de cima, temos uma convergência radial, um modelo de visualização que se tornou bastante popular nos últimos cinco anos. E, no alto, à esquerda, o primeiro projeto é uma rede de genes, seguida por uma rede de endereços IP, isto é, máquinas, servidores, seguida por uma rede de amigos no Facebook. Seria difícil encontrar tópicos mais díspares, mas, ainda assim, estão usando a mesma metáfora, o mesmo modelo visual, para mapear as complexidades ilimitadas do seu próprio objeto. E aqui estão mais alguns exemplos dos muitos que venho coletando dessa dominante taxonomia visual de redes.
But networks are not just a scientific metaphor. As designers, researchers, and scientists try to map a variety of complex systems, they are in many ways influencing traditional art fields, like painting and sculpture, and influencing many different artists. And perhaps because networks have this huge aesthetical force to them -- they're immensely gorgeous -- they are really becoming a cultural meme, and driving a new art movement, which I've called "networkism." And we can see this influence in this movement in a variety of ways. This is just one of many examples, where you can see this influence from science into art. The example on your left side is IP-mapping, a computer-generated map of IP addresses; again -- servers, machines. And on your right side, you have "Transient Structures and Unstable Networks" by Sharon Molloy, using oil and enamel on canvas. And here are a few more paintings by Sharon Molloy, some gorgeous, intricate paintings.
Mas redes não são apenas uma metáfora científica. Quando designers, pesquisadores e cientistas tentam mapear sistemas complexos diversos, eles também estão influenciando campos tradicionais da arte, como a pintura e a escultura, e influenciando diversos artistas. E, como talvez as redes tenham uma enorme força estética para eles, por serem deslumbrantes, elas estão se tornando um "meme" cultural e liderando um novo movimento, que chamei de "networkismo". E podemos ver a influência nesse movimento de diversas formas. Este é apenas um dos muitos exemplos em que podemos ver essa influência da ciência na arte. O exemplo do lado esquerdo é um mapeamento IP, um mapa de endereços IP gerado por computador, ou seja, servidores e máquinas. E, à sua direita, temos "Transient Structures and Unstable Networks", de Sharon Molloy, que usou óleo e esmalte sobre a tela. Aqui estão mais algumas pinturas de Sharon Molloy, pinturas lindas, intrincadas.
And here's another example of that interesting cross-pollination between science and art. On your left side, you have "Operation Smile." It is a computer-generated map of a social network. And on your right side, you have "Field 4," by Emma McNally, using only graphite on paper. Emma McNally is one of the main leaders of this movement, and she creates these striking, imaginary landscapes, where you can really notice the influence from traditional network visualization.
Aqui, um outro exemplo dessa interessante polinização cruzada entre a ciência e a arte. Do lado esquerdo, temos "Operation Smile". É um mapa, gerado por computador, de uma rede social. Do lado direito, temos "Field 4", de Emma McNally, usando apenas grafite sobre papel. Emma McNally é uma das principais líderes desse movimento, e ela cria essas paisagens imaginárias incríveis, nas quais podemos notar a influência da visualização em rede tradicional.
But networkism doesn't happen only in two dimensions. This is perhaps one of my favorite projects of this new movement. And I think the title really says it all -- it's called: "Galaxies Forming Along Filaments, Like Droplets Along the Strands of a Spider's Web." And I just find this particular project to be immensely powerful. It was created by Tomás Saraceno, and he occupies these large spaces, creates these massive installations using only elastic ropes. As you actually navigate that space and bounce along those elastic ropes, the entire network kind of shifts, almost like a real organic network would.
Mas o "networkismo" não acontece apenas em duas dimensões. Talvez este seja um dos meus projetos favoritos desse novo movimento. E acho que o título realmente diz tudo. O nome é "Galaxies Forming Along Filaments, Like Droplets Along the Strands of a Spider's Web". Este projeto em particular eu acho imensamente poderoso. Ele foi criado por Tomás Saraceno, que ocupa grandes espaços, cria essas instalações enormes usando apenas fios elásticos. À medida que se navega no espaço e se balança nesses fios elásticos, a rede inteira meio que muda, quase como uma rede orgânica real faria.
And here's yet another example of networkism taken to a whole different level. This was created by Japanese artist Chiharu Shiota in a piece called "In Silence." And Chiharu, like Tomás Saraceno, fills these rooms with this dense network, this dense web of elastic ropes and black wool and thread, sometimes including objects, as you can see here, sometimes even including people, in many of her installations.
Eis aqui um outro exemplo do "networkismo" levado a um nível completamente diferente. Isso foi criado pela artista japonesa Chiharu Shiota numa peça chamada "In Silence". E Chiharu, como Tomás Saraceno, enche salas com essa rede densa, esta teia densa de fios elásticos e de lã e linha pretas, algumas vezes incluindo objetos, como podem ver aqui, às vezes incluindo até pessoas em muitas das instalações.
But networks are also not just a new trend, and it's too easy for us to dismiss it as such. Networks really embody notions of decentralization, of interconnectedness, of interdependence. And this new way of thinking is critical for us to solve many of the complex problems we are facing nowadays, from decoding the human brain, to understanding the vast universe out there. On your left side, you have a snapshot of a neural network of a mouse -- very similar to our own at this particular scale. And on your right side, you have the Millennium Simulation. It was the largest and most realistic simulation of the growth of cosmic structure. It was able to recreate the history of 20 million galaxies in approximately 25 terabytes of output. And coincidentally or not, I just find this particular comparison between the smallest scale of knowledge -- the brain -- and the largest scale of knowledge -- the universe itself -- to be really quite striking and fascinating. Because as Bruce Mau once said, "When everything is connected to everything else, for better or for worse, everything matters."
Mas as redes não são apenas uma nova tendência, e é muito fácil para nós rejeitá-las como tais. As redes encarnam realmente noções de descentralização, de interconexão, de interdependência. E essa nova forma de pensar é fundamental para resolvermos muitos dos complexos problemas que enfrentamos atualmente, desde decodificar o cérebro humano até entender o vasto universo aí fora. No lado esquerdo, temos a imagem da rede neural de um camundongo, muito similar à nossa própria nessa mesma escala. E, no lado direito, temos a Simulação do Milênio. Foi a maior e mais realista simulação do crescimento da estrutura cósmica. Foi capaz de recriar a história de 20 milhões de galáxias com aproximadamente 25 terabytes de dados. E, coincidentemente ou não, acho em especial essa comparação entre a menor escala do conhecimento, o cérebro, e a maior escala do conhecimento, o próprio universo, muito impressionante e fascinante. Pois, como uma vez Bruce Mau disse: "Quando tudo está conectado a todo o resto, para o bem ou para o mal, tudo importa".
Thank you so much.
Muito obrigado.
(Applause)
(Aplausos)