Over the past 10 years, I've been researching the way people organize and visualize information. And I've noticed an interesting shift.
Od 10 lat badam sposób porządkowania i przedstawiania informacji. Widzę interesującą zmianę.
For a long period of time, we believed in a natural ranking order in the world around us, also known as the great chain of being, or "Scala naturae" in Latin, a top-down structure that normally starts with God at the very top, followed by angels, noblemen, common people, animals, and so on. This idea was actually based on Aristotle's ontology, which classified all things known to man in a set of opposing categories, like the ones you see behind me. But over time, interestingly enough, this concept adopted the branching schema of a tree in what became known as the Porphyrian tree, also considered to be the oldest tree of knowledge.
Przez długi czas wierzyliśmy w naturalny porządek otaczającego nas świata, znany również jako wielki łańcuch bytu, a w łacinie jako "scala naturae". To pionowa struktura z Bogiem na szczycie. Za nim byli aniołowie, szlachta, pospólstwo, zwierzęta i tak dalej. Koncept ten pochodził z ontologii Arystotelesa. Całą wiedzę ułożono w szereg przeciwstawnych kategorii. Tak jak na ekranie za mną. Co ciekawe, z czasem idea przyjęła postać rozgałęzionego drzewa, znanego jako drzewo Porfiriusza, najstarszego znanego drzewa wiedzy.
The branching scheme of the tree was, in fact, such a powerful metaphor for conveying information that it became, over time, an important communication tool to map a variety of systems of knowledge. We can see trees being used to map morality, with the popular tree of virtues and tree of vices, as you can see here, with these beautiful illustrations from medieval Europe. We can see trees being used to map consanguinity, the various blood ties between people. We can also see trees being used to map genealogy, perhaps the most famous archetype of the tree diagram. I think many of you in the audience have probably seen family trees. Many of you probably even have your own family trees drawn in such a way. We can see trees even mapping systems of law, the various decrees and rulings of kings and rulers. And finally, of course, also a very popular scientific metaphor, we can see trees being used to map all species known to man. And trees ultimately became such a powerful visual metaphor because in many ways, they really embody this human desire for order, for balance, for unity, for symmetry.
Ten model miał tak wielką siłę oddziaływania, że stał się bardzo ważnym narzędziem komunikacji. Służył do obrazowania wielu gałęzi wiedzy. Użyto go do zobrazowania moralności pod znaną postacią drzewa cnót i wad, jak na tych przepięknych ilustracjach ze średniowiecznej Europy. Ten sam schemat zastosowano do przedstawienia więzów krwi. Najbardziej znanym przykładem tej systematyki jest drzewo genealogiczne. Prawdopodobnie wielu z was widziało już takie drzewa. Zapewne posiadacie własne drzewa rodowe. Nawet system prawny jest przedstawiany w ten sposób. Także różne dekrety i rozporządzenia królów i władców. Oczywiście motyw drzewa jest szeroko rozpowszechniony w nauce. Przedstawia wszystkie znane jej gatunki. Drzewa zostały silnym wizualnym symbolem, bo odzwierciedlały ludzkie pragnienia porządku, równowagi, jedności i symetrii.
However, nowadays we are really facing new complex, intricate challenges that cannot be understood by simply employing a simple tree diagram. And a new metaphor is currently emerging, and it's currently replacing the tree in visualizing various systems of knowledge. It's really providing us with a new lens to understand the world around us. And this new metaphor is the metaphor of the network. And we can see this shift from trees into networks in many domains of knowledge.
Teraźniejszość rzuca nam nowe złożone wyzwania. Nie można ich ująć w prostym diagramie drzewa. Nowa metafora powoli zastępuje poprzedni schemat w przedstawianiu wiedzy. Dostarcza nam nowych narzędzi do zrozumienia świata. Nowym symbolem jest sieć. Zmianę z drzewa na sieć widać w wielu dziedzinach wiedzy.
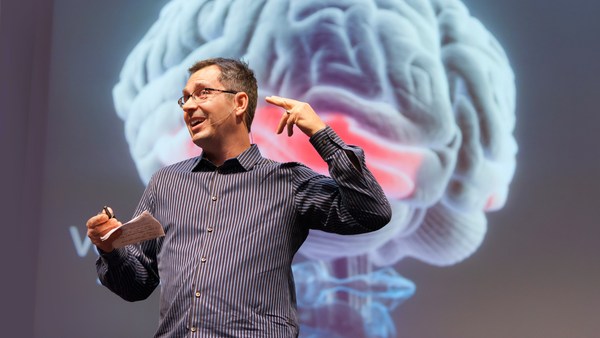
We can see this shift in the way we try to understand the brain. While before, we used to think of the brain as a modular, centralized organ, where a given area was responsible for a set of actions and behaviors, the more we know about the brain, the more we think of it as a large music symphony, played by hundreds and thousands of instruments. This is a beautiful snapshot created by the Blue Brain Project, where you can see 10,000 neurons and 30 million connections. And this is only mapping 10 percent of a mammalian neocortex. We can also see this shift in the way we try to conceive of human knowledge.
Jest widoczna w podejściu do zrozumienia mózgu. Przedtem widzieliśmy mózg jako modułowy, scentralizowany organ. Odpowiednie obszary odpowiadały za konkretne akcje i zachowania. Im więcej wiemy o działaniu mózgu, tym bardziej myślimy o nim jak o wielkiej symfonii granej przez tysiące instrumentów. Oto wpaniały obraz stworzony na potrzeby projektu Blue Brain. Widać tu 10 tysięcy neuronów i 30 milionów połączeń. A to tylko obraz 10% kory nowej ssaka. Zmianę da się również zauważyć w sposobie podejścia do wiedzy.
These are some remarkable trees of knowledge, or trees of science, by Spanish scholar Ramon Llull. And Llull was actually the precursor, the very first one who created the metaphor of science as a tree, a metaphor we use every single day, when we say, "Biology is a branch of science," when we say, "Genetics is a branch of science." But perhaps the most beautiful of all trees of knowledge, at least for me, was created for the French encyclopedia by Diderot and d'Alembert in 1751. This was really the bastion of the French Enlightenment, and this gorgeous illustration was featured as a table of contents for the encyclopedia. And it actually maps out all domains of knowledge as separate branches of a tree.
Istnieją ważne drzewa wiedzy i nauki stworzone przez uczonego Hiszpana - Rajmonda Llulla. Llull był właściwie pionierem. Jako pierwszy stworzył przenośnię nauki jako drzewa. Przenośni, której używamy codziennie, mówiąc: biologia jest gałęzią wiedzy, lub genetyka jest gałęzią wiedzy. Dla mnie najpiękniejsze drzewa wiedzy, drzewa Diderota i d'Alemberta, stworzono w 1751 roku na potrzeby encyklopedii francuskiej. Była to prawdziwa twierdza francuskiego oświecenia. Te wspaniałe ilustracje były spisem treści encyklopedii. Przedstawiały wszystkie dziedziny wiedzy jako osobne gałęzie drzewa.
But knowledge is much more intricate than this. These are two maps of Wikipedia showing the inter-linkage of articles -- related to history on the left, and mathematics on the right. And I think by looking at these maps and other ones that have been created of Wikipedia -- arguably one of the largest rhizomatic structures ever created by man -- we can really understand how human knowledge is much more intricate and interdependent, just like a network.
Lecz wiedza jest bardziej skomplikowana. Oto 2 diagramy Wikipedii przedstawiające powiązania artykułów. Na lewo między historycznymi, na prawo między matematycznymi. Patrząc na ten obraz i inne stworzone na Wikipedii, bezsprzecznie największej stworzonej strukturze rizomatycznej, rozumiemy teraz, jak bardzo złożona i współzależna jest wiedza - właśnie jak sieć.
We can also see this interesting shift in the way we map social ties between people. This is the typical organization chart. I'm assuming many of you have seen a similar chart as well, in your own corporations, or others. It's a top-down structure that normally starts with the CEO at the very top, and where you can drill down all the way to the individual workmen on the bottom. But humans sometimes are, well, actually, all humans are unique in their own way, and sometimes you really don't play well under this really rigid structure.
Interesującą zmiana zaszła w sposobie obrazowania powiązań społecznych. Oto typowy diagram organizacji. Wielu z was widziało już podobne diagramy w swoich lub innych korporacjach. Pionowa struktura, na której szczycie stoi CEO. Możemy dojechać w dół do pojedynczych pracowników. Jednak wszyscy ludzie są wyjątkowi. Taka sztywna struktura czasami się nie sprawdza.
I think the Internet is really changing this paradigm quite a lot. This is a fantastic map of online social collaboration between Perl developers. Perl is a famous programming language, and here, you can see how different programmers are actually exchanging files, and working together on a given project. And here, you can notice that this is a completely decentralized process -- there's no leader in this organization, it's a network.
Moim zdaniem, Internet zmienia postrzeganie tego paradygmatu. Oto fantastyczny diagram współpracy online między deweloperami Perl. Perl to słynny język programowania. Widzimy, jak różni programiści wymieniają się plikami i jak pracują nad danym projektem. Tutaj widać, że to proces bardzo zdecentralizowany. Nie ma tu przywódcy. To sieć.
We can also see this interesting shift when we look at terrorism. One of the main challenges of understanding terrorism nowadays is that we are dealing with decentralized, independent cells, where there's no leader leading the whole process. And here, you can actually see how visualization is being used. The diagram that you see behind me shows all the terrorists involved in the Madrid attack in 2004. And what they did here is, they actually segmented the network into three different years, represented by the vertical layers that you see behind me. And the blue lines tie together the people that were present in that network year after year. So even though there's no leader per se, these people are probably the most influential ones in that organization, the ones that know more about the past, and the future plans and goals of this particular cell.
Tę samą ciekawą zmianę widać na przykładzie terroryzmu. Dzisiaj głównym wyzwaniem w rozumieniu terroryzmu jest fakt, że opiera się on na niezależnych komórkach, bez przywódcy, który przewodziłby całości. Oto przykład wykorzystania wizualizacji. Diagram za moimi plecami pokazuje terrorystów odpowiedzialnych za atak w Madrycie w 2004 roku. Sieć podzielono na 3 fragmenty reprezentujące poszczególne lata. Pojedyncza pozioma płaszczyzna przedstawia jeden rok. Niebieskie linie łączą ludzi, którzy uczestniczyli w sieci rok po roku. Choć nie ma tu jako takiego przywódcy, ci ludzie mają chyba najwięcej wpływu na organizację. To oni wiedzą najwięcej o przeszłych i przyszłych planach danej komórki.
We can also see this shift from trees into networks in the way we classify and organize species. The image on the right is the only illustration that Darwin included in "The Origin of Species," which Darwin called the "Tree of Life." There's actually a letter from Darwin to the publisher, expanding on the importance of this particular diagram. It was critical for Darwin's theory of evolution. But recently, scientists discovered that overlaying this tree of life is a dense network of bacteria, and these bacteria are actually tying together species that were completely separated before, to what scientists are now calling not the tree of life, but the web of life, the network of life.
Zmianę z drzewa w sieć widać w sposobie klasyfikacji gatunków. Po prawej widzimy jedyną ilustrację z książki Darwina "O pochodzeniu gatunków". Darwin nazwał to "drzewem życia". Zachował się list Darwina do wydawcy podkreślający znaczenie tego diagramu. Był on kluczowy w rozumieniu teorii ewolucji. Ostatnio naukowcy odkryli, że pod drzewem życia leży gęsta sieć bakterii. Łączą one gatunki, które przedtem były zupełnie oddzielone. Zamiast drzewa życia mamy teraz sieć życia.
And finally, we can really see this shift, again, when we look at ecosystems around our planet. No more do we have these simplified predator-versus-prey diagrams we have all learned at school. This is a much more accurate depiction of an ecosystem. This is a diagram created by Professor David Lavigne, mapping close to 100 species that interact with the codfish off the coast of Newfoundland in Canada. And I think here, we can really understand the intricate and interdependent nature of most ecosystems that abound on our planet.
Zmianę widać również w sposobie, w jakim postrzegamy cały ekosystem. Nie posługujemy się już uproszczonym wykresem drapieżca-ofiara, o którym słyszeliśmy w szkole. Teraz mamy bardziej odpowiednie narzędzie. Oto diagram profesora Dawida Lavigne: 100 gatunków, które mają styczność z dorszami z Nowej Fundlandii w Kanadzie. Pokazuje nam to złożoność natury większości ekosystemów na naszej planecie.
But even though recent, this metaphor of the network, is really already adopting various shapes and forms, and it's almost becoming a growing visual taxonomy. It's almost becoming the syntax of a new language. And this is one aspect that truly fascinates me. And these are actually 15 different typologies I've been collecting over time, and it really shows the immense visual diversity of this new metaphor. And here is an example. On the very top band, you have radial convergence, a visualization model that has become really popular over the last five years. At the top left, the very first project is a gene network, followed by a network of IP addresses -- machines, servers -- followed by a network of Facebook friends. You probably couldn't find more disparate topics, yet they are using the same metaphor, the same visual model, to map the never-ending complexities of its own subject. And here are a few more examples of the many I've been collecting, of this growing visual taxonomy of networks.
Choć metafora sieci jest w użyciu od niedawna, już teraz przyjmuje najróżniejsze formy. Staje się niemal wizualną taksonomią, prawie składnią nowego języka. Właśnie ten aspekt najbardziej mnie fascynuje. Oto 15 różnych klasyfikacji, zebranych przeze mnie w ostatnich latach, które naprawdę ukazują ogromną wizualną różnorodność nowej przenośni. Oto przykład. W najwyższym rzędzie widać promienistą konwergencję. Model ten stał się bardzo popularny w ciągu ostatnich 5 lat. Pierwszy projekt na górze po lewej to sieć genów, obok sieć adresów IP, maszyn, serwerów, a potem sieć znajomych na Facebooku. Chyba trudno znaleźć bardziej oderwane tematy, a jednak używają tej samej metafory, tego samego modelu wizualnego do zobrazowania nieskończonej złożoności tematu. Mamy tutaj kilka przykładów z wielu, które zebrałem, aby przedstawić rosnącą, wizualną taksonomię sieci.
But networks are not just a scientific metaphor. As designers, researchers, and scientists try to map a variety of complex systems, they are in many ways influencing traditional art fields, like painting and sculpture, and influencing many different artists. And perhaps because networks have this huge aesthetical force to them -- they're immensely gorgeous -- they are really becoming a cultural meme, and driving a new art movement, which I've called "networkism." And we can see this influence in this movement in a variety of ways. This is just one of many examples, where you can see this influence from science into art. The example on your left side is IP-mapping, a computer-generated map of IP addresses; again -- servers, machines. And on your right side, you have "Transient Structures and Unstable Networks" by Sharon Molloy, using oil and enamel on canvas. And here are a few more paintings by Sharon Molloy, some gorgeous, intricate paintings.
Sieci nie są wyłącznie naukową metaforą. Gdy projektanci, badacze i naukowcy próbują przedstawić różnorodność systemów, na wiele sposobów oddziałują na tradycyjne dziedziny sztuki, jak malarstwo i rzeźba, a także wpływają na różnych artystów. Ponieważ sieci mają ogromną estetyczną moc - są niesamowicie piękne - naprawdę stają się kulturową ikoną, napędzając nowy ruch artystyczny, który nazwałem: "networkizmem". Wpływ ten widać na wiele sposobów. To tylko jeden z wielu przykładów, gdzie wpływ nauki widoczny jest w sztuce. Przykład po lewej stronie to IP-mapping, wygenerowany przez komputer schemat IP; ponownie - serwery, maszyny. Po prawej stronie, "Struktury chwilowe i sieci niestabilne" autorstwa Sharon Molloy, farba olejna i emalia na płótnie. Oto kolejne obrazy Sharon Molloy, przepiękne, misterne dzieła.
And here's another example of that interesting cross-pollination between science and art. On your left side, you have "Operation Smile." It is a computer-generated map of a social network. And on your right side, you have "Field 4," by Emma McNally, using only graphite on paper. Emma McNally is one of the main leaders of this movement, and she creates these striking, imaginary landscapes, where you can really notice the influence from traditional network visualization.
A tu kolejny interesujący przykład zapylania krzyżowego między nauką a sztuką. Po lewej stronie "Operacja Uśmiech". To wygenerowana przez komputer mapa sieci społecznej. Po prawej stronie "Pole 4" autorstwa Emmy McNally, namalowane wyłącznie grafitem. Emma McNally jest jedną z liderek tego ruchu i tworzy uderzająco wymyślne krajobrazy, gdzie wyraźnie widać wpływ tradycyjnej wizualizacji sieci.
But networkism doesn't happen only in two dimensions. This is perhaps one of my favorite projects of this new movement. And I think the title really says it all -- it's called: "Galaxies Forming Along Filaments, Like Droplets Along the Strands of a Spider's Web." And I just find this particular project to be immensely powerful. It was created by Tomás Saraceno, and he occupies these large spaces, creates these massive installations using only elastic ropes. As you actually navigate that space and bounce along those elastic ropes, the entire network kind of shifts, almost like a real organic network would.
Networkizm widać nie tylko na tych dwóch płaszczyznach. To jest prawdopodobnie jeden z moich ulubionych projektów tego nowego ruchu. Nazwa naprawdę wyraża wszystko: "Galaktyki formowane wzdłuż włókien, jak kropelki wzdłuż pasm pajęczej sieci". To projekt o niezwykłej potędze. Został stworzony przez Tomása Saraceno, który zajmuje tę ogromną przestrzeń, tworząc rozległe instalacje wyłącznie przy użyciu elastycznych linek. Gdy widz przemieszcza się i odbija od tej elastycznej konstrukcji, całe dzieło w pewien sposób zmienia się, jak prawdziwa, organiczna sieć.
And here's yet another example of networkism taken to a whole different level. This was created by Japanese artist Chiharu Shiota in a piece called "In Silence." And Chiharu, like Tomás Saraceno, fills these rooms with this dense network, this dense web of elastic ropes and black wool and thread, sometimes including objects, as you can see here, sometimes even including people, in many of her installations.
Oto kolejny przykład networkizmu na kompletnie innym poziomie. Projekt ten stworzony został przez japońską artystkę Chiharu Shiota i nazywa się "W ciszy". Chiharu, tak jak Tomás Saraceno, wypełnia przestrzenie gęstymi sieciami, gęstymi pajęczynami elastycznych lin, czarnej wełny i nici, czasami włączając w to obiekty jak te tutaj, czasami nawet angażując ludzi.
But networks are also not just a new trend,
[Alinearność, decentralizacja współzależność, wielość]
and it's too easy for us to dismiss it as such. Networks really embody notions of decentralization, of interconnectedness, of interdependence. And this new way of thinking is critical for us to solve many of the complex problems we are facing nowadays, from decoding the human brain, to understanding the vast universe out there. On your left side, you have a snapshot of a neural network of a mouse -- very similar to our own at this particular scale. And on your right side, you have the Millennium Simulation. It was the largest and most realistic simulation of the growth of cosmic structure. It was able to recreate the history of 20 million galaxies in approximately 25 terabytes of output. And coincidentally or not, I just find this particular comparison between the smallest scale of knowledge -- the brain -- and the largest scale of knowledge -- the universe itself -- to be really quite striking and fascinating. Because as Bruce Mau once said, "When everything is connected to everything else, for better or for worse, everything matters."
Sieci to nie tylko nowy trend, byłoby zbyt proste tym je zbyć. Sieci odzwierciedlają pojęcie decentralizacji, połączenia i współzależności. Ten nowy sposób myślenia jest kluczowy, do rozwiązania wielu skomplikowanych problemów współczesnego świata, od zrozumienia ludzkiego mózgu do pojęcia otaczającego nas ogromnego wszechświata. Po lewej stronie zdjęcie sieci neuronowej myszy, w tej skali bardzo przypomina naszą. Po prawej stronie Symulacja Tysiąclecia. Była to największa, najbardziej realistyczna symulacja wzrostu struktur kosmicznych. Umożliwiła odtworzenie historii 20 milionów galaktyk w postaci około 25 terabajtów. Przypadkiem czy też nie, uważam to konkretne porównanie między najmniejszą skalą wiedzy, jaką jest mózg, a jej największą skalą - wszechświatem, za uderzająco fascynujące. Tak jak powiedział Bruce Mau, "Jeśli wszystko łączy się ze wszystkim, wtedy, na dobre i na złe, wszystko ma znaczenie".
Thank you so much.
Dziękuję bardzo.
(Applause)
(Brawa)