Over the past 10 years, I've been researching the way people organize and visualize information. And I've noticed an interesting shift.
De laatste 10 jaar onderzoek ik de manier waarop mensen informatie organiseren en visualiseren. En ik zag een interessante verandering.
For a long period of time, we believed in a natural ranking order in the world around us, also known as the great chain of being, or "Scala naturae" in Latin, a top-down structure that normally starts with God at the very top, followed by angels, noblemen, common people, animals, and so on. This idea was actually based on Aristotle's ontology, which classified all things known to man in a set of opposing categories, like the ones you see behind me. But over time, interestingly enough, this concept adopted the branching schema of a tree in what became known as the Porphyrian tree, also considered to be the oldest tree of knowledge.
Lange tijd geloofden we in een hiërarchische orde in de wereld om ons heen, bekend als de lange keten van zijn, of 'Scala naturae' in het latijn. Dit is een top-downstructuur die normaal begint met God bovenaan, gevolgd door engelen, edelen, burgers, dieren enzovoort. Het idee was gebaseerd op de ontologie van Aristoteles, die alles wat de mens weet, classificeert in verschillende categorieën, zoals die je hier achter me ziet. Maar interessant genoeg nam dit concept geleidelijk de vorm aan van een boom met takken, ook bekend als de boom van Porphyrius, die beschouwd wordt als de oudste boom van kennis.
The branching scheme of the tree was, in fact, such a powerful metaphor for conveying information that it became, over time, an important communication tool to map a variety of systems of knowledge. We can see trees being used to map morality, with the popular tree of virtues and tree of vices, as you can see here, with these beautiful illustrations from medieval Europe. We can see trees being used to map consanguinity, the various blood ties between people. We can also see trees being used to map genealogy, perhaps the most famous archetype of the tree diagram. I think many of you in the audience have probably seen family trees. Many of you probably even have your own family trees drawn in such a way. We can see trees even mapping systems of law, the various decrees and rulings of kings and rulers. And finally, of course, also a very popular scientific metaphor, we can see trees being used to map all species known to man. And trees ultimately became such a powerful visual metaphor because in many ways, they really embody this human desire for order, for balance, for unity, for symmetry.
Het vertakkende schema van de boom was in feite een dermate sterke metafoor voor het overbrengen van informatie dat het geleidelijk een belangrijk communicatiemiddel werd om verschillende kennissystemen te tonen. We zien boomstructuren om moraliteit te verbeelden, met de populaire boom van deugden en boom van ondeugden, zoals je hier ziet, met deze mooie illustraties uit middeleeuws Europa. We zien boomstructuren om bloedverwantschap te tonen, de bloedbanden tussen mensen. Ook zien we boomstructuren om genealogie te tonen, misschien wel het bekendste gebruik van het boomdiagram. Ik denk dat velen hier in het publiek een stamboom hebben gezien. Velen hebben hun eigen stamboom op die manier opgemaakt. We zien boomstructuren zelfs in systemen van wetgeving, de verschillende regels en wetten van koningen en heersers. En tenslotte, natuurlijk, als populaire wetenschappelijke metafoor, zien we boomstructuren om alle bekende soorten te tonen. Boomstructuren werden zulke sterke visuele metaforen omdat ze op veel manieren de menselijke behoefte belichamen aan orde, balans, eenheid en symmetrie.
However, nowadays we are really facing new complex, intricate challenges that cannot be understood by simply employing a simple tree diagram. And a new metaphor is currently emerging, and it's currently replacing the tree in visualizing various systems of knowledge. It's really providing us with a new lens to understand the world around us. And this new metaphor is the metaphor of the network. And we can see this shift from trees into networks in many domains of knowledge.
Maar tegenwoordig zien we nieuwe complexe, samenhangende uitdagingen, die niet in een simpel boomdiagram passen. Nu verrijst een nieuwe metafoor en is bezig de boomstructuur te vervangen om de verschillende kennissystemen te verbeelden. Het biedt ons een nieuwe lens om de wereld om ons heen te begrijpen. Deze nieuwe metafoor is de metafoor van het netwerk. We zien deze verandering van bomen naar netwerken in veel kennissectoren.
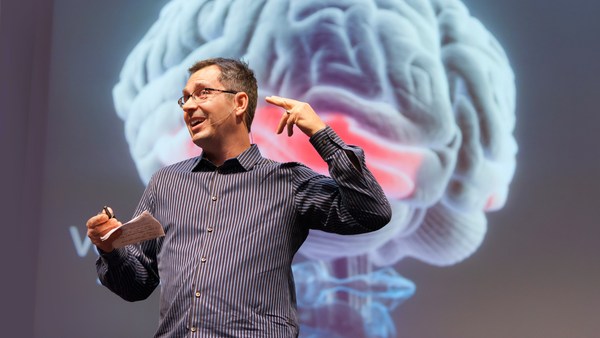
We can see this shift in the way we try to understand the brain. While before, we used to think of the brain as a modular, centralized organ, where a given area was responsible for a set of actions and behaviors, the more we know about the brain, the more we think of it as a large music symphony, played by hundreds and thousands of instruments. This is a beautiful snapshot created by the Blue Brain Project, where you can see 10,000 neurons and 30 million connections. And this is only mapping 10 percent of a mammalian neocortex. We can also see this shift in the way we try to conceive of human knowledge.
We zien deze verandering in hoe we het brein willen begrijpen. Vroeger keken we naar de hersenen als een modulair, gecentraliseerd orgaan, waarin elk gebied verantwoordelijk was voor bepaalde acties en handelingen. Hoe meer we weten over het brein, hoe meer we het zien als een grote muzikale symfonie, gespeeld door honderden of duizenden instrumenten. Dit is een mooie foto, gemaakt door het Blue Brain Project, waarop je 10.000 neuronen en 30 miljoen verbindingen ziet. En we zien maar 10 procent van een neocortex van een zoogdier. We zien deze verandering ook in hoe we menselijke kennis zien.
These are some remarkable trees of knowledge, or trees of science, by Spanish scholar Ramon Llull. And Llull was actually the precursor, the very first one who created the metaphor of science as a tree, a metaphor we use every single day, when we say, "Biology is a branch of science," when we say, "Genetics is a branch of science." But perhaps the most beautiful of all trees of knowledge, at least for me, was created for the French encyclopedia by Diderot and d'Alembert in 1751. This was really the bastion of the French Enlightenment, and this gorgeous illustration was featured as a table of contents for the encyclopedia. And it actually maps out all domains of knowledge as separate branches of a tree.
Dit zijn opmerkelijke kennisbomen, boomstructuren van de wetenschap, door de Spaanse wetenschapper Ramon Llull. Llull was de voorloper, de allereerste die de metafoor van kennis als een boom creëerde, een metafoor die we dagelijks gebruiken, als we zeggen: "Biologie is een wetenschapstak", wanneer we zeggen: "Genetica is een wetenschapstak." Maar misschien de mooiste van alle kennisbomen, tenminste voor mij, is gemaakt voor de Franse encyclopedie door Diderot en d'Alembert in 1751. Het was het bastion van Franse Verlichting, en deze schitterende illustratie is de inhoudsopgave van de encyclopedie. Het verbeeldt de kennisdomeinen als aparte takken van een boom.
But knowledge is much more intricate than this. These are two maps of Wikipedia showing the inter-linkage of articles -- related to history on the left, and mathematics on the right. And I think by looking at these maps and other ones that have been created of Wikipedia -- arguably one of the largest rhizomatic structures ever created by man -- we can really understand how human knowledge is much more intricate and interdependent, just like a network.
Maar kennis is veel ingewikkelder. Dit zijn 2 kaarten van Wikipedia die verwijzingen tussen artikelen tonen-- links over geschiedenis en rechts over wiskunde. Door te kijken naar deze en andere kaarten die zijn gemaakt over Wikipedia -- een van de grootste rhizomatische structuren door mensen gemaakt -- kunnen we begrijpen hoe menselijke kennis veel complexer en onderling afhankelijk is, net als een netwerk.
We can also see this interesting shift in the way we map social ties between people. This is the typical organization chart. I'm assuming many of you have seen a similar chart as well, in your own corporations, or others. It's a top-down structure that normally starts with the CEO at the very top, and where you can drill down all the way to the individual workmen on the bottom. But humans sometimes are, well, actually, all humans are unique in their own way, and sometimes you really don't play well under this really rigid structure.
We zien deze interessante verandering ook in hoe we sociale contacten tussen mensen in kaart brengen. Hier is een typische organogram. Ik ga ervan uit dat jullie zo'n kaart hebben gezien, voor bedrijven en organisaties. Het is een hiërarchische structuur met bovenaan normaliter de CEO, die je naar beneden kan volgen, tot op de individuele werkers. Maar mensen zijn soms -- eigenlijk zijn alle mensen uniek op hun manier, en soms kun je niet goed werken in zo'n rigide structuur.
I think the Internet is really changing this paradigm quite a lot. This is a fantastic map of online social collaboration between Perl developers. Perl is a famous programming language, and here, you can see how different programmers are actually exchanging files, and working together on a given project. And here, you can notice that this is a completely decentralized process -- there's no leader in this organization, it's a network.
Ik denk dat het internet dit denkkader aan het veranderen is. Dit is een fantastische kaart van online sociale samenwerking tussen Perl-ontwikkelaars. Perl is een bekende programmeertaal, en hier zie je hoe verschillende programmeurs bestanden uitwisselen en samenwerken in bepaalde projecten. Hier zie je: het is een volledig gedecentraliseerd proces -- er is geen leider in de organisatie, het is een netwerk.
We can also see this interesting shift when we look at terrorism. One of the main challenges of understanding terrorism nowadays is that we are dealing with decentralized, independent cells, where there's no leader leading the whole process. And here, you can actually see how visualization is being used. The diagram that you see behind me shows all the terrorists involved in the Madrid attack in 2004. And what they did here is, they actually segmented the network into three different years, represented by the vertical layers that you see behind me. And the blue lines tie together the people that were present in that network year after year. So even though there's no leader per se, these people are probably the most influential ones in that organization, the ones that know more about the past, and the future plans and goals of this particular cell.
We zien deze verandering ook in terrorisme. Een van de uitdagingen in het begrijpen van terrorisme is tegenwoordig dat we te maken hebben met gedecentraliseerde, onafhankelijke cellen, waar er geen leiding is over het gehele proces. Hier zie je hoe visualisatie wordt gebruikt. Dit diagram achter me laat alle terroristen zien van de aanval in Madrid in 2004. Hier hebben ze het netwerk opgedeeld in 3 verschillende jaren, uitgebeeld door de verticale lagen die je hier ziet. De blauwe lijnen verbinden de mensen die elk jaar aanwezig waren in het netwerk. Dus zelfs al is er geen echte leider, deze mensen zijn waarschijnlijk de invloedrijkste in de organisatie. Zij weten het meest over het verleden en de toekomstige doelen van deze cel.
We can also see this shift from trees into networks in the way we classify and organize species. The image on the right is the only illustration that Darwin included in "The Origin of Species," which Darwin called the "Tree of Life." There's actually a letter from Darwin to the publisher, expanding on the importance of this particular diagram. It was critical for Darwin's theory of evolution. But recently, scientists discovered that overlaying this tree of life is a dense network of bacteria, and these bacteria are actually tying together species that were completely separated before, to what scientists are now calling not the tree of life, but the web of life, the network of life.
We kunnen de verandering van bomen naar netwerken ook zien in hoe we soorten classificeren en organiseren. Het beeld rechts is de enige illustratie die Darwin plaatste in zijn 'De oorsprong der soorten'. Darwin noemde die de 'Levensboom'. Er is een brief van Darwin aan zijn uitgever, die het belang van dit diagram uitlegde. Het was cruciaal voor Darwin's evolutieleer. De laatste tijd ontdekken wetenschappers dat bovenop deze levensboom een netwerk van bacteriën ligt, en deze bacteriën voegen soorten samen die eerder volledig apart waren, in wat wetenschappers niet een 'levensboom' noemen maar het 'levensweb', het netwerk van het leven.
And finally, we can really see this shift, again, when we look at ecosystems around our planet. No more do we have these simplified predator-versus-prey diagrams we have all learned at school. This is a much more accurate depiction of an ecosystem. This is a diagram created by Professor David Lavigne, mapping close to 100 species that interact with the codfish off the coast of Newfoundland in Canada. And I think here, we can really understand the intricate and interdependent nature of most ecosystems that abound on our planet.
En als laatste kunnen we deze verandering weer zien in de ecosystemen op onze planeet. We hebben niet meer het simpele roofdier-prooi-diagram dat we leerden op school. Dit is een meer accurate weergave van een ecosysteem. Dit diagram is gemaakt door professor David Lavigne. Het brengt bijna 100 soorten in kaart die met de kabeljauw in contact staan voor de kust van Newfoundland in Canada. Ik denk dat we hierdoor kunnen begrijpen hoe ingewikkeld en samenhangend de meeste ecosystemen op onze planeet zijn.
But even though recent, this metaphor of the network, is really already adopting various shapes and forms, and it's almost becoming a growing visual taxonomy. It's almost becoming the syntax of a new language. And this is one aspect that truly fascinates me. And these are actually 15 different typologies I've been collecting over time, and it really shows the immense visual diversity of this new metaphor. And here is an example. On the very top band, you have radial convergence, a visualization model that has become really popular over the last five years. At the top left, the very first project is a gene network, followed by a network of IP addresses -- machines, servers -- followed by a network of Facebook friends. You probably couldn't find more disparate topics, yet they are using the same metaphor, the same visual model, to map the never-ending complexities of its own subject. And here are a few more examples of the many I've been collecting, of this growing visual taxonomy of networks.
Maar hoe recent deze metafoor van het netwerk ook is, hij is al verschillende vormen aan het aannemen, als een groeiende visuele taxonomie. Het wordt bijna de syntax van een nieuwe taal. En dit is een aspect dat me fascineert. Dit zijn 15 verschillende onderverdelingen die ik in de loop der tijden verzamelde. Het toont de immense visuele diversiteit van deze nieuwe metafoor. Dit is voorbeeld. Helemaal bovenaan, zie je 'radiale convergentie', een visualisatiemodel dat populair is geworden in de laatste 5 jaar. Het allereerste project, linksboven, is een genen-netwerk, gevolgd door een netwerk van IP-adressen -- machines, servers -- gevolgd door een netwerk van Facebook-vrienden. Het zijn de meest uiteenlopende onderwerpen, en toch gebruiken ze dezelfde metafoor, hetzelfde visuele model om de nooit eindigende complexiteit van hun eigen onderwerp te tonen. Hier zijn meer voorbeelden van mijn verzameling, van deze groeiende visuele taxonomie van netwerken.
But networks are not just a scientific metaphor. As designers, researchers, and scientists try to map a variety of complex systems, they are in many ways influencing traditional art fields, like painting and sculpture, and influencing many different artists. And perhaps because networks have this huge aesthetical force to them -- they're immensely gorgeous -- they are really becoming a cultural meme, and driving a new art movement, which I've called "networkism." And we can see this influence in this movement in a variety of ways. This is just one of many examples, where you can see this influence from science into art. The example on your left side is IP-mapping, a computer-generated map of IP addresses; again -- servers, machines. And on your right side, you have "Transient Structures and Unstable Networks" by Sharon Molloy, using oil and enamel on canvas. And here are a few more paintings by Sharon Molloy, some gorgeous, intricate paintings.
Maar netwerken zijn meer dan een wetenschappelijke metafoor. Ontwerpers, onderzoekers, wetenschappers, brengen complexe systemen in kaart. Hierdoor beïnvloeden ze traditionele kunstvormen als schilderen en beeldhouwen en beïnvloeden veel verschillende kunstenaars. En misschien omdat netwerken grote esthetische kracht op hen uitoefenen --ze zijn tenslotte schitterend-- worden ze een culturele 'meme', en voeden een nieuwe kunststroming die ik 'netwerkisme' noem. We zien deze invloed op deze beweging op verschillende manieren, Dit is maar een van vele voorbeelden, waar je deze invloed van wetenschap op kunst kan zien. Het voorbeeld links is een IP-kaart, een computergegenereerde kaart van IP-adressen: servers, machines. En rechts zie je 'Vergankelijke structuren en instabiele netwerken' van Sharon Molloy, olieverf en emaille op canvas. Hier zijn nog wat schilderijen van Sharon Molloy. schitterende, ingewikkelde schilderijen.
And here's another example of that interesting cross-pollination between science and art. On your left side, you have "Operation Smile." It is a computer-generated map of a social network. And on your right side, you have "Field 4," by Emma McNally, using only graphite on paper. Emma McNally is one of the main leaders of this movement, and she creates these striking, imaginary landscapes, where you can really notice the influence from traditional network visualization.
Het is nog een voorbeeld van zo'n interessante kruisbestuiving tussen wetenschap en kunst. Links zie je 'Operatie glimlach'. Een computergegenereerde kaart van een social netwerk. Rechts zie je 'Veld 4' van Emma McNally, gemaakt met enkel grafiet op papier. Emma McNally is een van de leiders van deze beweging. Ze maakte schitterende denkbeeldige landschappen, waar je de invloed van traditionele netwerk-visualisaties kan zien.
But networkism doesn't happen only in two dimensions. This is perhaps one of my favorite projects of this new movement. And I think the title really says it all -- it's called: "Galaxies Forming Along Filaments, Like Droplets Along the Strands of a Spider's Web." And I just find this particular project to be immensely powerful. It was created by Tomás Saraceno, and he occupies these large spaces, creates these massive installations using only elastic ropes. As you actually navigate that space and bounce along those elastic ropes, the entire network kind of shifts, almost like a real organic network would.
Maar netwerkisme heeft meer dan 2 dimensies. Dit is een van mijn favoriete projecten van deze nieuwe beweging. Ik denk dat de titel alles zegt -- het heet: 'Zonnestelsels vormen zich rond vezels, zoals druppels rond de draden van een spinnenweb.' Ik vond juist dit project ontzettend krachtig. Het was gemaakt door Tomás Saraceno. Deze neemt grote ruimtes in beslag met immense installaties gemaakt van enkel elastische kabels. Terwijl je deze ruimte doorkruist en die elastieken aanraakt, beweegt het hele netwerk, bijna zoals een echt organisch netwerk zou doen.
And here's yet another example of networkism taken to a whole different level. This was created by Japanese artist Chiharu Shiota in a piece called "In Silence." And Chiharu, like Tomás Saraceno, fills these rooms with this dense network, this dense web of elastic ropes and black wool and thread, sometimes including objects, as you can see here, sometimes even including people, in many of her installations.
En hier is nog een voorbeeld dat netwerkisme naar een heel ander niveau tilt. Dit is gemaakt door de Japanse kunstenaar Chiharu Shiota. Het stuk heet 'In stilte'. Chiharu, net als Tomás Saraceno, vult kamers met een dicht netwerk, een dicht web van elastische kabels, zwarte wol en draad, soms met objecten zoals hier, soms zelfs met mensen, in veel van haar installaties.
But networks are also not just a new trend, and it's too easy for us to dismiss it as such. Networks really embody notions of decentralization, of interconnectedness, of interdependence. And this new way of thinking is critical for us to solve many of the complex problems we are facing nowadays, from decoding the human brain, to understanding the vast universe out there. On your left side, you have a snapshot of a neural network of a mouse -- very similar to our own at this particular scale. And on your right side, you have the Millennium Simulation. It was the largest and most realistic simulation of the growth of cosmic structure. It was able to recreate the history of 20 million galaxies in approximately 25 terabytes of output. And coincidentally or not, I just find this particular comparison between the smallest scale of knowledge -- the brain -- and the largest scale of knowledge -- the universe itself -- to be really quite striking and fascinating. Because as Bruce Mau once said, "When everything is connected to everything else, for better or for worse, everything matters."
Maar netwerken zijn niet slechts een nieuwe trend, en het is te makkelijk om ze zo weg te zetten. Netwerken belichamen decentralisatie, interconnectiviteit en onderlinge afhankelijkheid. En deze nieuwe manier van denken is heel belangrijk bij het oplossen van veel complexe problemen die we tegenwoordig zien, van het ontcijferen van het menselijk brein, tot het begrijpen van het immense heelal. Links zie je een foto van een neuraal netwerk van een muis -- vergelijkbaar met dat van ons op dit niveau. En rechts zie je de Millennium-simulatie. Het was de grootste en meest realistische simulatie van de groei van de kosmos. Het kon de geschiedenis van 20 miljoen sterrenstelsels nabootsen in ongeveer 25 terabyte uitvoer. Toevallig of niet, ik vind deze specifieke vergelijking tussen de kleinste schaal van kennis -- het brein -- en de grootste -- het heelal zelf -- uiterst opvallend en fascinerend. Want zoals Bruce Mau ooit zei: "Wanneer alles is verbonden met al het andere, dan is, ten goede of ten kwade, alles belangrijk".
Thank you so much.
Hartelijk bedankt.
(Applause)
(Applaus)