Over the past 10 years, I've been researching the way people organize and visualize information. And I've noticed an interesting shift.
저는 지난 10년 간 사람들이 정보를 분류하고 가시화하는 방식을 연구했습니다. 그리고 흥미로운 변화를 눈치챘습니다.
For a long period of time, we believed in a natural ranking order in the world around us, also known as the great chain of being, or "Scala naturae" in Latin, a top-down structure that normally starts with God at the very top, followed by angels, noblemen, common people, animals, and so on. This idea was actually based on Aristotle's ontology, which classified all things known to man in a set of opposing categories, like the ones you see behind me. But over time, interestingly enough, this concept adopted the branching schema of a tree in what became known as the Porphyrian tree, also considered to be the oldest tree of knowledge.
우리는 오랜 시간 동안 세상에 존재하는 자연의 위계질서를 믿어왔습니다. 라틴어로 "자연의 단계"라고도 하는 거대한 존재의 사슬이라고도 알려진, 보통 맨 위에 신으로 시작해서 그 다음에 천사, 귀족, 평민, 동물 등으로 내려오는 하향적 구조 말입니다. 이 사상은 사실 아리스토텔레스의 존재론에 입각한 것입니다. 인간이 알고 있는 모든 것에 대응되는 범주 안에 분류한 것인데 제 뒤에 보이는 이겁니다. 하지만 시간이 흐르면서 흥미롭게도 이 개념은 가지를 뻗은 나무의 도식을 취하면서 가장 오래된 지식의 나무로도 여겨지는 포르피리우스의 나무라고 알려진 모습이 되었습니다.
The branching scheme of the tree was, in fact, such a powerful metaphor for conveying information that it became, over time, an important communication tool to map a variety of systems of knowledge. We can see trees being used to map morality, with the popular tree of virtues and tree of vices, as you can see here, with these beautiful illustrations from medieval Europe. We can see trees being used to map consanguinity, the various blood ties between people. We can also see trees being used to map genealogy, perhaps the most famous archetype of the tree diagram. I think many of you in the audience have probably seen family trees. Many of you probably even have your own family trees drawn in such a way. We can see trees even mapping systems of law, the various decrees and rulings of kings and rulers. And finally, of course, also a very popular scientific metaphor, we can see trees being used to map all species known to man. And trees ultimately became such a powerful visual metaphor because in many ways, they really embody this human desire for order, for balance, for unity, for symmetry.
가지를 뻗은 나무 도식은 사실 정보를 전달하는 데 매우 강력한 은유였기에 시간이 지나면서 지식의 다양한 체계를 도표화하는 데 중요한 의사소통 도구가 되었습니다. 우리는 미덕의 나무나 악의 나무와 함께 도덕성을 도식화하기 위해 나무를 쓰는 걸 볼 수 있습니다. 여기 중세 유럽의 아름다운 그림에서 볼 수 있듯이 말이죠. 사람들의 다양한 혈연관계로 혈족을 표현하는 데 나무를 쓰는 것을 볼 수도 있습니다. 아마 가장 많이 알려진 전형적인 나무 도식일텐데요, 가계도를 그리기 위해 쓰는 것도 볼 수 있습니다. 여기 계신 분들 중 많은 분들이 나무로 된 족보를 본 적 있을 겁니다. 이렇게 본인 가문의 족보 나무가 그려져 있는 분도 많으실 겁니다. 심지어 왕과 통치자의 많은 칙령과 판결문이 담긴 법 체계가 도식화 된 나무도 볼 수 있습니다. 그리고 마지막으로, 물론, 매우 유명한 과학적 은유인 인간에게 알려진 모든 종을 나무로 도식화한 것도 볼 수 있습니다. 결과적으로 나무는 매우 강력한 시각적 은유기법이 되었습니다. 질서와 균형, 통일과 대칭을 원하는 인간의 욕구를 많은 부분에서 구현해주기 때문입니다.
However, nowadays we are really facing new complex, intricate challenges that cannot be understood by simply employing a simple tree diagram. And a new metaphor is currently emerging, and it's currently replacing the tree in visualizing various systems of knowledge. It's really providing us with a new lens to understand the world around us. And this new metaphor is the metaphor of the network. And we can see this shift from trees into networks in many domains of knowledge.
하지만 오늘날 우리는 단순한 나무 도식을 이용하는 것만으론 이해할 수 없는 복잡하고 난해한 새로운 과제에 당면해 있습니다. 그래서 최근에는 새 은유기법이 출현해 다양한 지식의 체계를 시각화하는 데 나무를 대체하고 있습니다. 우리 주위의 세상을 이해하기 위한 새로운 시각을 제공해주고 있죠. 바로 네트워크를 이용한 은유기법입니다. 많은 지식 분야에서 나무에서 네트워크로 바뀌고 있는 것을 볼 수 있습니다.
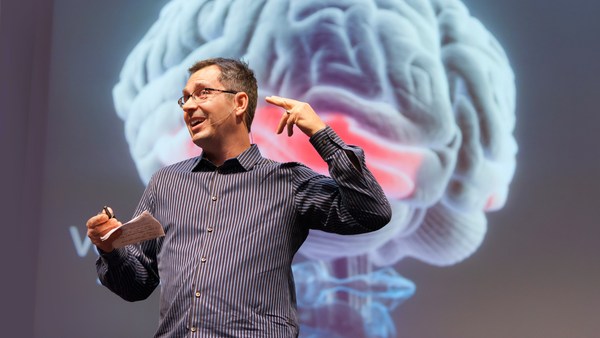
We can see this shift in the way we try to understand the brain. While before, we used to think of the brain as a modular, centralized organ, where a given area was responsible for a set of actions and behaviors, the more we know about the brain, the more we think of it as a large music symphony, played by hundreds and thousands of instruments. This is a beautiful snapshot created by the Blue Brain Project, where you can see 10,000 neurons and 30 million connections. And this is only mapping 10 percent of a mammalian neocortex. We can also see this shift in the way we try to conceive of human knowledge.
뇌를 이해하는 방식에서도 이런 변화를 볼 수 있습니다. 오래 전에 우리는 뇌가 일련의 움직임과 행동양식을 담당하는 조립식의 중앙집권화된 장기라고 생각했었습니다. 뇌에 대해 알면 알수록 우리는 수 백, 수 천 개의 악기가 연주하는 웅장한 교향곡과 같다고 생각합니다. 이것은 블루 브레인 프로젝트가 만든 아름다운 스냅사진입니다. 1만 개의 뉴런과 3천만 개의 시냅스를 볼 수 있죠. 이 사진에는 포유류의 신피질의 10%밖에 도식화 되어있지 않습니다. 우리는 인간의 지식을 이해하는 방식에 변화가 온 것도 볼 수 있습니다.
These are some remarkable trees of knowledge, or trees of science, by Spanish scholar Ramon Llull. And Llull was actually the precursor, the very first one who created the metaphor of science as a tree, a metaphor we use every single day, when we say, "Biology is a branch of science," when we say, "Genetics is a branch of science." But perhaps the most beautiful of all trees of knowledge, at least for me, was created for the French encyclopedia by Diderot and d'Alembert in 1751. This was really the bastion of the French Enlightenment, and this gorgeous illustration was featured as a table of contents for the encyclopedia. And it actually maps out all domains of knowledge as separate branches of a tree.
여기 이 놀라운 지식의 나무나 과학의 나무는 스페인 학자인 라몬 륄이 만든 것입니다. 륄은 사실 최초로 과학에 대한 은유를 나무로 만들어낸 선도자였습니다. 우리가 매일 쓰는 은유법이죠. "생물학은 과학의 한 가지야" "유전학은 생물학의 한 가지야" 하듯이요. 하지만 적어도 제게만 그런지 몰라도 지식의 나무 중 가장 아름다운 나무는 1751년에 디드로와 달랑베르가 프랑스의 백과사전을 위해 만든 겁니다. 이 나무는 정말 프랑스 계몽주의의 수호자였고 이 멋진 묘사는 백과사전의 목차에 소개되었습니다. 이 나무는 지식의 모든 분야를 개별적인 가지로 도식화합니다.
But knowledge is much more intricate than this. These are two maps of Wikipedia showing the inter-linkage of articles -- related to history on the left, and mathematics on the right. And I think by looking at these maps and other ones that have been created of Wikipedia -- arguably one of the largest rhizomatic structures ever created by man -- we can really understand how human knowledge is much more intricate and interdependent, just like a network.
하지만 지식은 이것보다 훨씬 더 복잡합니다. 위키피디아에 있는 이 두 지도는 여러 항목이 연결된 모습을 보여줍니다. 역사와 관련된 항목은 왼쪽에 수학과 관련된 항목은 오른쪽에 있죠. 단연 인간이 만든 구조 중 가장 거대한 뿌리같은 구조라고 할 수 있는 이 지도와 위키피디아에서 만든 다른 지도들을 봄으로써 우리는 인간 지식이 하나의 네트워크처럼 훨씬 복잡하고 상호의존적이라는 걸 이해할 수 있습니다.
We can also see this interesting shift in the way we map social ties between people. This is the typical organization chart. I'm assuming many of you have seen a similar chart as well, in your own corporations, or others. It's a top-down structure that normally starts with the CEO at the very top, and where you can drill down all the way to the individual workmen on the bottom. But humans sometimes are, well, actually, all humans are unique in their own way, and sometimes you really don't play well under this really rigid structure.
그리고 이러한 흥미로운 변화는 사람 사이의 사회적 유대를 도식화하는 방식에서도 볼 수 있습니다. 여기 전형적인 조직의 도표가 있습니다. 많은 분들이 본인의 회사나 다른 곳에서 비슷한 그림을 본 적 있으실 겁니다. CEO가 보통 맨 위에 있는 것으로 시작해서 맨 밑에 있는 노동자 개인으로 내려가는 하향적 구조입니다. 하지만 때로 사람들은, 아니 사실 모든 사람들은 저마다 특별합니다. 가끔은 이런 딱딱한 구조 내에서 제대로 역할을 할 수가 없습니다.
I think the Internet is really changing this paradigm quite a lot. This is a fantastic map of online social collaboration between Perl developers. Perl is a famous programming language, and here, you can see how different programmers are actually exchanging files, and working together on a given project. And here, you can notice that this is a completely decentralized process -- there's no leader in this organization, it's a network.
제가 보기엔 인터넷이 이런 패러다임을 정말 많이 바꾸고 있는 것 같습니다. 이 멋진 지도는 펄(Perl) 개발자들의 온라인에서 소셜네트워크를 통해 협동작업을 하는 모습을 보여줍니다. 펄은 유명한 프로그래밍 언어입니다. 여기 보시면 각각의 프로그래머들이 어떻게 파일을 교환하고 맡은 프로젝트를 같이 작업하는지 볼 수 있습니다. 이 과정이 완전히 분권화 되어있는 것도 볼 수 있습니다. 이 조직에는 리더가 없습니다. 네트워크죠.
We can also see this interesting shift when we look at terrorism. One of the main challenges of understanding terrorism nowadays is that we are dealing with decentralized, independent cells, where there's no leader leading the whole process. And here, you can actually see how visualization is being used. The diagram that you see behind me shows all the terrorists involved in the Madrid attack in 2004. And what they did here is, they actually segmented the network into three different years, represented by the vertical layers that you see behind me. And the blue lines tie together the people that were present in that network year after year. So even though there's no leader per se, these people are probably the most influential ones in that organization, the ones that know more about the past, and the future plans and goals of this particular cell.
테러리즘에서도 이런 변화를 볼 수 있습니다. 오늘날의 테러리즘을 이해하는 데 가장 큰 어려움은 우리가 전 과정을 총괄하는 리더가 없는 분권화되고 독립된 조직들을 상대하고 있다는 겁니다. 여기서 시각화가 어떻게 사용되는지 볼 수 있습니다. 제 뒤에 보이는 도표는 2004년 마드리드 테러사건에 연루된 모든 테러리스트들을 보여줍니다. 이 네트워크는 각각 세 개 년도로 분할되었습니다. 제 뒤에 보이는 평면이 이를 나타내고 있죠. 그리고 파란 선은 매년 네트워크에 연루되었던 사람들을 한데 묶어줍니다. 그래서 리더 자체는 없지만 이 사람들은 아마 조직 내에서 가장 영향력 있는 인물일 겁니다. 이 특정 조직의 과거와 미래의 계획과 목표에 대해 더 많이 아는 사람들이죠.
We can also see this shift from trees into networks in the way we classify and organize species. The image on the right is the only illustration that Darwin included in "The Origin of Species," which Darwin called the "Tree of Life." There's actually a letter from Darwin to the publisher, expanding on the importance of this particular diagram. It was critical for Darwin's theory of evolution. But recently, scientists discovered that overlaying this tree of life is a dense network of bacteria, and these bacteria are actually tying together species that were completely separated before, to what scientists are now calling not the tree of life, but the web of life, the network of life.
종을 체계적으로 분류하는 방식에서도 나무에서 네트워크로 옮겨가는 변화를 볼 수 있습니다. 오른쪽에 있는 그림이 다윈이 "종의 기원"에서 유일하게 책에 넣었던 도해입니다. 다윈은 이걸 "생명의 나무"라고 불렀습니다. 다윈이 출판업자에게 보낸 이 나무의 중요성에 대해 자세히 설명해놓은 편지도 있습니다. 이 나무는 다윈의 진화론에 있어 매우 중요했었습니다. 하지만 최근 들어 과학자들은 박테리아의 네트워크가 생명의 나무를 덮고 있으며 이 박테리아들이 여태까지 완전히 따로 분류되었던 종들을 함께 묶어주고 있음을 발견했습니다. 과학자들이 생명의 나무가 아니라 생명의 거미줄, 생명의 네트워크라 부르는 것으로 말입니다.
And finally, we can really see this shift, again, when we look at ecosystems around our planet. No more do we have these simplified predator-versus-prey diagrams we have all learned at school. This is a much more accurate depiction of an ecosystem. This is a diagram created by Professor David Lavigne, mapping close to 100 species that interact with the codfish off the coast of Newfoundland in Canada. And I think here, we can really understand the intricate and interdependent nature of most ecosystems that abound on our planet.
마지막으로 지구의 생태계를 볼 때도 이 변화가 일어나는 걸 볼 수 있습니다. 이제 우리는 학교에서 배웠던 단순한 포식자-먹이 관계 도표를 쓰지 않습니다. 이제 더 정확하게 생태계를 묘사한 것이 있습니다. 데이비스 라빈 교수가 만든 도표인데 캐나다의 뉴펀들랜드 해안에서 대구와 상호작용을 하는 거의 100여개의 종을 도식화 해놓은 것입니다. 저는 이것으로 우리가 비로소 복잡하고 상호의존적인 속성을 가진 지구 생태계의 대부분을 이해할 수 있다고 생각합니다.
But even though recent, this metaphor of the network, is really already adopting various shapes and forms, and it's almost becoming a growing visual taxonomy. It's almost becoming the syntax of a new language. And this is one aspect that truly fascinates me. And these are actually 15 different typologies I've been collecting over time, and it really shows the immense visual diversity of this new metaphor. And here is an example. On the very top band, you have radial convergence, a visualization model that has become really popular over the last five years. At the top left, the very first project is a gene network, followed by a network of IP addresses -- machines, servers -- followed by a network of Facebook friends. You probably couldn't find more disparate topics, yet they are using the same metaphor, the same visual model, to map the never-ending complexities of its own subject. And here are a few more examples of the many I've been collecting, of this growing visual taxonomy of networks.
그리고 최근에야 일어난 일이지만 네트워크 은유기법은 이미 다양한 형태를 차용하고 있고 시각적 분류학으로 성장하고 있습니다. 새로운 언어의 체계처럼 되고 있습니다. 이러한 양상은 저를 정말 매료시킵니다. 이것은 제가 오랫동안 수집해 온 15개의 다른 유형 분류 체계입니다. 이 은유기법의 엄청난 시각적 다양성을 보여주죠. 예시를 하나 들어드리겠습니다. 윗줄에는 방사형 수렴이 있습니다. 지난 5년 사이에 매우 유행한 시각화 모형이죠. 맨 위 왼쪽의 첫번째 프로젝트는 유전자 네트워크 입니다. 그 옆은 IP주소 네트워크이고, 기계와 서버와 페이스북 친구 네트워크입니다. 이보다 더 이질적인 주제는 없을 겁니다. 그런데도 각 주제의 무한한 복잡성을 도식화하기 위해 동일한 은유기법인 똑같은 시각적 모형을 쓰고 있죠. 제가 수집한 많은 시각적 분류체계인 네트워크 은유기법 모델 중 몇 개를 예시로 더 들어보겠습니다.
But networks are not just a scientific metaphor. As designers, researchers, and scientists try to map a variety of complex systems, they are in many ways influencing traditional art fields, like painting and sculpture, and influencing many different artists. And perhaps because networks have this huge aesthetical force to them -- they're immensely gorgeous -- they are really becoming a cultural meme, and driving a new art movement, which I've called "networkism." And we can see this influence in this movement in a variety of ways. This is just one of many examples, where you can see this influence from science into art. The example on your left side is IP-mapping, a computer-generated map of IP addresses; again -- servers, machines. And on your right side, you have "Transient Structures and Unstable Networks" by Sharon Molloy, using oil and enamel on canvas. And here are a few more paintings by Sharon Molloy, some gorgeous, intricate paintings.
네트워크는 과학적 은유기법이기만 한 것이 아닙니다. 디자이너와 연구원, 과학자들이 여러 복잡한 체계들을 도식화하면서 여러 방면에서 그림이나 조각같은 전통적인 예술 분야와 많은 예술가들에게 영향을 주고 있습니다. 네트워크는 매우 아름다워서 대단히 큰 미적인 힘이 있어서 문화의 구성 요소가 되어 제가 "네트워키즘"이라 부르는 새로운 예술 운동을 이끌고 있습니다. 그리고 우리는 이 운동의 영향력을 다양하게 볼 수 있습니다. 과학에서부터 예술까지 영향력이 닿는 것을 보여주는 많은 사례 중 하나만 들어보겠습니다. 왼쪽에 보이는 것은 IP주소 도식입니다. 컴퓨터로 생성한 IP주소와 서버, 기계의 도식이죠. 오른쪽은 샤론 몰로이가 유화 물감과 에나멜으로 캔버스에 그린 "일시적 구조와 불안정한 네트워크" 입니다. 여기 샤론 몰로이가 그린 아름답고 복잡한 그림이 더 있습니다.
And here's another example of that interesting cross-pollination between science and art. On your left side, you have "Operation Smile." It is a computer-generated map of a social network. And on your right side, you have "Field 4," by Emma McNally, using only graphite on paper. Emma McNally is one of the main leaders of this movement, and she creates these striking, imaginary landscapes, where you can really notice the influence from traditional network visualization.
이것은 과학과 예술 사이의 흥미로운 교류를 보여주는 다른 예시들입니다. 왼쪽에는 "미소 작전"이 있는데 소셜 네트워크를 컴퓨터로 도식화한 것입니다. 오른쪽에는 엠마 맥날리가 종이 위에 흑연으로 그린 "필드 4"가 있습니다. 엠마 맥날리는 이 운동에 있어 주요 리더 중 하나입니다. 가상의 인상적인 풍경을 만들어내는데 여기서 전통적인 네트워크 시각화의 영향력을 엿볼 수 있습니다.
But networkism doesn't happen only in two dimensions. This is perhaps one of my favorite projects of this new movement. And I think the title really says it all -- it's called: "Galaxies Forming Along Filaments, Like Droplets Along the Strands of a Spider's Web." And I just find this particular project to be immensely powerful. It was created by Tomás Saraceno, and he occupies these large spaces, creates these massive installations using only elastic ropes. As you actually navigate that space and bounce along those elastic ropes, the entire network kind of shifts, almost like a real organic network would.
하지만 네트워키즘은 두 개의 공간에서만 일어나지 않습니다. 이건 이 새로운 운동에 관한 프로젝트 중에 제일 좋아하는 겁니다. 제목이 모든 걸 말해주는 것 같습니다. "거미줄을 따라 맺히는 물방울처럼 필라멘트를 따라 형성되는 은하계"가 바로 제목입니다. 저는 이 프로젝트가 굉장히 강력한 힘을 갖고 있다고 느낍니다. 토마스 사라세노가 만든 것인데 그는 넓은 공간 안에 고무밴드만을 이용해 거대한 설치물을 만듭니다. 사람들이 그 공간 안에서 돌아다니고 고무밴드 사이를 지나다니면서 전체 네트워크는 현실의 유기적 네트워크처럼 변화합니다.
And here's yet another example of networkism taken to a whole different level. This was created by Japanese artist Chiharu Shiota in a piece called "In Silence." And Chiharu, like Tomás Saraceno, fills these rooms with this dense network, this dense web of elastic ropes and black wool and thread, sometimes including objects, as you can see here, sometimes even including people, in many of her installations.
여기 네트워키즘이 완전히 다른 수준으로 발전한 또 다른 예시가 있습니다. 일본의 예술가인 치하루 시오타가 만든 "침묵 속에서"라는 작품입니다. 토마스 사라세노처럼 치하루도 공간 전체를 빽빽한 네트워크로, 고무밴드와 검은 털실과 실로 거미줄처럼 채웁니다. 그리고 많은 설치미술 안에 가끔 이렇게 사물도 넣고 심지어 사람들도 넣습니다.
But networks are also not just a new trend, and it's too easy for us to dismiss it as such. Networks really embody notions of decentralization, of interconnectedness, of interdependence. And this new way of thinking is critical for us to solve many of the complex problems we are facing nowadays, from decoding the human brain, to understanding the vast universe out there. On your left side, you have a snapshot of a neural network of a mouse -- very similar to our own at this particular scale. And on your right side, you have the Millennium Simulation. It was the largest and most realistic simulation of the growth of cosmic structure. It was able to recreate the history of 20 million galaxies in approximately 25 terabytes of output. And coincidentally or not, I just find this particular comparison between the smallest scale of knowledge -- the brain -- and the largest scale of knowledge -- the universe itself -- to be really quite striking and fascinating. Because as Bruce Mau once said, "When everything is connected to everything else, for better or for worse, everything matters."
하지만 네트워크는 그저 새로운 트렌드이기만 한 것이 아닙니다. 그러나 그렇게 치부해버리기가 쉽죠. 네트워크는 상호연결과 상호의존의 분권화의 관념을 구현하고 있습니다. 이러한 새로운 사고방식은 인간의 뇌를 해독하는 것부터 광활한 우주를 이해하는 것까지 우리가 오늘날 당면하고 있는 수 많은 복잡한 문제들을 해결하는 데 매우 중요합니다. 왼쪽에 있는 것이 쥐의 신경망의 스냅 사진입니다. 이 크기로 보면 우리 뇌와 매우 유사하죠. 오른쪽에는 밀레니엄 모의실험이 있습니다. 우주 구조의 성장에 관한 가장 거대하고 현실적인 모의실험이었습니다. 2천만 개의 은하계의 역사를 거의 25TB 욜량의 결과물로 재구성할 수 있었습니다. 우연이든 아니든 저는 지식의 가장 작은 단위인 뇌와 지식의 가장 큰 단위인 우주 전체를 비교한 것이 특히 더 인상적이고 매력적으로 느껴집니다. 왜냐하면 브루스 마우도 이렇게 말했으니까요. "모든 것이 모든 것과 연결되어 있을 때, 더 좋든 나쁘든 모든 것은 중요합니다."
Thank you so much.
정말 감사합니다.
(Applause)
(박수)