Over the past 10 years, I've been researching the way people organize and visualize information. And I've noticed an interesting shift.
Negli ultimi 10 anni, ho studiato come la gente organizza e visualizza le informazioni. Ho notato un interessante spostamento.
For a long period of time, we believed in a natural ranking order in the world around us, also known as the great chain of being, or "Scala naturae" in Latin, a top-down structure that normally starts with God at the very top, followed by angels, noblemen, common people, animals, and so on. This idea was actually based on Aristotle's ontology, which classified all things known to man in a set of opposing categories, like the ones you see behind me. But over time, interestingly enough, this concept adopted the branching schema of a tree in what became known as the Porphyrian tree, also considered to be the oldest tree of knowledge.
Per un lungo periodo, abbiamo creduto in un ordinamento naturale del mondo che ci circonda, noto come grande catena dell'essere, o 'Scala naturae' in latino, una struttura dall'alto in basso che normalmente inizia con Dio in alto, seguito dagli angeli, dai nobili, la gente comune, gli animali e così via. Questa idea si basava sull'ontologia di Aristotele, che classificava tutte le cose note all'uomo in una serie di categorie opposte, come quelle che vedete dietro di me. Ma nel tempo, stranamente, questo concetto ha adottato lo schema ramificato di un albero diventando il noto Albero di Porfirio, considerato anche il più antico albero della conoscenza.
The branching scheme of the tree was, in fact, such a powerful metaphor for conveying information that it became, over time, an important communication tool to map a variety of systems of knowledge. We can see trees being used to map morality, with the popular tree of virtues and tree of vices, as you can see here, with these beautiful illustrations from medieval Europe. We can see trees being used to map consanguinity, the various blood ties between people. We can also see trees being used to map genealogy, perhaps the most famous archetype of the tree diagram. I think many of you in the audience have probably seen family trees. Many of you probably even have your own family trees drawn in such a way. We can see trees even mapping systems of law, the various decrees and rulings of kings and rulers. And finally, of course, also a very popular scientific metaphor, we can see trees being used to map all species known to man. And trees ultimately became such a powerful visual metaphor because in many ways, they really embody this human desire for order, for balance, for unity, for symmetry.
Il sistema ramificato di un albero era, di fatto, una metafora così forte per trasmettere informazioni che è diventato, con il tempo, un importante strumento di comunicazione per mappare una varietà di sistemi di conoscenza. Vediamo alberi usati per mappare la moralità, con il popolare albero delle virtù e albero dei vizi, come vedete qui, con queste belle illustrazioni medievali europee. Vediamo alberi che vengono usati per mappare la consanguineità, il sangue che unisce le persone. Vediamo anche alberi usati per mappare la genealogia, forse il più famoso archetipo di rappresentazione di un albero. molti di voi tra il pubblico avranno visto alberi genealogici. Molti di voi probabilmente ce l'hanno anche disegnato così. Ci sono anche alberi che rappresentano sistemi legislativi, i vari decreti e regole di re e governanti. Infine, naturalmente, una metafora molto popolare anch'essa, vediamo alberi usati per mappare tutte le specie note all'uomo. Alla fine, gli alberi sono diventati una metafora visiva così forte perché in qualche modo, incarnano il desiderio umano di ordine, equilibrio, unità, simmetria.
However, nowadays we are really facing new complex, intricate challenges that cannot be understood by simply employing a simple tree diagram. And a new metaphor is currently emerging, and it's currently replacing the tree in visualizing various systems of knowledge. It's really providing us with a new lens to understand the world around us. And this new metaphor is the metaphor of the network. And we can see this shift from trees into networks in many domains of knowledge.
Tuttavia, al giorno d'oggi le sfide sono complesse e intricate e non possono essere capite semplicemente usando un semplice diagramma ad albero. Sta emergendo una nuova metafora, e sta sostituendo l'albero nella visualizzazione di diversi sistemi di conoscenza. Ci sta fornendo una nuova lente per capire il mondo che ci circonda. Questa nuova metafora è la metafora della rete. Possiamo vedere il passaggio dagli alberi alle reti in molti settori della conoscenza.
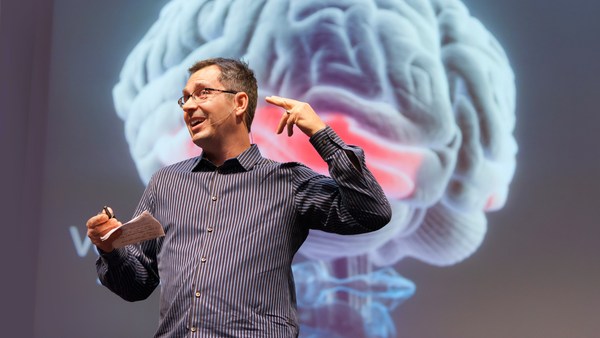
We can see this shift in the way we try to understand the brain. While before, we used to think of the brain as a modular, centralized organ, where a given area was responsible for a set of actions and behaviors, the more we know about the brain, the more we think of it as a large music symphony, played by hundreds and thousands of instruments. This is a beautiful snapshot created by the Blue Brain Project, where you can see 10,000 neurons and 30 million connections. And this is only mapping 10 percent of a mammalian neocortex. We can also see this shift in the way we try to conceive of human knowledge.
Possiamo vedere questo spostamento nel modo di capire il cervello. Mentre prima pensavamo al cervello come un organo modulare, centralizzato, in cui una data area era responsabile di una serie di azioni e comportamenti, più sappiamo del cervello, più lo vediamo come una grande sinfonia, suonata da centinaia e migliaia di strumenti. Questo è una bella immagine creata da Blue Brain Project, in cui si vedono 10 000 neuroni e 30 milioni di connessioni. E questo mappa solo il 10 per cento della neocorteccia dei mammiferi. Possiamo anche vedere lo spostamento nel modo di concepire la conoscenza umana.
These are some remarkable trees of knowledge, or trees of science, by Spanish scholar Ramon Llull. And Llull was actually the precursor, the very first one who created the metaphor of science as a tree, a metaphor we use every single day, when we say, "Biology is a branch of science," when we say, "Genetics is a branch of science." But perhaps the most beautiful of all trees of knowledge, at least for me, was created for the French encyclopedia by Diderot and d'Alembert in 1751. This was really the bastion of the French Enlightenment, and this gorgeous illustration was featured as a table of contents for the encyclopedia. And it actually maps out all domains of knowledge as separate branches of a tree.
Questi sono straordinari alberi della conoscenza o della scienza dello studioso spagnolo Ramon Llull. Llull è stato il precursore, il primo a creare la metafora della scienza come albero, una metafora che usiamo ogni giorno, quando diciamo, "La biologia è un ramo della scienza," quando diciamo, "La genetica è un ramo della scienza." Ma forse il più bello di tutti gli alberi della conoscenza, per me, è stato creato da Diderot e D'Alembert per l'Enciclopedia Francese nel 1751. È stato realmente il bastione dell'Illuminismo francese, e questa meravigliosa illustrazione è stata presentata come indice per l'enciclopedia. Mappa tutti i domini della conoscenza come rami distinti di un albero.
But knowledge is much more intricate than this. These are two maps of Wikipedia showing the inter-linkage of articles -- related to history on the left, and mathematics on the right. And I think by looking at these maps and other ones that have been created of Wikipedia -- arguably one of the largest rhizomatic structures ever created by man -- we can really understand how human knowledge is much more intricate and interdependent, just like a network.
Ma la conoscenza è molto più intricata di così. Queste sono due mappe di Wikipedia che mostrano i collegamenti tra articoli -- per la storia sulla sinistra, e per la matematica sulla destra. Guardando queste mappe e altre che sono state create su Wikipedia -- verosimilmente una delle strutture a rizoma più grandi mai create -- possiamo veramente capire come la conoscenza sia molto più intricata e interdipendente, proprio come una rete.
We can also see this interesting shift in the way we map social ties between people. This is the typical organization chart. I'm assuming many of you have seen a similar chart as well, in your own corporations, or others. It's a top-down structure that normally starts with the CEO at the very top, and where you can drill down all the way to the individual workmen on the bottom. But humans sometimes are, well, actually, all humans are unique in their own way, and sometimes you really don't play well under this really rigid structure.
Vediamo anche questo interessante spostamento del modo di mappare i legami sociali tra le persone. Questo è il tipico organigramma. Suppongo molti di voi abbiano visto un grafico di questo tipo, nelle vostre aziende o altrove. È una struttura dall'alto verso il basso che normalmente parte con l'AD in cima, e in cui si scende fino al singolo operaio in basso. Ma tutti gli esseri umani sono unici a modo loro, e talvolta questa struttura rigida non funziona.
I think the Internet is really changing this paradigm quite a lot. This is a fantastic map of online social collaboration between Perl developers. Perl is a famous programming language, and here, you can see how different programmers are actually exchanging files, and working together on a given project. And here, you can notice that this is a completely decentralized process -- there's no leader in this organization, it's a network.
Credo che Internet stia cambiando parecchio il paradigma. Questa è una mappa fantastica della collaborazione sociale online tra sviluppatori di Perl. Perl è un famoso linguaggio di programmazione, e qui, vedete come diversi programmatori scambiano file, e lavorano insieme su un dato progetto. Qui, notate come il processo sia totalmente decentralizzato -- non ci sono leader in questa organizzazione, è una rete.
We can also see this interesting shift when we look at terrorism. One of the main challenges of understanding terrorism nowadays is that we are dealing with decentralized, independent cells, where there's no leader leading the whole process. And here, you can actually see how visualization is being used. The diagram that you see behind me shows all the terrorists involved in the Madrid attack in 2004. And what they did here is, they actually segmented the network into three different years, represented by the vertical layers that you see behind me. And the blue lines tie together the people that were present in that network year after year. So even though there's no leader per se, these people are probably the most influential ones in that organization, the ones that know more about the past, and the future plans and goals of this particular cell.
Possiamo anche vedere questo interessante cambiamento nel terrorismo. Una della più grandi sfide nella comprensione del terrorismo è l'avere a che fare con cellule indipendenti, decentralizzate, in cui non c'è un leader che guida l'intero processo. E qui, vedete come viene usata la visualizzazione. Il diagramma che vedete dietro di me mostra tutti i terroristi coinvolti nell'attacco a Madrid nel 2004. Quello che hanno fatto qui è segmentare la rete in tre anni diversi, rappresentato da strati verticali che vedete dietro di me. La linea blu lega le persone presenti in quella rete anno dopo anno. Quindi, anche se non c'è un vero leader, queste persone sono probabilmente le più influenti dell'organizzazione, quelle che sanno di più del passato e dei futuri piani e obiettivi di questa particolare cellula.
We can also see this shift from trees into networks in the way we classify and organize species. The image on the right is the only illustration that Darwin included in "The Origin of Species," which Darwin called the "Tree of Life." There's actually a letter from Darwin to the publisher, expanding on the importance of this particular diagram. It was critical for Darwin's theory of evolution. But recently, scientists discovered that overlaying this tree of life is a dense network of bacteria, and these bacteria are actually tying together species that were completely separated before, to what scientists are now calling not the tree of life, but the web of life, the network of life.
Possiamo anche vedere questo passaggio dagli alberi alle reti nel modo di classificare e organizzare le specie. L'immagine sulla destra è l'unica illustrazione che Darwin ha incluso ne "L'Origine delle Specie", che Darwin chiamava "Albero della Vita". C'è una lettera da Darwin all'editore, che illustra l'importanza di questo particolare diagramma. È stato importantissimo per la teoria dell'evoluzione di Darwin. Di recente, gli scienziati hanno scoperto che a copertura di questo albero della vita c'è una fitta rete di batteri, e questi batteri legano tra loro specie prima completamente separate, in quello che gli scienziati chiamano non albero della vita, ma ragnatela della vita, rete della vita.
And finally, we can really see this shift, again, when we look at ecosystems around our planet. No more do we have these simplified predator-versus-prey diagrams we have all learned at school. This is a much more accurate depiction of an ecosystem. This is a diagram created by Professor David Lavigne, mapping close to 100 species that interact with the codfish off the coast of Newfoundland in Canada. And I think here, we can really understand the intricate and interdependent nature of most ecosystems that abound on our planet.
Infine, vediamo di nuovo questo spostamento, osservando gli ecosistemi del pianeta. Non ci sono più questi diagrammi semplificati preda-contro-predatore che abbiamo tutti imparato a scuola. Questa è una descrizione molto più accurata di un ecosistema. Questo è un diagramma creato dal Professor David Lavigne, che mappa quasi 100 specie che interagiscono con il merluzzo al largo delle coste di Newfoundland in Canada. Qui possiamo veramente capire la natura intricata e interdipendente di molti ecosistemi che abbondano sul nostro pianeta.
But even though recent, this metaphor of the network, is really already adopting various shapes and forms, and it's almost becoming a growing visual taxonomy. It's almost becoming the syntax of a new language. And this is one aspect that truly fascinates me. And these are actually 15 different typologies I've been collecting over time, and it really shows the immense visual diversity of this new metaphor. And here is an example. On the very top band, you have radial convergence, a visualization model that has become really popular over the last five years. At the top left, the very first project is a gene network, followed by a network of IP addresses -- machines, servers -- followed by a network of Facebook friends. You probably couldn't find more disparate topics, yet they are using the same metaphor, the same visual model, to map the never-ending complexities of its own subject. And here are a few more examples of the many I've been collecting, of this growing visual taxonomy of networks.
Ma anche più recentemente, questa metafora della rete, sta veramente adottando diverse forme, e sta quasi diventando una crescente tassonomia visiva. Sta quasi diventando la sintassi di una nuova lingua. Questo è un aspetto che mi affascina veramente. Queste sono 15 tipologie diverse che ho raccolto nel tempo, e mostra veramente l'immensa diversità visiva di questa nuova metafora. Ecco un esempio. Nella fascia in alto, vedete la convergenza radiale, un modello di visualizzazione molto popolare negli ultimi cinque anni. In alto a sinistra, il primo progetto è una rete di geni, seguito da da una rete di indirizzi IP, macchine, server, seguito da una rete di amici di Facebook. Non potrebbero essere argomenti più diversi, eppure usano la stessa metafora, lo stesso modello visivo, per mappare le infinite complessità del proprio oggetto. Ecco qualche altro esempio tra quelli che ho raccolto, di queste crescenti tassonomie visive di reti.
But networks are not just a scientific metaphor. As designers, researchers, and scientists try to map a variety of complex systems, they are in many ways influencing traditional art fields, like painting and sculpture, and influencing many different artists. And perhaps because networks have this huge aesthetical force to them -- they're immensely gorgeous -- they are really becoming a cultural meme, and driving a new art movement, which I've called "networkism." And we can see this influence in this movement in a variety of ways. This is just one of many examples, where you can see this influence from science into art. The example on your left side is IP-mapping, a computer-generated map of IP addresses; again -- servers, machines. And on your right side, you have "Transient Structures and Unstable Networks" by Sharon Molloy, using oil and enamel on canvas. And here are a few more paintings by Sharon Molloy, some gorgeous, intricate paintings.
Ma le reti non sono solo metafore scientifiche. Designer, ricercatori e scienziati cercano di mappare una varietà di sistemi complessi, influenzando così settori artistici tradizionali, come la pittura e la scultura, e influenzano tanti artisti diversi. E forse perché le reti hanno questa enorme forza estetica -- sono meravigliose -- stanno diventando un meme culturale, e portano a un nuovo movimento artistico, che ho chiamato "Networkism". Vediamo l'influenza in questo movimento in molti modi. Questo è uno dei tanti esempi, in cui vedete questa influenza dalla scienza all'arte. L'esempio sulla sinistra è la mappatura degli indirizzi IP, una mappa degli indirizzi IP generata dal computer; server, macchine. Sulla destra, vedete "Transient Structures and Unstable Networks" di Sharon Molloy, che usa olio e smalto su tela. Qui vedete altri dipinti di Sharon Molloy, dipinti meravigliosi e intricati.
And here's another example of that interesting cross-pollination between science and art. On your left side, you have "Operation Smile." It is a computer-generated map of a social network. And on your right side, you have "Field 4," by Emma McNally, using only graphite on paper. Emma McNally is one of the main leaders of this movement, and she creates these striking, imaginary landscapes, where you can really notice the influence from traditional network visualization.
Ecco un altro esempio di questa impollinazione incrociata tra scienza e arte. Alla vostra sinistra, avete "Operation Smile." È una mappa di un social network generata al computer. Alla vostra destra, avete "Field 4", di Emma McNally, che usa solo carboncino su carta. Emma McNally è una delle leader di questo movimento, e crea questi impressionanti paesaggi immaginari, in cui si nota veramente l'influenza della visualizzazione tradizionale a rete.
But networkism doesn't happen only in two dimensions. This is perhaps one of my favorite projects of this new movement. And I think the title really says it all -- it's called: "Galaxies Forming Along Filaments, Like Droplets Along the Strands of a Spider's Web." And I just find this particular project to be immensely powerful. It was created by Tomás Saraceno, and he occupies these large spaces, creates these massive installations using only elastic ropes. As you actually navigate that space and bounce along those elastic ropes, the entire network kind of shifts, almost like a real organic network would.
Ma il networkism non è solo in due dimensioni. Questo è forse il mio progetto preferito di questo nuovo movimento. E credo che il titolo dica tutto -- si intitola: "Galassie che si formano lungo i Filamenti, Come Gocce Lungo i Fili di una Ragnatela." Trovo questo progetto straordinariamente potente. È stato creato da Tomás Saraceno, e occupa questi grandi spazi, crea queste enormi installazioni usando solo corde elastiche. Navigando questo spazio e rimbalzando lungo queste corde elastiche, l'intera rete si sposta, quasi come una vera rete organica.
And here's yet another example of networkism taken to a whole different level. This was created by Japanese artist Chiharu Shiota in a piece called "In Silence." And Chiharu, like Tomás Saraceno, fills these rooms with this dense network, this dense web of elastic ropes and black wool and thread, sometimes including objects, as you can see here, sometimes even including people, in many of her installations.
Ecco un altro esempio di networkism portato a tutt'altro livello. È stato creato dall'artista giapponese Chirahu Shiota in un pezzo intitolato "In Silenzio". E Chiharu, come Tomás Saraceno, riempie queste stanze di una fitta rete, questa fitta rete di corde elastiche e lana nera, talvolta includendo oggetti, come vedete qui, talvolta includendo anche persone, in molte delle sue installazioni.
But networks are also not just a new trend, and it's too easy for us to dismiss it as such. Networks really embody notions of decentralization, of interconnectedness, of interdependence. And this new way of thinking is critical for us to solve many of the complex problems we are facing nowadays, from decoding the human brain, to understanding the vast universe out there. On your left side, you have a snapshot of a neural network of a mouse -- very similar to our own at this particular scale. And on your right side, you have the Millennium Simulation. It was the largest and most realistic simulation of the growth of cosmic structure. It was able to recreate the history of 20 million galaxies in approximately 25 terabytes of output. And coincidentally or not, I just find this particular comparison between the smallest scale of knowledge -- the brain -- and the largest scale of knowledge -- the universe itself -- to be really quite striking and fascinating. Because as Bruce Mau once said, "When everything is connected to everything else, for better or for worse, everything matters."
Ma le reti non solo sono anche una tendenza, ed è troppo facile ignorarle come tali. Le reti incarnano veramente il concetto di decentralizzazione, o interconnessione, o interdipendenza. Questo nuovo modo di pensare è importante per aiutarci a risolvere molti problemi complessi dei nostri giorni, dalla decodifica del cervello umano, alla comprensione dell'universo. Alla vostra sinistra, avete un'immagine di una rete neurale di un topo -- molto simile alla nostra su questa scala. Alla vostra destra, avete la Millenium Simulation. Era la più grande e più realistica simulazoine della crescita della struttura cosmica. Era in grado di ricreare la storia di 20 milioni di galassie in circa 25 terabyte di output. Simultaneamente o meno, trovo questo particolare confronto tra la scala più piccola della conoscenza -- il cervello -- e la più grande scala di conoscenza -- l'universo stesso -- essere veramente impressionante e affascinante. Perché come ha detto una volta Bruce Mau, "Quando tutto è connesso a tutto, nel bene e nel male, tutto conta."
Thank you so much.
Grazie infinite.
(Applause)
(Applausi)