Over the past 10 years, I've been researching the way people organize and visualize information. And I've noticed an interesting shift.
במהלך 10 השנים האחרונות. חקרתי את הצורה שבה אנשים רואים ומארגנים מידע. והבחנתי בתפנית מפתיעה.
For a long period of time, we believed in a natural ranking order in the world around us, also known as the great chain of being, or "Scala naturae" in Latin, a top-down structure that normally starts with God at the very top, followed by angels, noblemen, common people, animals, and so on. This idea was actually based on Aristotle's ontology, which classified all things known to man in a set of opposing categories, like the ones you see behind me. But over time, interestingly enough, this concept adopted the branching schema of a tree in what became known as the Porphyrian tree, also considered to be the oldest tree of knowledge.
במשך תקופת זמן ארוכה. האמנו בסדר טבעי הקיים בעולם שמסביבנו. הידוע גם כשרשרת החיים הגדולה או בכינוי סקלה נטוראה בלטינית. מבנה היררכי מלמעלה למטה אשר בד"כ מתחיל עם האלוהים למעלה. ממשיך עם מלאכים, אנשים אצילים, אנשים רגילים,חיות וכו.. רעיון זה מבוסס על הפילוסופיה של אריסטו. אשר קיטלגה את כל הדברים הידועים לאדם בקטגוריות מנוגדות. כמו האלה שאתם רואים מאחוריי. אך במהלך הזמן למרבה הפלא, הקונספקט הזה אימץ לעצמו את הסכמה של עץ. מה שבסופו של דבר נודע בתור העץ הפרפוריאן. גם נחשב לעץ הכי עתיק של הידע.
The branching scheme of the tree was, in fact, such a powerful metaphor for conveying information that it became, over time, an important communication tool to map a variety of systems of knowledge. We can see trees being used to map morality, with the popular tree of virtues and tree of vices, as you can see here, with these beautiful illustrations from medieval Europe. We can see trees being used to map consanguinity, the various blood ties between people. We can also see trees being used to map genealogy, perhaps the most famous archetype of the tree diagram. I think many of you in the audience have probably seen family trees. Many of you probably even have your own family trees drawn in such a way. We can see trees even mapping systems of law, the various decrees and rulings of kings and rulers. And finally, of course, also a very popular scientific metaphor, we can see trees being used to map all species known to man. And trees ultimately became such a powerful visual metaphor because in many ways, they really embody this human desire for order, for balance, for unity, for symmetry.
הסכמה של העץ הייתה למעשה, מטאפורה עוצמתית להעברת מידע. שבמהלך הזמן הפך לכלי תקשורתי חשוב מאוד במיפוי מגוון רחב של מערכות מידע. אנו יכולים לראות עצים אשר משתמשים בהם בכדי למפות מידות מוסריות. עם העץ הפופולארי של המידות הטובות ועץ החטאים, כמו שאתם רואים כאן עם האילוסטרציות היפות מימי הביניים של אירופה. אנו יכולים לראות עצים המשמשים כדי למפות קרבת דם, את קרבות הדם השונות בין אנשים. אנו גם יכולים לראות עצים המשמשים בכדי למפות גנאלוגיה, שזה למעשה אב הטיפוס הכי מפורסם של דיאגרמת עץ. אני חושב שהרבה מכם בקהל, ראו אילן יוחסין. להרבה מכם יש שרטוטים של אילן יוחסין של משפחותיכם בצורה כלשהי. אנו יכולים לראות עצים הממפים מערכת חוקים, גזרות וצווים שונים של מלכים ושליטים. ולסיום, כמובן גם מטאפורה מדעית פופולארית, אנחנו יכולים לראות עצים המשמשים למיפוי של כל המינים הידועים לאדם. והעצים בסופו של דבר הופכים למטאפורה ויזואלית כזו עוצמתית כי במובנים רבים הם הגילום של התשוקה האנושית לסדר, איזון, אחדות וסימטריה.
However, nowadays we are really facing new complex, intricate challenges that cannot be understood by simply employing a simple tree diagram. And a new metaphor is currently emerging, and it's currently replacing the tree in visualizing various systems of knowledge. It's really providing us with a new lens to understand the world around us. And this new metaphor is the metaphor of the network. And we can see this shift from trees into networks in many domains of knowledge.
בכל אופן בימינו אנו נתקלים באתגרים מאוד מורכבים ומרתקים שלא ניתן להבין אותם ע"י שימוש בתרשים עץ פשוט. וצצה כרגע מטאפורה חדשה. שכרגע מחליפה את העץ בלהציג צורות שונות של מערכות מידע. זה ממש מספק לנו עדשה חדשה המשמשת אותנו להבנה של העולם מסביב. והמטאפורה החדשה הזו היא המטאפורה של הרשת. ואנחנו יכולים לראות את התפנית הזאת מעצים לרשת בתחומים רבים של ידע.
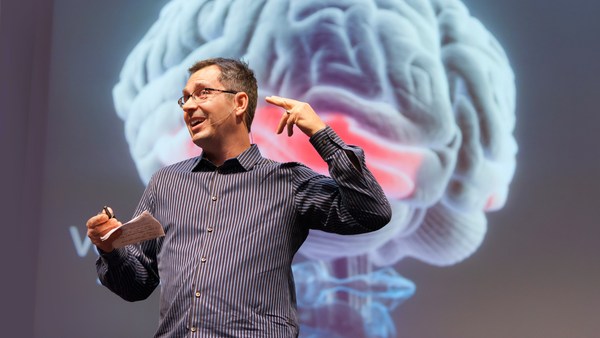
We can see this shift in the way we try to understand the brain. While before, we used to think of the brain as a modular, centralized organ, where a given area was responsible for a set of actions and behaviors, the more we know about the brain, the more we think of it as a large music symphony, played by hundreds and thousands of instruments. This is a beautiful snapshot created by the Blue Brain Project, where you can see 10,000 neurons and 30 million connections. And this is only mapping 10 percent of a mammalian neocortex. We can also see this shift in the way we try to conceive of human knowledge.
אנו רואים את התפנית הזאת בצורה שבה אנו מנסים להבין את המוח. בזמן שבעבר, נהגנו לחשוב על המוח, כאיבר מודולארי, מרכזי, כאשר אזור נתון היה אחראי על סט פעולות והתנהגויות, ככל שאנו יודעים יותר על המוח, ככה אנו חושבים שזוהי סימפונית מוזיקה אחת גדולה, המנוגנת על ידי מאות ואלפי כלי נגינה. זוהי תמונה יפה אשר נוצרה על ידי פרויקט המוח הכחול, ושם תוכל לראות 10,000 נויירונים ו30,000,000 קשרים. וזה יכול למפות רק 10 אחוז מתרבית קליפת המוח. אנו יכולים לראות את התפנית הזאת גם בדרך שבה אנו תופסים את הידע האנושי.
These are some remarkable trees of knowledge, or trees of science, by Spanish scholar Ramon Llull. And Llull was actually the precursor, the very first one who created the metaphor of science as a tree, a metaphor we use every single day, when we say, "Biology is a branch of science," when we say, "Genetics is a branch of science." But perhaps the most beautiful of all trees of knowledge, at least for me, was created for the French encyclopedia by Diderot and d'Alembert in 1751. This was really the bastion of the French Enlightenment, and this gorgeous illustration was featured as a table of contents for the encyclopedia. And it actually maps out all domains of knowledge as separate branches of a tree.
אלה הם כמה עצים מדהימים של ידע, או של מדע, על ידי הספרדי המלומד רמון לול. ולמעשה לול היה המבשר הראשון, הראשון בהחלט שיצר את המטפורה של המדע כעץ, מטאפורה שבה אנו משתמשים בכל יום כאשר אנו אומרים, "ביולוגיה היא ענף של המדע". כאשר אנו אומרים, "גנטיקה היא ענף של המדע". אבל אולי עץ הידע הכי יפה, לפחות לטעמי, נוצר עבור האנצקלופדיה הצרפתית ע"י דידרוט ודאלמברט ב1751. זה היה למעשה מעוז תנועת ההשכלה הצרפתית, והאילוסטרציה המההמת הזו הוצגה בתור תוכן עניינים עבור האנצקלופדיה. וזה למעשה ממפה את כל תחומי הידע כענפים נפרדים של אותו העץ.
But knowledge is much more intricate than this. These are two maps of Wikipedia showing the inter-linkage of articles -- related to history on the left, and mathematics on the right. And I think by looking at these maps and other ones that have been created of Wikipedia -- arguably one of the largest rhizomatic structures ever created by man -- we can really understand how human knowledge is much more intricate and interdependent, just like a network.
אך ידע הוא הרבה יותר מורכב מזה. אלו הן שתי מפות של ויקפדיה שמציגות את הקשרים הפנימיים בין מאמרים הקשורים להיסטוריה משמאל, ולמתמטיקה מימין, ואני חושב שבהסתכלות על המיפוי הזה ועוד מיפוי אחד נוסף שנוצר של ויקיפדיה ניתן להסיק את אחד המבנים הריזומטיים הרחבים ביותר שנוצרו אי פעם ע"י אדם- אנחנו יכולים באמת להבין איך ידע אנושי מורכב בהרבה ובעל תלות פנימית, בדיוק כמו רשת.
We can also see this interesting shift in the way we map social ties between people. This is the typical organization chart. I'm assuming many of you have seen a similar chart as well, in your own corporations, or others. It's a top-down structure that normally starts with the CEO at the very top, and where you can drill down all the way to the individual workmen on the bottom. But humans sometimes are, well, actually, all humans are unique in their own way, and sometimes you really don't play well under this really rigid structure.
אנחנו גם יכולים לראות את השינוי המעניין בדרך שאנו ממפים קשרים חברתיים בין אנשים. התרשים המאורגן הטיפוסי הזה, אני מניח שרבים מכם ראו תרשים דומה, בחברה שלכם, או חברות אחרות. זה מבנה היררכי מלמעלה למטה שבאופן טבעי מתחיל במנכ"ל בקצה העליון ואתם יכולים להמשיך איתו כל הדרך למטה עד לעובד הפשוט בתחתית. אבל לפעמים בני אדם, למעשה כל בן אדם מיוחד בדרכו שלו, ולפעמים אתה לגמרי לא משחק נכון תחת המבנה הנוקשה הזה.
I think the Internet is really changing this paradigm quite a lot. This is a fantastic map of online social collaboration between Perl developers. Perl is a famous programming language, and here, you can see how different programmers are actually exchanging files, and working together on a given project. And here, you can notice that this is a completely decentralized process -- there's no leader in this organization, it's a network.
אני חושב שהאינטרנט שינה את את תבנית החשיבה הזאת די הרבה. זה מיפוי יוצא מן הכלל של שיתוף פעולה חברתי בין מפתחים של פרל. פרל זאת אחת משפות התכנות המפורסמות, והנה, כמו שאתם רואים מתכנתים שונים משתפים קבצים ביניהם, ועובדים ביחד על פרויקט נתון. והנה, אתם יכולים לשים לב שהתהליך הזה מבוזר לגמרי- אין מישהו שמוביל את הארגון הזה, זאת רשת.
We can also see this interesting shift when we look at terrorism. One of the main challenges of understanding terrorism nowadays is that we are dealing with decentralized, independent cells, where there's no leader leading the whole process. And here, you can actually see how visualization is being used. The diagram that you see behind me shows all the terrorists involved in the Madrid attack in 2004. And what they did here is, they actually segmented the network into three different years, represented by the vertical layers that you see behind me. And the blue lines tie together the people that were present in that network year after year. So even though there's no leader per se, these people are probably the most influential ones in that organization, the ones that know more about the past, and the future plans and goals of this particular cell.
אנחנו יכולים גם לראות את התפנית המעניינת הזאת כשאנחנו מסתכלים על טרור. אחד האתגרים המרכזיים בהבנת טרור בימים אלו הוא שאנחנו מתמודדים עם תאי טרור מבוזרים ועצמאיים, ללא מנהיג שמוביל את כל התהליך. והנה, אתם יכולים למעשה לראות איך משתמשים בדימוי חזותי. התרשים שאתם רואים מאחורי מראה את כל הטרוריסטים שלקחו חלק בפיגוע במדריד ב2004. ומה שהם עשו כאן למעשה זה לחלק את הרשת לשלוש שנים שונות, שמוצגות ע"י שכבות אנכיות שאתם רואים מאחורי. והקווים הכחולים קושרים ביחד את האנשים הללו שמוצגים ברשת הזאת שנה אחר שנה. אז למרות שאין מנהיג כלשעצמו, האנשים הללו ככל הנראה הכי משפיעים בארגון הזה, אלה שיודעים יותר לגבי העבר, והתכניות לעתיד והמטרות של התא הספציפי הזה.
We can also see this shift from trees into networks in the way we classify and organize species. The image on the right is the only illustration that Darwin included in "The Origin of Species," which Darwin called the "Tree of Life." There's actually a letter from Darwin to the publisher, expanding on the importance of this particular diagram. It was critical for Darwin's theory of evolution. But recently, scientists discovered that overlaying this tree of life is a dense network of bacteria, and these bacteria are actually tying together species that were completely separated before, to what scientists are now calling not the tree of life, but the web of life, the network of life.
אנחנו גם יכולים לראות את התפנית הזאת מעצים לרשת בדרך בה אנו מקטלגים ומסדרים מינים. התמונה מימין זאת ההדמיה היחידה שדרווין כלל ב"מוצא המינים", וקרא לה "עץ החיים". יש למעשה מכתב מדרווין אל המוציא לאור, בו הוא מרחיב על החשיבות של התרשים הזה פרטנית. זה היה קריטי לתיאורית האבולוציה של דרווין. אך לאחרונה, מדענים גילו שעם הוספת שכבות לעץ החיים נוספה רשת צפופה של חיידקים, והחיידקים הללו למעשה קשורים ביחד לצורות חיים שהיו נפרדות לגמרי קודם לכן, מה שמדענים קוראים לו - לא עץ החיים, אלא אינטרנט של החיים, רשת החיים.
And finally, we can really see this shift, again, when we look at ecosystems around our planet. No more do we have these simplified predator-versus-prey diagrams we have all learned at school. This is a much more accurate depiction of an ecosystem. This is a diagram created by Professor David Lavigne, mapping close to 100 species that interact with the codfish off the coast of Newfoundland in Canada. And I think here, we can really understand the intricate and interdependent nature of most ecosystems that abound on our planet.
ולבסוף, אנחנו יכולים לראות את התפנית הזאת, שוב, כשאנו מסתכלים על המערכת האקולוגית בפלנטה שלנו. כבר אין לנו תרשים פשוט של הטורף נגד המתחנן על נפשו שכולנו למדנו בבית הספר. זה תיאור הרבה יותר מדויק של המערכת האקולוגית. זהו תרשים שנוצר ע"י פרופסור דויד לוין, שממפה קרוב ל100 מינים שקושרים לבקלה מחופיה של ניו-פאונדלנד בקנדה. ואני חושב שכאן, אנחנו יכולים להבין את המורכבות והעצמאות הטבעית של רוב המערכות האקולוגיות שנמצאות בפלנטה שלנו.
But even though recent, this metaphor of the network, is really already adopting various shapes and forms, and it's almost becoming a growing visual taxonomy. It's almost becoming the syntax of a new language. And this is one aspect that truly fascinates me. And these are actually 15 different typologies I've been collecting over time, and it really shows the immense visual diversity of this new metaphor. And here is an example. On the very top band, you have radial convergence, a visualization model that has become really popular over the last five years. At the top left, the very first project is a gene network, followed by a network of IP addresses -- machines, servers -- followed by a network of Facebook friends. You probably couldn't find more disparate topics, yet they are using the same metaphor, the same visual model, to map the never-ending complexities of its own subject. And here are a few more examples of the many I've been collecting, of this growing visual taxonomy of networks.
אך למרות זאת , מטפורת הרשת הזאת אימצה כבר צורות שונות, וזה כמעט נעשה שיטת סיווג ויזואלית גדולה. זה כמעט נעשה תחביר של שפה חדשה. וזו אחת מצורות ההסתכלות שבאמת מרתקות אותי. וזה למעשה 15 טופולוגיות שונות שאספתי לאורך הזמן, שמראות את הגיוון העצום שיש בייצוג ויזואלי באמצעות מטפורה זאת. והנה דוגמא הקבוצה העליונה מכילה התכנסויות סיבוביות, מודל ויזואלי שנעשה פופולארי מאוד בחמש השנים האחרונות. משמאל למעלה, הפרויקט הראשון, זוהי רשת גנים ממשיך ברשת של כתובות IP - מחשבים, שרתים - ואז לרשת של חברים בפייסבוק. אתם כנראה לא תמצאו נושאים יותר שונים זה מזה, ועדיין הם משתמשים באותה מטפורה, אותו מודל חזותי, למיפוי נושא מורכב ובלתי נגמר. וכאן ישנן כמה דוגמאות מבין אלו שאספתי, של שיטת הסיווג הרשתות שצוברת תאוצה.
But networks are not just a scientific metaphor. As designers, researchers, and scientists try to map a variety of complex systems, they are in many ways influencing traditional art fields, like painting and sculpture, and influencing many different artists. And perhaps because networks have this huge aesthetical force to them -- they're immensely gorgeous -- they are really becoming a cultural meme, and driving a new art movement, which I've called "networkism." And we can see this influence in this movement in a variety of ways. This is just one of many examples, where you can see this influence from science into art. The example on your left side is IP-mapping, a computer-generated map of IP addresses; again -- servers, machines. And on your right side, you have "Transient Structures and Unstable Networks" by Sharon Molloy, using oil and enamel on canvas. And here are a few more paintings by Sharon Molloy, some gorgeous, intricate paintings.
אבל רשת זה לא רק מטפורה מדעית. כמו שמעצבים, חוקרים ומדענים מנסים למפות מערכות מורכבות שונות, בכמה מובנים הם משפיעים על תחום האמנות המסורתי, כמו ציור ופיסול, ומשפיעים על סוגים רבים של אמנויות. ויתכן שבגלל שלרשת יש כוח אסתטי עצום עליהם הם מאוד נדהמים הם נעשים מם תרבותי, ודוחפות לתנועות אומנות חדשות, שאני קורא להם "רשתיזם". ואנחנו יכולים לראות את ההשפעה הזאת בתנועה הזאת בכמה דרכים שונות. זאת דוגמא מיני רבות שבה אתם יכולים לראות את ההשפעה של המדע על האומנות. הדוגמא בצד השמאלי שלכם זה מיפוי IP, מיפוי כתובות IP שנוצר ע"י מחשב. שוב - שרתים, מחשבים. ובצד הימני שלכם, מופיע "מבנים ארעיים ורשתות לא יציבות" של שרון מולוי בה נעשה שימוש בשמן ובד. והנה עוד כמה ציורים של שרון מולוי, כמה מהם מדהימים, ציורים מורכבים.
And here's another example of that interesting cross-pollination between science and art. On your left side, you have "Operation Smile." It is a computer-generated map of a social network. And on your right side, you have "Field 4," by Emma McNally, using only graphite on paper. Emma McNally is one of the main leaders of this movement, and she creates these striking, imaginary landscapes, where you can really notice the influence from traditional network visualization.
והנה דוגמא נוספת של ההאבקה המעניינת הזאת בין המדע לאומנות בצד השמאלי שלכם, מופיע "פעולת החיוך". מדובר במיפוי של רשת חברתית שנוצר ע"י מחשב. ובצד ימין שלכם, מופיע "שדה 4" של אמה מקנאלי, בה נעשה שימוש בגרפית על נייר בלבד. אמה מקנאלי היא אחת המנהיגות הראשיות של התנועה הזאת והיא יצרה את ההבלטות הזאת, נופים דמיוניים, שבוודאי תשימו לב הושפעו מייצוג הרשת המסורתי.
But networkism doesn't happen only in two dimensions. This is perhaps one of my favorite projects of this new movement. And I think the title really says it all -- it's called: "Galaxies Forming Along Filaments, Like Droplets Along the Strands of a Spider's Web." And I just find this particular project to be immensely powerful. It was created by Tomás Saraceno, and he occupies these large spaces, creates these massive installations using only elastic ropes. As you actually navigate that space and bounce along those elastic ropes, the entire network kind of shifts, almost like a real organic network would.
אבל רשתיזם לא נוצר רק בשני מימדים. יתכן שזה אחד מהפרויקטים המדהימים של התנועה הזאת. ואני חושב שהכותרת אומרת הכל - זה נקרא: "היווצרות גלקסיות עם קורים, כמו טיפות ביחד עם חוטי רשת עכביש". ואני מצאתי את הפרויקט הזה מאוד משפיע. הוא נוצר ע"י תומס סרכנו, והוא הכניס את כל החלל העצום הזה, יצר את המתקן המסיבי הזה רק ע"י חבלים אלסטיים. כמו שאתם למעשה מנווטים בחלל הזה וקופצים בעזרת החבלים האלסטיים, כל הרשת היא סוג של תחלופות, כמעט כמו שרשת אורגנית אמורה להיות.
And here's yet another example of networkism taken to a whole different level. This was created by Japanese artist Chiharu Shiota in a piece called "In Silence." And Chiharu, like Tomás Saraceno, fills these rooms with this dense network, this dense web of elastic ropes and black wool and thread, sometimes including objects, as you can see here, sometimes even including people, in many of her installations.
והנה שוב דוגמא נוספת של רשתיזם שנלקחה למקום אחר לגמרי. זה נוצר ע"י אומן יפני בשם צי'ארו שיוטה ונקרא "בשקט". וצ'יארו, כמו תומס סרכנו, מילא את כל החדר ברשת המורכבת הזאת רשת החבלים המורכבת הזאת והצמר השחור ואשכולות, לפעמים כולל עצמים, כמו שאתם יכולים לראות כאן, לפעמים אפילו כולל אנשים, בחלק מההתקנות שלהם.
But networks are also not just a new trend, and it's too easy for us to dismiss it as such. Networks really embody notions of decentralization, of interconnectedness, of interdependence. And this new way of thinking is critical for us to solve many of the complex problems we are facing nowadays, from decoding the human brain, to understanding the vast universe out there. On your left side, you have a snapshot of a neural network of a mouse -- very similar to our own at this particular scale. And on your right side, you have the Millennium Simulation. It was the largest and most realistic simulation of the growth of cosmic structure. It was able to recreate the history of 20 million galaxies in approximately 25 terabytes of output. And coincidentally or not, I just find this particular comparison between the smallest scale of knowledge -- the brain -- and the largest scale of knowledge -- the universe itself -- to be really quite striking and fascinating. Because as Bruce Mau once said, "When everything is connected to everything else, for better or for worse, everything matters."
אבל רשתות הן לא תופעה חדשה, וזה קל לנו מדי לדחות את זה. רשתות מגלמות את רעיון הביזור, של חיבור הדדי, של תלות הדדית. ודרך החשיבה החדשה הזאת קריטית עבורנו על מנת לפתור הרבה מהבעיות המורכבות שאנו מתקלים בהן ביום-יום, החל מפענוח המח האנושי, ועד להבנת היקום העצום אי שם. משמאלכם, ישנו תצלום של רשת עצבית של עכבר דומה מאוד לשלנו בקנה המידה הזה. ומימינכם, ישנה "הדמיית המילניום". ההדמיה הגדולה והמציאותית ביותר של מבנה הקוסמוס ההולך וגדל. כך ניתן ליצור מחדש את ההסטוריה של 20 מיליון גלקסיות ע"י כ-25 טרה-בייט של פלט. ובמקרה או שלא, בדיוק מצאתי את ההשוואה הזאת בין ידע בקנה מידה הקטן ביותר - המח ובין ידע בקנה מידה הגדול ביותר - היקום עצמו שהם ממש בולטים ומדהימים. בגלל כמו שברוס מאו אמר, "כשכל דבר קשור לכל דבר אחר, לטוב או לרע, הכל משנה".
Thank you so much.
תודה רבה לכם.
(Applause)
(מחיאות כפיים)