Over the past 10 years, I've been researching the way people organize and visualize information. And I've noticed an interesting shift.
در طول ۱۰ سال گذشته، درباره راهی که مردم اطلاعات را طبقه بندی و تجسم میکنند درحال تحقیق بوده ام. و متوجه تغییر جالبی شده ام.
For a long period of time, we believed in a natural ranking order in the world around us, also known as the great chain of being, or "Scala naturae" in Latin, a top-down structure that normally starts with God at the very top, followed by angels, noblemen, common people, animals, and so on. This idea was actually based on Aristotle's ontology, which classified all things known to man in a set of opposing categories, like the ones you see behind me. But over time, interestingly enough, this concept adopted the branching schema of a tree in what became known as the Porphyrian tree, also considered to be the oldest tree of knowledge.
ما برای مدت زیادی، در جهان پیرامون خود، به طبقه بندی منظم طبیعی معتقد بودیم، که همچنین به عنوان زنجیره عظیم وجود و یا "Scala naturae" در زبان لاتین شناخته میشد، یک نظام منظم بالا به پایین که معمولا از خدا در بالاترین رتبه آغاز میشد، توسط فرشتگان، خردمندان، مردم عادی و حیوانات ادامه مییافت. این ایده در اصل براساس هستی شناسی ارسطو پایه گذاری شده بود، که همه چیزهای شناخته شده توسط بشر را در دسته بندیهای مخالف هم قرار میداد، مانند چیزی که در پشت سر من میبینید. اما با گذشت زمان به اندازه کافی جالبی، این موضوع باعث توسعه شاخ و برگ درختی شد که بعد ها با نام درخت پرفیریان شناخته شد، و همچنین به عنوان کهن ترین درخت دانش در نظر گرفته شد.
The branching scheme of the tree was, in fact, such a powerful metaphor for conveying information that it became, over time, an important communication tool to map a variety of systems of knowledge. We can see trees being used to map morality, with the popular tree of virtues and tree of vices, as you can see here, with these beautiful illustrations from medieval Europe. We can see trees being used to map consanguinity, the various blood ties between people. We can also see trees being used to map genealogy, perhaps the most famous archetype of the tree diagram. I think many of you in the audience have probably seen family trees. Many of you probably even have your own family trees drawn in such a way. We can see trees even mapping systems of law, the various decrees and rulings of kings and rulers. And finally, of course, also a very popular scientific metaphor, we can see trees being used to map all species known to man. And trees ultimately became such a powerful visual metaphor because in many ways, they really embody this human desire for order, for balance, for unity, for symmetry.
در واقع، شمای پر شاخ و برگ درخت، استعاره قدرتمندی از انتقال اطلاعات بود که به مرور زمان به یک ابزار ارتباطی مهم برای مشخص کردن گستره سیستمهای دانش تبدیل شد در اینجا درختانی را که برای ترسیم کردن اخلاقیات استفاده میشدند، به همراه درخت محبوب فضایل و درخت رذایل و تصاویر زیبایی از قرون وسطا را مشاهده می کنید درختانی را میبینیم که برای ترسیم روابط فامیلی استفاده میشدند، و پیوندهای خونی مختلف میان مردم را نشان میدادند. همچنین درختانی را میبینیم که به عنوان شجره نامه استفاده می شدند، که احتمالا محبوب ترين نمونههای اولیه نمودارهای درختی بودند. به نظرم اکثر شما شجره نامههای خانوادگی را دیده باشید. و شاید حتی بعضی از شما شجره نامه خودتان را به این شکل دیده باشید. همینطورمیتوانیم درختانی را ببینیم که قوانین را مشخص میکردند، احکام و قوانین مختلف شاهان و حاکمان. و البته در نهایت محبوب ترین استعاره علمی، درختانی را میبینیم که گونههای شناخته شده توسط بشر را نشان میدهند. و در نهایت، درختها به تشبیهات بصری بسیار پرقدرتی تبدیل شدند، زیرا از بسیاری جهات، پاسخگوی نیاز بشر به نظم، تعادل، وحدت و تقارن بودند.
However, nowadays we are really facing new complex, intricate challenges that cannot be understood by simply employing a simple tree diagram. And a new metaphor is currently emerging, and it's currently replacing the tree in visualizing various systems of knowledge. It's really providing us with a new lens to understand the world around us. And this new metaphor is the metaphor of the network. And we can see this shift from trees into networks in many domains of knowledge.
هرچند، امروزه ما با مسائلی چنان پیچیده و بغرنج مواجه هستیم که فهم آنها تنها با استفاده از یک نمودار درختی ساده غیر ممکن است. و هم اکنون یک تشبیه جدید در حال ظهور است، و در واقع جایگزینی برای نمودار درختی به منظور نمایش سیستمهای مختلف اطلاعات شده است. در واقع این روش، دید جدیدی را برای درک جهان پیرامونمان به ما ارائه کرده است. و این تشبیه جدید، تشبیه شبکهای است. و این حرکت از درختان به سمت شبکهها را در بسیاری از زمینههای دانش مشاهده میکنیم.
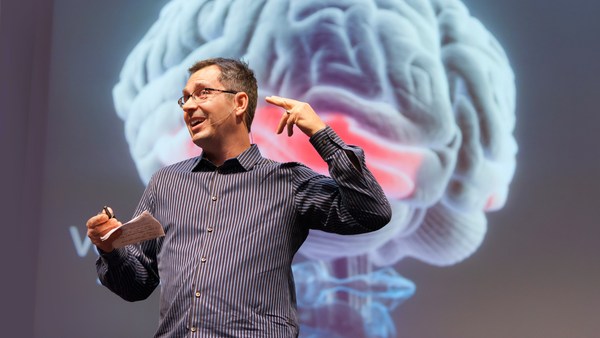
We can see this shift in the way we try to understand the brain. While before, we used to think of the brain as a modular, centralized organ, where a given area was responsible for a set of actions and behaviors, the more we know about the brain, the more we think of it as a large music symphony, played by hundreds and thousands of instruments. This is a beautiful snapshot created by the Blue Brain Project, where you can see 10,000 neurons and 30 million connections. And this is only mapping 10 percent of a mammalian neocortex. We can also see this shift in the way we try to conceive of human knowledge.
میتوانیم این جابجایی را در روشی که برای درک مغز استفاده میکنیم، ببینیم. تا پیش از این، ما به مغز به عنوان یک عضو متمرکز و طبقه بندی شده نگاه میکردیم، که هر بخش آن مسئول فعالیتها و رفتارهای خاصی بود، هرچه بیشتر درباره مغز میفهمیم، بیشتر به عنوان یک سمفونی بزرگ به آن نگاه میکنیم، که توسط هزاران هزار ساز مختلف اجرا شده است. در این تصویر زیبا که توسط پروژه مغز آبی ایجاد شده است، میتوانید ۱۰٫۰۰۰ عصب و ۳۰ میلیون ارتباط را مشاهده کنید. و این تصویر، تنها ۱۰ درصد از بخش نئوکورتکس پستانداران را نشان میدهد. همچنین میتوانیم این تغییر را در روشی که برای درک دانش بشر استفاده میکنیم، ببینیم.
These are some remarkable trees of knowledge, or trees of science, by Spanish scholar Ramon Llull. And Llull was actually the precursor, the very first one who created the metaphor of science as a tree, a metaphor we use every single day, when we say, "Biology is a branch of science," when we say, "Genetics is a branch of science." But perhaps the most beautiful of all trees of knowledge, at least for me, was created for the French encyclopedia by Diderot and d'Alembert in 1751. This was really the bastion of the French Enlightenment, and this gorgeous illustration was featured as a table of contents for the encyclopedia. And it actually maps out all domains of knowledge as separate branches of a tree.
اینها، درختان به یاد ماندنی دانش و علم اند، که توسط محقق اسپانیایی، رامون لو، ایجاد شدهاند. و لو در واقع فرد پیشگامی بود که برای اولین بارعلم را به شکل درخت تشبیه کرد، تشبیهی که ما، هنگامی که میگوییم "زیست شناسی یکی از شاخههای علوم است" و یا وقتی که میگوییم "ژنتیک یکی از شاخههای علوم است" از آن استفاده میکنیم. اما، احتمالا زیباترین درخت دانش، حداقل به نظر من برای دایره المعارف فرانسوی توسط دیدرون و دالامبرت در ۱۷۵۱ ایجاد شده بود. این، درواقع پایه روشنفکری فرانسه بود، و این تصویر زیبا به عنوان جدول اطلاعات برای دایره المعارف بود. و در واقع گسترهی دانش را در قالب شاخ وبرگ مجزای درخت مشخص میکرد.
But knowledge is much more intricate than this. These are two maps of Wikipedia showing the inter-linkage of articles -- related to history on the left, and mathematics on the right. And I think by looking at these maps and other ones that have been created of Wikipedia -- arguably one of the largest rhizomatic structures ever created by man -- we can really understand how human knowledge is much more intricate and interdependent, just like a network.
اما دانش بسیار گستردهتر از این است. اینها، دو نما از شبکه ارتباطات داخلی بین موضوعات در ویکی پدیا هستند-- سمت راست موضوعات تاریخی و سمت چپ موضوعات ریاضی قرار دارند. و من گمان میکنم با مشاهده این نقشهها و دیگر نقشههای تهیه شده از ویکی پدیا-- که یکی از پیچیده ترین ساختارهای ریزوماتیک ساخته بشر است-- میتوان به میزان پیچیدگی و وابستگی دانش بشر پی برد، دقیقا مانند یک شبکه.
We can also see this interesting shift in the way we map social ties between people. This is the typical organization chart. I'm assuming many of you have seen a similar chart as well, in your own corporations, or others. It's a top-down structure that normally starts with the CEO at the very top, and where you can drill down all the way to the individual workmen on the bottom. But humans sometimes are, well, actually, all humans are unique in their own way, and sometimes you really don't play well under this really rigid structure.
همچنین میتوانیم این جهش را در روشی که برای نشان دادن روابط اجتماعی میان مردم به کار میبریم، مشاهده کنیم. این، یک نمودار سازمانی معمولی است. احتمالا خیلی از شما با این گونه نمودارها، در کار خودتان یا جاهای دیگر به خوبی آشنا هستید. این یک ساختار بالا به پایین است که معمولا از مدیر عامل در راس شروع شده، و به سایر کارمندان در پایان، ختم میشود. اما گاهی اوقات انسانها، خوب البته همه انسانها ویژگیهای منحصر به فردی دارند و همیشه بهترین نتیجه، در ساختاری چنین ثابت و خشک، به دست نمیآید.
I think the Internet is really changing this paradigm quite a lot. This is a fantastic map of online social collaboration between Perl developers. Perl is a famous programming language, and here, you can see how different programmers are actually exchanging files, and working together on a given project. And here, you can notice that this is a completely decentralized process -- there's no leader in this organization, it's a network.
به نظر من، اینترنت این الگو را به کلی تغییر داده است. این یک نقشه جالب از روابط اجتماعی آنلاین میان سازندگان پرل است. پرل یک زبان برنامه نویسی معروف است، و در اینجا، نحوه داد و ستد اطلاعات میان برنامه نویسان مختلف هنگام کار برروی یک پروژه مشترک نمایش داده شده است. و مشاهده میکنید که این فعالیت، یک پروسه کاملا تمرکز زدایی شده است-- در این تشکیلات هیچ رهبری وجود ندارد، این، یک شبکه است.
We can also see this interesting shift when we look at terrorism. One of the main challenges of understanding terrorism nowadays is that we are dealing with decentralized, independent cells, where there's no leader leading the whole process. And here, you can actually see how visualization is being used. The diagram that you see behind me shows all the terrorists involved in the Madrid attack in 2004. And what they did here is, they actually segmented the network into three different years, represented by the vertical layers that you see behind me. And the blue lines tie together the people that were present in that network year after year. So even though there's no leader per se, these people are probably the most influential ones in that organization, the ones that know more about the past, and the future plans and goals of this particular cell.
همین طور میتوان این جهش را با نگاه کردن به تروریسم، مشاهده کرد. مسئله عمدهی امروز در مواجه با تروریسم این است که در واقع با بخشهای مستقل و تمرکززدایی شده روبرو هستیم و هیچ رهبری وجود ندارد که کل جریان را هدایت کند. و در اینجا مشاهده میکنید که چگونه از بصری سازی استفاده شده است. دیاگرامی که پشت سر من مشاهده میکنید تمام تروریستهایی که در حمله شهر مادرید در سال ۲۰۰۴ درگیر بودند را نشان میدهد. و در واقع کاری که در اینجا انجام شده، تقسیم شبکه به سه بخش در سالهای مختلف بود، که همانطور که مشاهده میکنید، در لایههای عمودی ارائه شده است. و خطوط آبی افرادی که در سالهای متمادی با هم در ارتباط بودند را نشان میدهند. پس بنابراین، در اینجا هم هیچ نقش رهبری وجود ندارد این افراد احتمالا، موثرترین افراد در تشکیلات هستند، افرادی که بیش از همه درباره گذشته، برنامههای آتی و اهداف این بخش خاص، اطلاعات دارند.
We can also see this shift from trees into networks in the way we classify and organize species. The image on the right is the only illustration that Darwin included in "The Origin of Species," which Darwin called the "Tree of Life." There's actually a letter from Darwin to the publisher, expanding on the importance of this particular diagram. It was critical for Darwin's theory of evolution. But recently, scientists discovered that overlaying this tree of life is a dense network of bacteria, and these bacteria are actually tying together species that were completely separated before, to what scientists are now calling not the tree of life, but the web of life, the network of life.
همین طور جهش از درختان به شبکهها در نحوه دسته بندی و طبقه بندی گونهها نیز قابل مشاهده است. تصویر سمت راست، تنها تصویری است که داروین، در کتاب "خواستگاه گونهها" تحت عنوان "درخت حیات"، قرار داده است. در واقع، نامه ای از داروین به ناشر در دست است که اهمیت این نمودار به خصوص را در آن شرح داده است. این مسئله مهمی برای نظریه تکامل داروین بود. اما محققان به تازگی دریافتهاند که چیزی که در درخت حیات توجهی به آن نشده است شبکه به هم فشردهای از باکتریها است که گونههایی را که تا کنون کاملا از هم جدا بودهاند را در چیزی که دیگر درخت حیات نیست، و شبکه حیات خوانده میشود، به هم پیوند میدهند.
And finally, we can really see this shift, again, when we look at ecosystems around our planet. No more do we have these simplified predator-versus-prey diagrams we have all learned at school. This is a much more accurate depiction of an ecosystem. This is a diagram created by Professor David Lavigne, mapping close to 100 species that interact with the codfish off the coast of Newfoundland in Canada. And I think here, we can really understand the intricate and interdependent nature of most ecosystems that abound on our planet.
و در نهایت، مجددا میتوان این جهش را در نحوه بررسی اکوسیستمهای اطراف زمین، مشاهده کرد. مدتی است که نمودارهای ساده انگارانه شکار در برابر شکارچی که همگی در مدرسهها یاد میگرفتیم، از بین رفتهاند. این تصویری بسیار واقع گرایانه تر از یک اکوسیستم است. این نموداری است که توسط پروفسور دیوید لوین ایجاد شده است، و بیش از صد گونه مختلف را که با ماهی کاد در ارتباط هستند را در ساحل نیوفاندلند کانادا نشان میدهد. و به گمان من، به این شکل میتوان به درک عمیق تری از پیچیدگیها و وابستگیهای اکثر اکوسیستمهای زمین، دست یافت.
But even though recent, this metaphor of the network, is really already adopting various shapes and forms, and it's almost becoming a growing visual taxonomy. It's almost becoming the syntax of a new language. And this is one aspect that truly fascinates me. And these are actually 15 different typologies I've been collecting over time, and it really shows the immense visual diversity of this new metaphor. And here is an example. On the very top band, you have radial convergence, a visualization model that has become really popular over the last five years. At the top left, the very first project is a gene network, followed by a network of IP addresses -- machines, servers -- followed by a network of Facebook friends. You probably couldn't find more disparate topics, yet they are using the same metaphor, the same visual model, to map the never-ending complexities of its own subject. And here are a few more examples of the many I've been collecting, of this growing visual taxonomy of networks.
اما، حتی در حال حاضر، این تشبیه شبکهای در حال ایجاد شکلها و فرمهای گوناگونی است و در حال تبدیل شدن به یک روش طبقه بندی در حال رشد است. و در حال تبدیل شدن به قواعد یک زبان جدید است. و این جنبهای است که واقعا مرا شگفت زده میکند. و در واقع، اینها ۱۵ روش گونه شناسی مختلف هستند که من در طول زمان، جمع آوری کردهام، و تنوع بی حد و حصر این روش بصری جدید را به خوبی نشان میدهند. و به عنوان مثال، در دستهی بالا، همگرایی شعاعی وجود دارد، یک مدل نمایش بصری که در پنج سال اخیر به شدت مورد توجه واقع شده است. در بالا و سمت چپ، اولین پروژه یک شبکه ژنتیکی است و بعد از آن شبکه آدرسهای آی پی-- ماشینها و سرورها--قرار دارد. پس از آن شبکه ای از دوستان در سایت فیس بوک، قرار دارد. احتمالا موضوعاتی متفاوت تر از اینها وجود ندارند که برای نمایش اطلاعات و پیچیدگیهای بی پایان خود از روشی بصری مشابه استفاده کنند. و در اینجا مثالهای بیشتری از گونههای مختلف طبقه بندیهای بصری که من جمع آوری کردهام مشاهده میکنید.
But networks are not just a scientific metaphor. As designers, researchers, and scientists try to map a variety of complex systems, they are in many ways influencing traditional art fields, like painting and sculpture, and influencing many different artists. And perhaps because networks have this huge aesthetical force to them -- they're immensely gorgeous -- they are really becoming a cultural meme, and driving a new art movement, which I've called "networkism." And we can see this influence in this movement in a variety of ways. This is just one of many examples, where you can see this influence from science into art. The example on your left side is IP-mapping, a computer-generated map of IP addresses; again -- servers, machines. And on your right side, you have "Transient Structures and Unstable Networks" by Sharon Molloy, using oil and enamel on canvas. And here are a few more paintings by Sharon Molloy, some gorgeous, intricate paintings.
اما شبکهها تنها استعارههای علمی نیستند همانطور که طراحان، محققین و دانشمندان در سیستمهای مختلف از آنها بهره میبرند، آنها در زمینههای مختلفی در حال تاثیرگذاری بر هنرهای سنتی هستند مانند نقاشی و مجسمه سازی، و در حال تاثیرگذاری بر هنرمندان زیادی هستند. و شاید به دلیل تاثیر زیبایی شناسانه ای که برآنها دارند-- آنها بسیار زیبا هستند-- درحال تبدیل شدن به یک الگوی فرهنگی هستند، و جنبش هنری جدیدی که من "نِتورکیسم" مینامم را به راه انداختهاند. و تاثیرات این جنبش را از جهات متعددی مشاهده میکنیم این تنها یکی از چندین مثال موجود است، که میتوانیم تاثیر علم را بر هنر ببینیم. مثالی که در سمت چپ شما قرار دارد، نقشه آی پی است، یک نقشه آی پی کامپیوتری، دوباره -- سرورها و ماشینها و در سمت راست، شما نقاشی "سازههای گذرا و شبکههای ناپایدار" اثر شارون مولی قرار دارد، که با استفاده ازرنگ و لعاب روی کرباس درست شده است. و اینها نقاشیهای بیشتری از شارون مولی هستند، نقاشیهایی زیبا و پیچیده.
And here's another example of that interesting cross-pollination between science and art. On your left side, you have "Operation Smile." It is a computer-generated map of a social network. And on your right side, you have "Field 4," by Emma McNally, using only graphite on paper. Emma McNally is one of the main leaders of this movement, and she creates these striking, imaginary landscapes, where you can really notice the influence from traditional network visualization.
و اینها مثالهای دیگری از گردهافشانی متقاطع بین علم و هنر هستند. در سمت چپ شما، اثر "عملیات لبخند" قرار دارد که یک نقشه کامپیوتری از شبکه اجتماعی است. و در سمت راست شما، "زمینه 4" اثر اما مکنلی دیده میشود. که اثر گرافیت بر کاغذ است. اما مکنلی یکی از سردمداران اصلی این جنبش است، و او این مناظر قابل توجه و تخیلی را ایجاد میکند، که شما میتوانید تاثیر بصری سازی سنتی شبکهای را در آنها ببینید.
But networkism doesn't happen only in two dimensions. This is perhaps one of my favorite projects of this new movement. And I think the title really says it all -- it's called: "Galaxies Forming Along Filaments, Like Droplets Along the Strands of a Spider's Web." And I just find this particular project to be immensely powerful. It was created by Tomás Saraceno, and he occupies these large spaces, creates these massive installations using only elastic ropes. As you actually navigate that space and bounce along those elastic ropes, the entire network kind of shifts, almost like a real organic network would.
اما نتورکیسم تنها در دو بعد صورت نمیپذیرد. این شاید یکی از پروژههای مورد علاقهی من در این جنبش جدید باشد. و به نظر من عنوان گویای همه چیز هست-- "شکل گیری کهکشانها در طول رشتهها، همانند قطرات بر روی تارهای عنکبوت". و من فکر میکنم که این اثر به خصوص فوقالعاده قدرتمند باشد. این کار توسط توماس ساراسانو ایجاد شده بود و او با اشغال این فضاهای بزرگ، این اتصالات عظیم را تنها با ریسمانهای پلاستیک ساخت. و شما در واقع در این فضا حرکت میکنید و در امتداد این ریسمانها کاوش میکنید، به گونهای کل شبکه درحال حرکت است، تقریبا همان طور که یک شبکه واقعی حرکت میکند.
And here's yet another example of networkism taken to a whole different level. This was created by Japanese artist Chiharu Shiota in a piece called "In Silence." And Chiharu, like Tomás Saraceno, fills these rooms with this dense network, this dense web of elastic ropes and black wool and thread, sometimes including objects, as you can see here, sometimes even including people, in many of her installations.
و این هم یک نمونه دیگر از حرکت نتورکیسم به مرحلهای کاملا جدید. این کار، اثر هنرمند ژاپنی شیهارو شیاتو است به نام "در سکوت". و شیهارو مانند توماس ساراسنو این فضاها را با شبکههایی منسجم پر کرده است، این شبکه منسجم از ریسمانهای پلاستیکی پشم سیاه و نخ، که همانطور که مشاهده میکنید در برخی نقاط اشیائی را دربر گرفتهاند و بعضا حتی انسانها را در تاسیسات خود قرار داده است.
But networks are also not just a new trend, and it's too easy for us to dismiss it as such. Networks really embody notions of decentralization, of interconnectedness, of interdependence. And this new way of thinking is critical for us to solve many of the complex problems we are facing nowadays, from decoding the human brain, to understanding the vast universe out there. On your left side, you have a snapshot of a neural network of a mouse -- very similar to our own at this particular scale. And on your right side, you have the Millennium Simulation. It was the largest and most realistic simulation of the growth of cosmic structure. It was able to recreate the history of 20 million galaxies in approximately 25 terabytes of output. And coincidentally or not, I just find this particular comparison between the smallest scale of knowledge -- the brain -- and the largest scale of knowledge -- the universe itself -- to be really quite striking and fascinating. Because as Bruce Mau once said, "When everything is connected to everything else, for better or for worse, everything matters."
اما شبکهها تنها رویهای تازه نیستند، که بتوان آنها را به راحتی نادیده گرفت. شبکهها در واقع مفاهیم تمرکز زدایی، ارتباط متقابل و وابستگی درونی را بیان میکنند. و این طرز تفکر برای حل مسائل پیچیدهای که ما امروزه با آنها روبرو هستیم بسیار مهم است. از رمزگشایی مغز انسان گرفته تا درک جهان پهناور پیرامونمان. در سمت چپ، تصویری از شبکه عصبی موش را مشاهده میکنید-- در این ابعاد به خصوص بسیار شبیه شبکه عصبی خودمان است. و در سمت راست، شبیه سازی هزاره را مشاهده میکنید. این بزرگترین و واقع گرایانه ترین شبیه سازی از رشد ساختار کیهانی بود. این نمونه قادر به ایجاد دوباره تاریخ ۲۰ میلیون کهکشان در حجم ۲۵ ترابایت از دادهها، بود. و به صورت اتفاقی یا نه، من این مقایسه به خصوص را میان کوچکترین ابعاد دانش--مغز-- و بزرگترین ابعاد دانش--خود کهکشان-- پیدا کردهام.. و این موضوع بسیار هیجان انگیز و شایان توجه است. زیرا همانگونه که بروس ماو میگوید، "زمانی که همهی چیزها به هم مربوط هستند، خوب یا بد، همه چیز اهمیت پیدا میکند."
Thank you so much.
بسیار متشکرم .
(Applause)
(تشویق حضار)