Posledních 10 let jsem zkoumal, jak si lidé organizují a vizualizují informace. Došlo k zajímavému posunu.
Over the past 10 years, I've been researching the way people organize and visualize information. And I've noticed an interesting shift.
Dlouho jsme věřili v přirozenou sestupnou hierarchii ve světě kolem nás, známou jako velký řetěz bytí nebo latinsky "Scala naturae," sestupná struktura, která normálně na samém vrcholu začíná Bohem, následují andělé, šlechtici, prostý lid, zvířata atd. Vychází z Aristotelovy ontologie, která řadí všechny člověku známé věci v protichůdné kategorie jako ty, které vidíte za mnou. Časem však tento koncept převzal schéma větvení stromu, známé jako "Porfyriův strom", nebo "nejstarší strom vědomostí".
For a long period of time, we believed in a natural ranking order in the world around us, also known as the great chain of being, or "Scala naturae" in Latin, a top-down structure that normally starts with God at the very top, followed by angels, noblemen, common people, animals, and so on. This idea was actually based on Aristotle's ontology, which classified all things known to man in a set of opposing categories, like the ones you see behind me. But over time, interestingly enough, this concept adopted the branching schema of a tree in what became known as the Porphyrian tree, also considered to be the oldest tree of knowledge.
Schéma stromu bylo tak silnou metaforou vyjádření informace, že se stalo důležitým komunikačním prostředkem k zobrazení systémů vědomostí. Stromy se používaly k zobrazení morálky – známý strom mravností a strom neřestí – jak můžete vidět na těchto nádherných ilustracích ze středověké Evropy. Stromy zobrazují příbuznost a rozličná krevní pouta mezi lidmi. Stromy zobrazují genealogii, asi nejslavnější stromový diagram. Mnozí z vás nejspíš viděli rodokmeny či dokonce podobně nakreslený vlastní. Stromy dokonce mapují právní systémy, rozličné dekrety a vlády králů a vládců. A konečně velmi známou vědeckou metaforou jsou stromy zobrazující všechny živočišné druhy známé člověku. Stromy se staly silnou vizuální metaforou, protože ztělesňují lidskou touhu po řádu, rovnováze, jednotě a symetrii.
The branching scheme of the tree was, in fact, such a powerful metaphor for conveying information that it became, over time, an important communication tool to map a variety of systems of knowledge. We can see trees being used to map morality, with the popular tree of virtues and tree of vices, as you can see here, with these beautiful illustrations from medieval Europe. We can see trees being used to map consanguinity, the various blood ties between people. We can also see trees being used to map genealogy, perhaps the most famous archetype of the tree diagram. I think many of you in the audience have probably seen family trees. Many of you probably even have your own family trees drawn in such a way. We can see trees even mapping systems of law, the various decrees and rulings of kings and rulers. And finally, of course, also a very popular scientific metaphor, we can see trees being used to map all species known to man. And trees ultimately became such a powerful visual metaphor because in many ways, they really embody this human desire for order, for balance, for unity, for symmetry.
Dnes ale čelíme novým, složitým a spletitým výzvám, které nemohou být pochopeny jen jednoduchým stromovým diagramem. A tak místo stromu nastupuje nová metafora ve vizualizaci různých systémů vědění. Skutečně nám poskytuje nové brýle pro porozumění světu kolem nás. Tou metaforou je metafora sítě. Tento posun od stromů k sítím vidíme v mnoha oblastech vědění.
However, nowadays we are really facing new complex, intricate challenges that cannot be understood by simply employing a simple tree diagram. And a new metaphor is currently emerging, and it's currently replacing the tree in visualizing various systems of knowledge. It's really providing us with a new lens to understand the world around us. And this new metaphor is the metaphor of the network. And we can see this shift from trees into networks in many domains of knowledge.
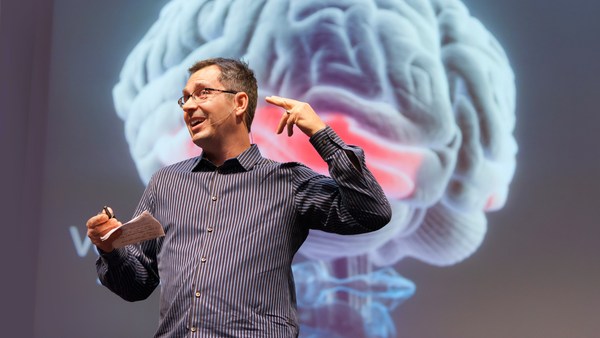
V tom, jak se snažíme porozumět mozku. Dříve jsme o mozku přemýšleli jako o modulárním centralizovaném orgánu, kde je určitá oblast zodpovědná za sérii akcí a chování. Čím více o mozku víme, tím více o něm přemýšlíme jako o velké hudební symfonii hrané stovkami a tisíci nástrojů. Toto je nádherná fotka vytvořená projektem Blue Brain, kde vidíte 10 tisíc neuronů a 30 milionů cestiček. Toto je zobrazení pouhých 10 % savčí mozkové kůry. K posunu došlo i v tom, jak si představujeme lidské vědomosti.
We can see this shift in the way we try to understand the brain. While before, we used to think of the brain as a modular, centralized organ, where a given area was responsible for a set of actions and behaviors, the more we know about the brain, the more we think of it as a large music symphony, played by hundreds and thousands of instruments. This is a beautiful snapshot created by the Blue Brain Project, where you can see 10,000 neurons and 30 million connections. And this is only mapping 10 percent of a mammalian neocortex. We can also see this shift in the way we try to conceive of human knowledge.
Toto je pár nevšedních stromů vědění nebo stromů věd od španělského učence Ramona Llulla, který byl předchůdcem – byl prvním, kdo vytvořil metaforu vědy jako stromu, kterou dnes běžně používáme, když říkáme: "biologie je odvětvím vědy," když říkáme: "genetika je odvětvím vědy." Pro mě je tím nejkrásnějším stromem vědění tento. Byl vytvořen pro francouzskou encyklopedii od Diderota a d'Alemberta v r. 1751. Ta byla opravdovou baštou francouzkého osvícenství a ilustrace byla použita jako obsah této encyklopedie. Ukazuje všechny oblasti vědění jako jednotlivé větve stromu.
These are some remarkable trees of knowledge, or trees of science, by Spanish scholar Ramon Llull. And Llull was actually the precursor, the very first one who created the metaphor of science as a tree, a metaphor we use every single day, when we say, "Biology is a branch of science," when we say, "Genetics is a branch of science." But perhaps the most beautiful of all trees of knowledge, at least for me, was created for the French encyclopedia by Diderot and d'Alembert in 1751. This was really the bastion of the French Enlightenment, and this gorgeous illustration was featured as a table of contents for the encyclopedia. And it actually maps out all domains of knowledge as separate branches of a tree.
Ale vědomosti jsou mnohem složitější než toto. Tyto dvě mapy Wikipedie ukazují propojenost článků související nalevo s historií a napravo s matematikou. Při pohledu na tyto mapy a další, vytvořené Wikipedií -- jednou z největších rhizomatických struktur vytvořených člověkem -- můžeme pochopit složitost lidského vědění a jeho provázanost, jako síť
But knowledge is much more intricate than this. These are two maps of Wikipedia showing the inter-linkage of articles -- related to history on the left, and mathematics on the right. And I think by looking at these maps and other ones that have been created of Wikipedia -- arguably one of the largest rhizomatic structures ever created by man -- we can really understand how human knowledge is much more intricate and interdependent, just like a network.
Také vidíme zajímavý posun ve znázornění sociálních vazeb mezi lidmi. Toto je typické schéma organizace. Předpokládám, že podobný graf jste už viděli ve vašich korporacích. Je to sestupná struktura, s ředitelem na samotném vrcholu, odkud se můžete prokopat až k jednotlivým pracovníkům dole. Ale lidé jsou svým způsobem jedineční a někdy se pod touto neohebnou strukturou nedá pořádně hrát.
We can also see this interesting shift in the way we map social ties between people. This is the typical organization chart. I'm assuming many of you have seen a similar chart as well, in your own corporations, or others. It's a top-down structure that normally starts with the CEO at the very top, and where you can drill down all the way to the individual workmen on the bottom. But humans sometimes are, well, actually, all humans are unique in their own way, and sometimes you really don't play well under this really rigid structure.
Internet hodně mění tento model. Toto je fantastická mapa online sociální spolupráce mezi vývojáři Perlu, známého programovacího jazyka. Zde vidíte, jak si programátoři vyměňují soubory a pracují společně na projektu. A tady si můžete všimnout, že je to naprosto decentralizovaný proces -- není tu žádný vůdce této organizace, je to síť.
I think the Internet is really changing this paradigm quite a lot. This is a fantastic map of online social collaboration between Perl developers. Perl is a famous programming language, and here, you can see how different programmers are actually exchanging files, and working together on a given project. And here, you can notice that this is a completely decentralized process -- there's no leader in this organization, it's a network.
Tento zajímavý posun vidíme i u terorismu. Jeden z hlavních problémů pochopení současného terorismu je, že stojíme proti decentralizovaným, nezávislým buňkám, bez vůdce, který by celý proces řídil. A tady vidíte, jak se využívá vizualizace. Diagram, který vidíte za mnou, ukazuje všechny teroristy zapojené do útoku v Madridu v r.2004. Rozdělili síť do tří různých roků představovaných svislými úrovněmi, A modré čáry spojují lidi přítomné v té síti v jednotlivých letech. I když tu není žádný vůdce jako takový, tito lidé jsou pravděpodobně ti nejvlivnější v této organizaci, znají lépe minulost a budoucí plány a cíle této konkrétní buňky.
We can also see this interesting shift when we look at terrorism. One of the main challenges of understanding terrorism nowadays is that we are dealing with decentralized, independent cells, where there's no leader leading the whole process. And here, you can actually see how visualization is being used. The diagram that you see behind me shows all the terrorists involved in the Madrid attack in 2004. And what they did here is, they actually segmented the network into three different years, represented by the vertical layers that you see behind me. And the blue lines tie together the people that were present in that network year after year. So even though there's no leader per se, these people are probably the most influential ones in that organization, the ones that know more about the past, and the future plans and goals of this particular cell.
Tento posun ze stromů na sítě zaznamenáváme i ve způsobu, jakým řadíme a organizujeme živočišné druhy. Obrázek napravo je jedinou ilustrací, kterou Darwin zahrnul do díla "O původu druhů", a kterou nazval "Strom života." Ve svém dopise vydavateli Darwin popisuje jeho důležitost. Byl nezbytný pro Darwinovu teorii evoluce. Vědci ale nedávno objevili, že tento strom života překrývá hustá síť bakterií, které propojují živočišné druhy, jež byly před tím naprosto oddělené A to vědci nazývají ne strom života, ale pavučina života, síť života.
We can also see this shift from trees into networks in the way we classify and organize species. The image on the right is the only illustration that Darwin included in "The Origin of Species," which Darwin called the "Tree of Life." There's actually a letter from Darwin to the publisher, expanding on the importance of this particular diagram. It was critical for Darwin's theory of evolution. But recently, scientists discovered that overlaying this tree of life is a dense network of bacteria, and these bacteria are actually tying together species that were completely separated before, to what scientists are now calling not the tree of life, but the web of life, the network of life.
A konečně, tento posun vidíme v ekosystému naší planety. Ve školách se už neučíme zjednodušené diagramy predátor versus kořist, Toto je mnohem přesnější vyobrazení ekosystému. Tento diagram vytvořil profesor David Lavign, mapuje téměř 100 druhů, které se vzájemně ovlivňují s treskou u pobřeží Newfoundlandu v Kanadě. A právě na něm můžeme opravdu pochopit složitou a vzájemně provázanou povahu většiny ekosystémů naší planety.
And finally, we can really see this shift, again, when we look at ecosystems around our planet. No more do we have these simplified predator-versus-prey diagrams we have all learned at school. This is a much more accurate depiction of an ecosystem. This is a diagram created by Professor David Lavigne, mapping close to 100 species that interact with the codfish off the coast of Newfoundland in Canada. And I think here, we can really understand the intricate and interdependent nature of most ecosystems that abound on our planet.
I když je tato metafora sítě mladá, již nabyla různých tvarů a forem a stává se rostoucí vizuální taxonomií. Stává se větnou skladbou nového jazyka. A to je jeden z aspektů, který mě opravdu fascinuje. Tohle je 15 rozdílných typologií, které už nějakou chvíli sbírám. Ukazují ohromnou vizuální různorodost této nové metafory. A tady je jeden příklad. V nejhornějším pruhu máte paprsčitou sbíhavost, vizualizaci modelu, který se stal velmi populární během posledních 5 let. Nahoře vlevo, ten první projekt, je genetická síť, následuje síť IP adres - stroje, servery - a po ní následuje Facebooková síť přátel. Těžko byste hledali odlišnější náměty, přesto využívají stejné metafory, stejný vizuální model k zobrazení nekonečné složitosti svého námětu. A tady je pár dalších příkladů rostoucích vizuálních klasifikací sítě.
But even though recent, this metaphor of the network, is really already adopting various shapes and forms, and it's almost becoming a growing visual taxonomy. It's almost becoming the syntax of a new language. And this is one aspect that truly fascinates me. And these are actually 15 different typologies I've been collecting over time, and it really shows the immense visual diversity of this new metaphor. And here is an example. On the very top band, you have radial convergence, a visualization model that has become really popular over the last five years. At the top left, the very first project is a gene network, followed by a network of IP addresses -- machines, servers -- followed by a network of Facebook friends. You probably couldn't find more disparate topics, yet they are using the same metaphor, the same visual model, to map the never-ending complexities of its own subject. And here are a few more examples of the many I've been collecting, of this growing visual taxonomy of networks.
Ale sítě nejsou pouze vědecké metafory. Jak designéři, výzkumníci a vědci usilují o mapování různorodosti složitých systémů, ovlivňují tak tradiční pole umění, jako je malba a sochařství a ovlivňují mnoho rozličných umělců. A možná právě pro to, že pro ně mají tak obrovskou estetickou sílu -- jsou ohromně nádherné --- se stávají kulturním memem a řídí nový umělecký směr, který jsem nazval networkismus. A v něm vidíme tento vliv nejrůznějšími způsoby. Toto je jen jeden z mnoha příkladů, kde vidíte vliv od vědy po umění. Nalevo je počítačově vytvořená mapa IP adres - stroje, servery. Napravo vidíte "Pomíjivé struktury a nestabilní sítě" od Sharona Molloye za použití oleje a smaltu na plátně. A tady je pár dalších krásných a složitých maleb od Sharona Molloye,
But networks are not just a scientific metaphor. As designers, researchers, and scientists try to map a variety of complex systems, they are in many ways influencing traditional art fields, like painting and sculpture, and influencing many different artists. And perhaps because networks have this huge aesthetical force to them -- they're immensely gorgeous -- they are really becoming a cultural meme, and driving a new art movement, which I've called "networkism." And we can see this influence in this movement in a variety of ways. This is just one of many examples, where you can see this influence from science into art. The example on your left side is IP-mapping, a computer-generated map of IP addresses; again -- servers, machines. And on your right side, you have "Transient Structures and Unstable Networks" by Sharon Molloy, using oil and enamel on canvas. And here are a few more paintings by Sharon Molloy, some gorgeous, intricate paintings.
A tady je další příklad tohoto zajímavého spojení vědy a umění. Nalevo je "Operace: Úsměv" -- počítačově vytvořená mapa sociální sítě. Napravo je "Pole 4" od Emmy McNally za použití pouze grafitu na papíře. Emma McNally je jedna z hlavních vůdců tohoto směru vytváří tyto dech beroucí imaginární krajiny, kde si můžete povšimnout vlivu tradiční síťové vizualizace.
And here's another example of that interesting cross-pollination between science and art. On your left side, you have "Operation Smile." It is a computer-generated map of a social network. And on your right side, you have "Field 4," by Emma McNally, using only graphite on paper. Emma McNally is one of the main leaders of this movement, and she creates these striking, imaginary landscapes, where you can really notice the influence from traditional network visualization.
Ale networkismus se neodehrává pouze ve dvou dimenzích. Zde je jeden můj oblíbený projekt tohoto nového směru. Myslím, že název říká vše. Jmenuje se: "Galaxie formující se po vláknech jako kapičky na nitce pavoučí sítě" A právě tento projekt považuji za nesmírně mocný. Vytvořil jej Tomás Saraceno který zaplňuje obrovské prostory, a vytváří masivní instalace za použití pouze elastických provazů. Jak procházíte tímto prostorem a odrážíte se po elastických provazech, celá sít se tak nějak mění, téměř tak, jako skutečná organická síť.
But networkism doesn't happen only in two dimensions. This is perhaps one of my favorite projects of this new movement. And I think the title really says it all -- it's called: "Galaxies Forming Along Filaments, Like Droplets Along the Strands of a Spider's Web." And I just find this particular project to be immensely powerful. It was created by Tomás Saraceno, and he occupies these large spaces, creates these massive installations using only elastic ropes. As you actually navigate that space and bounce along those elastic ropes, the entire network kind of shifts, almost like a real organic network would.
A tady je další z příkladů networkismu, na zcela jiné úrovni. Toto je dílo japonské umělkyně Chiharu Shiotou, nazvané "V tichu". A Chiharu, stejně jako Tomás Saraceno, zaplňuje prostory hustou sítí z elastických provazů, černé vlny a vláken někdy včetně předmětů, jak můžete vidět tady a v mnoha svých instalacích dokonce i včetně lidí.
And here's yet another example of networkism taken to a whole different level. This was created by Japanese artist Chiharu Shiota in a piece called "In Silence." And Chiharu, like Tomás Saraceno, fills these rooms with this dense network, this dense web of elastic ropes and black wool and thread, sometimes including objects, as you can see here, sometimes even including people, in many of her installations.
Ale sítě nejsou jen novým trendem a je jednoduché je jako takové odmítnout. Sítě ztělesňují představu decentralizace, provázanosti, vzájemné závislosti. A tento nový způsob myšlení je zásadní při řešení složitých problémů dneška -- od dešifrování lidského mozku po pochopení rozsáhlého vesmíru kolem nás. Nalevo je fotka nervového systému myši, v tomto měřítku velmi podobného našemu. Napravo je "Milennium Simulation", největší a nejrealističtější simulace růstu kosmické struktury. Oživila historii 20 miliónů galaxií ve výstupu o přibližně 25 terabytů. A ať už náhodou, či ne, tak toto konkrétní srovnání mezi nejmenším měřítkem vědomostí -- mozkem -- a největším měřítkem vědomostí -- samotným vesmírem-- považuji za opravdu překvapující a fascinující. Protože jak Bruce Mau jednou řekl: "Ve chvíli kdy je vše propojeno se vším, v dobrém i ve zlém, záleží na všem."
But networks are also not just a new trend, and it's too easy for us to dismiss it as such. Networks really embody notions of decentralization, of interconnectedness, of interdependence. And this new way of thinking is critical for us to solve many of the complex problems we are facing nowadays, from decoding the human brain, to understanding the vast universe out there. On your left side, you have a snapshot of a neural network of a mouse -- very similar to our own at this particular scale. And on your right side, you have the Millennium Simulation. It was the largest and most realistic simulation of the growth of cosmic structure. It was able to recreate the history of 20 million galaxies in approximately 25 terabytes of output. And coincidentally or not, I just find this particular comparison between the smallest scale of knowledge -- the brain -- and the largest scale of knowledge -- the universe itself -- to be really quite striking and fascinating. Because as Bruce Mau once said, "When everything is connected to everything else, for better or for worse, everything matters."
Děkuji mnohokrát.
Thank you so much.
(potlesk)
(Applause)