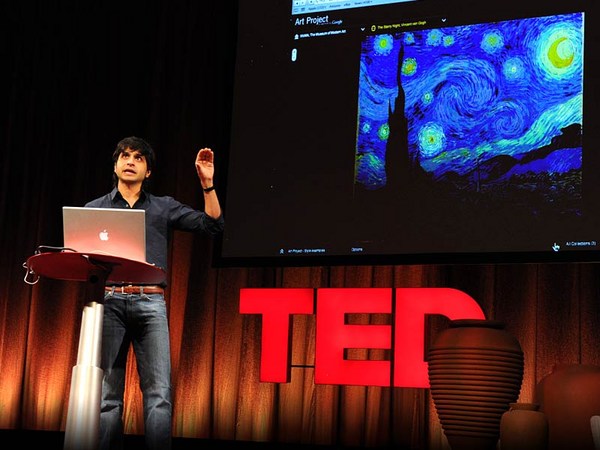
Erez Lieberman Aiden: Everyone knows that a picture is worth a thousand words. But we at Harvard were wondering if this was really true. (Laughter) So we assembled a team of experts, spanning Harvard, MIT, The American Heritage Dictionary, The Encyclopedia Britannica and even our proud sponsors, the Google. And we cogitated about this for about four years. And we came to a startling conclusion. Ladies and gentlemen, a picture is not worth a thousand words. In fact, we found some pictures that are worth 500 billion words.
Ерез Ліберман Айден: Усі знають, що зображення варте тисячі слів. Але ми у Гарварді сумнівалися, чи це є правдою. (Сміх) Тому ми зібрали команду експертів з Гарварду, МТІ, Словника Американської Спадщини, Енциклопедії Британіка, та навіть нашого величного спонсора Google. Ми обмірковували це приблизно чотири роки. І ми дійшли до вражаючого висновку. Леді та джентельмени, зображення не варте тисячі слів. Направду, ми знайшли певні зображення, що варті більше 500 мільярдів слів.
Jean-Baptiste Michel: So how did we get to this conclusion? So Erez and I were thinking about ways to get a big picture of human culture and human history: change over time. So many books actually have been written over the years. So we were thinking, well the best way to learn from them is to read all of these millions of books. Now of course, if there's a scale for how awesome that is, that has to rank extremely, extremely high. Now the problem is there's an X-axis for that, which is the practical axis. This is very, very low.
Жан-Баптист Мішель: То як ми зробили такий висновок? Ерез та я обмірковували те, як отримати загальний план людської культури та історії: що змінюється з плином часу. Так багато книг було написано за довгі роки. Тож ми вважали, що найкращий шлях вивчити їх - це прочитати всі ці мільйони книг. Звичайно, якби була така шкала, щоб показати наскільки це круто то це було б вийнятково, виключно круто Проблема в тому, що існує вісь Х, практична вісь. Це дуже, дуже низько.
(Applause)
(Аплодисменти)
Now people tend to use an alternative approach, which is to take a few sources and read them very carefully. This is extremely practical, but not so awesome. What you really want to do is to get to the awesome yet practical part of this space. So it turns out there was a company across the river called Google who had started a digitization project a few years back that might just enable this approach. They have digitized millions of books. So what that means is, one could use computational methods to read all of the books in a click of a button. That's very practical and extremely awesome.
Тепер люди мають тенденцію використовувати альтернативний підхід - взяти декілька джерел та дуже ретельно їх прочитати. Це дуже практично, але не так круто. Чого насправді хочеться дістатися практичної, але крутої частини цього простору. Виявляється, навпроти, через річку, є компанія Google, яка кілька років тому розпочала проект оцифровки, що може дозволити такий підхід. Вони оцифрували мільйони книг. Це значить, що можна використовувати обчислювальні методи для того, щоб прочитати всі ці книги одним натисненням кнопки. Це дуже практично і неймовірно круто.
ELA: Let me tell you a little bit about where books come from. Since time immemorial, there have been authors. These authors have been striving to write books. And this became considerably easier with the development of the printing press some centuries ago. Since then, the authors have won on 129 million distinct occasions, publishing books. Now if those books are not lost to history, then they are somewhere in a library, and many of those books have been getting retrieved from the libraries and digitized by Google, which has scanned 15 million books to date.
Ела: Давайте я розповім про походження книг. З незапам'ятних часів були автори. Ці автори прагнули писати книги. І це стало значно простіше з розвитком друкарства кілька століть тому. З тих пір, автори перемогли у 129 мільйонів різних випадків видання книг. Якщо ці книги не канули в історію, вони зберігаються десь в якійсь бібліотеці, і більшість з цих книг беруться з бібліотек та оцифровуються компанією Google, яка на сьогоднішній день відсканувала 15 мільйонів книг.
Now when Google digitizes a book, they put it into a really nice format. Now we've got the data, plus we have metadata. We have information about things like where was it published, who was the author, when was it published. And what we do is go through all of those records and exclude everything that's not the highest quality data. What we're left with is a collection of five million books, 500 billion words, a string of characters a thousand times longer than the human genome -- a text which, when written out, would stretch from here to the Moon and back 10 times over -- a veritable shard of our cultural genome. Of course what we did when faced with such outrageous hyperbole ... (Laughter) was what any self-respecting researchers would have done. We took a page out of XKCD, and we said, "Stand back. We're going to try science."
Коли компанія Google оцифровує книгу, вони зберігають її у дуже зручному форматі. У нас є дані та метадані. У нас є інформація про такі речі, де це було опубліковано, хто автор книги, коли відбулася публікація. Ми пройшлись по усім цим записам, та виключили всі, окрім даних найкращої якості. Таким чином, залишилась колекція з 5 мільйонів книг, 500 мільярдів слів, рядок символів у тисячу разів довший ніж геном людини - якщо написати цей текст, він простягнеться до Місяця та назад 10 разів - справжній уламок нашого культурного геному. Звісно, ми зробили, коли зіштовхнулися з такою обурливою гіперболою ... (Сміх) те, що зробив би будь-який поважаючий себе вчений. Ми взяли сторінку з XKСD та сказали: "Відійдіть, ми збираємося зайнятися наукою".
(Laughter)
(Сміх)
JM: Now of course, we were thinking, well let's just first put the data out there for people to do science to it. Now we're thinking, what data can we release? Well of course, you want to take the books and release the full text of these five million books. Now Google, and Jon Orwant in particular, told us a little equation that we should learn. So you have five million, that is, five million authors and five million plaintiffs is a massive lawsuit. So, although that would be really, really awesome, again, that's extremely, extremely impractical. (Laughter)
ЖМ: Звісно, ми подумали, що ж, давайте спочатку викладемо дані для людей, що опрацюють їх науково. Тож ми подумали, які дані ми можемо опублікувати? Звісно, хотілося взяти та видати усі тексти цих пяти мільйонів книг. Google та особоливо Джон Орвант навчили нас невеликому рівнянню. Отже, є п'ять мільйонів книг - це п'ять мільйонів авторів та п'ять мільйонів позивачів - це величезна судова тяганина. І, хоча це було б просто неймовірно круто, знову ж таки, це дуже, просто нереально непрактично. (Сміх)
Now again, we kind of caved in, and we did the very practical approach, which was a bit less awesome. We said, well instead of releasing the full text, we're going to release statistics about the books. So take for instance "A gleam of happiness." It's four words; we call that a four-gram. We're going to tell you how many times a particular four-gram appeared in books in 1801, 1802, 1803, all the way up to 2008. That gives us a time series of how frequently this particular sentence was used over time. We do that for all the words and phrases that appear in those books, and that gives us a big table of two billion lines that tell us about the way culture has been changing.
Що ж, ми здається як піддалися та підійшли до справи дуже практично, хоча й не так круто. Ми сказали, що замість публікації повних текстів, ми опублікуємо статистику про книги. Візьмемо, для прикладу, «A gleam of happiness». Ці чотири слова ми називаємо four-gram. Ми повідомимо вам, як часто цей конкретний four-gram з'являється в книгах у 1801, 1802, 1803, і так далі аж до 2008. Це дає нам часовий ряд частоти використання даної фрази впродовж часу. Ми робимо це для усіх слів та фраз, що з'являються у цих книгах, і це дає нам велику таблицю з двох мільярдів рядків, які говорять нам, яким чином змінювалась культура.
ELA: So those two billion lines, we call them two billion n-grams. What do they tell us? Well the individual n-grams measure cultural trends. Let me give you an example. Let's suppose that I am thriving, then tomorrow I want to tell you about how well I did. And so I might say, "Yesterday, I throve." Alternatively, I could say, "Yesterday, I thrived." Well which one should I use? How to know?
ЕЛА: Ці два мільярди рядків, ми називаємо їх два мільярди n-gram. Що вони нам говорять? Окремі n-gram'и вимірюють культурні тенденції. Дозвольте навести приклад. Давайте припустимо, що я процвітаю, і завтра хочу розповісти вам, як мені було добре. Я можу сказати: "Учора я процвітав [throve]". Крім того, я можу сказати: "Учора я процвітав [thrived]". Який варіант мені використовувати? Як дізнатися?
As of about six months ago, the state of the art in this field is that you would, for instance, go up to the following psychologist with fabulous hair, and you'd say, "Steve, you're an expert on the irregular verbs. What should I do?" And he'd tell you, "Well most people say thrived, but some people say throve." And you also knew, more or less, that if you were to go back in time 200 years and ask the following statesman with equally fabulous hair, (Laughter) "Tom, what should I say?" He'd say, "Well, in my day, most people throve, but some thrived." So now what I'm just going to show you is raw data. Two rows from this table of two billion entries. What you're seeing is year by year frequency of "thrived" and "throve" over time. Now this is just two out of two billion rows. So the entire data set is a billion times more awesome than this slide.
Приблизно шість місяців тому, стан справ у цій області був таким, що можна було, наприклад, підійти до психолога з приголомшливою зачіскою та запитати: "Стів, ти експерт з неправильних дієслів. Що мені робити?" А він би відповів: "Більшість людей сказали б процвітав [thrive], та лише деякі скажуть процвітав [throve]". Як більш-менш відомо, якщо повернутися на 200 років тому назад, та запитати ось цього політика з не менш приголомшливою зачіскою, (Сміх) "Том, як мені потрібно говорити?" Він би відповів: "У мої часи більшість людей процвітала [throve], але деякі з них процвітали [thrived]". Я покажу вам неопрацьовані дані. Два рядки з таблиці в два мільярди рядків. Тут показана, частота слів "процвітав" [thrived] та "процвітав" [throve] протягом часу. І це лише два рядки з двох мільярдів. Весь набір даних в мільярд разів дивовижніший, ніж цей слайд.
(Laughter)
(Сміх)
(Applause)
(Аплодисменти)
JM: Now there are many other pictures that are worth 500 billion words. For instance, this one. If you just take influenza, you will see peaks at the time where you knew big flu epidemics were killing people around the globe.
ЖМ: Існує багато інших картинок, котрі вартують 500 мільярдів слів. Наприклад, ось ця. Якщо взяти грипп, ви побачите піки на той час, коли епідемії грипу вбивали людей по всьому світу.
ELA: If you were not yet convinced, sea levels are rising, so is atmospheric CO2 and global temperature.
ЕЛА: Якщо ви досі не переконані, рівень моря піднімається, а також вміст СО2 в атмосфері та глобальна температура.
JM: You might also want to have a look at this particular n-gram, and that's to tell Nietzsche that God is not dead, although you might agree that he might need a better publicist.
ЖМ: А також можна подивитись на оць цю N-граму, та сказати Ніцше, що Бог не мертвий, хоча можна погодитись, що йому потрібен кращий публіцист.
(Laughter)
(Сміх)
ELA: You can get at some pretty abstract concepts with this sort of thing. For instance, let me tell you the history of the year 1950. Pretty much for the vast majority of history, no one gave a damn about 1950. In 1700, in 1800, in 1900, no one cared. Through the 30s and 40s, no one cared. Suddenly, in the mid-40s, there started to be a buzz. People realized that 1950 was going to happen, and it could be big. (Laughter) But nothing got people interested in 1950 like the year 1950. (Laughter) People were walking around obsessed. They couldn't stop talking about all the things they did in 1950, all the things they were planning to do in 1950, all the dreams of what they wanted to accomplish in 1950. In fact, 1950 was so fascinating that for years thereafter, people just kept talking about all the amazing things that happened, in '51, '52, '53. Finally in 1954, someone woke up and realized that 1950 had gotten somewhat passé. (Laughter) And just like that, the bubble burst.
ЕЛА: За допомогою цих речей ви можете отримати певні абстрактні уявлення. Наприклад, дозвольте розповісти історію 1950-го року. Впродовж більшої частини історії ніхто не згадував про 1950-й. У 1700-х, 1800-х, 1900-х ніхто ним не цікавився. Протягом 30-х та 40-х років ніхто ним не цікавився. Раптово, в середині 40-х років, там здійнявся гомін. Люди зрозуміли, що скоро наступить 1950-й рік, і це може бути подією. (Сміх) Але нічого не цікавило людей сильніше у 1950-му, ніж сам 1950-й. (Сміх) Люди були одержимі. Вони не могли перестати говорити про речі, які вони зробили у 1950-му, про все, що вони планували зробити у 1950-му. про усі мрії, які вони хотіли реалізувати у 1950-му. Насправді, 1950-й був настільки захоплюючим, що протягом багатьох років після цього люди просто продовжували говорити про всі дивовижні речі, які сталися у 1951, 1952, 1953. Нарешті, у 1954-му хтось прокинувся й усвідомив, що 1950-й рік застарів. (Сміх) І просто так бульбашка лопнула.
(Laughter)
(Сміх)
And the story of 1950 is the story of every year that we have on record, with a little twist, because now we've got these nice charts. And because we have these nice charts, we can measure things. We can say, "Well how fast does the bubble burst?" And it turns out that we can measure that very precisely. Equations were derived, graphs were produced, and the net result is that we find that the bubble bursts faster and faster with each passing year. We are losing interest in the past more rapidly.
Історія 1950-го повторюється для кожного року, про який у нас є дані, с невеликими змінами, тому що тепер у нас є ось ці гарні графіки. Завдяки цим графікам, ми можемо вимірювати речі. Ми можемо сказати: "Як швидко це бульбашка лопне?" І виходить, що ми можемо виміряти це дуже точно. Рівняння були отримані, графіки побудовані, і кінцевим результатом стало те, що бульбашки лопаються все швидше та швидше з кожним роком. Ми втрачаємо інтерес до минулого все більш швидкими темпами.
JM: Now a little piece of career advice. So for those of you who seek to be famous, we can learn from the 25 most famous political figures, authors, actors and so on. So if you want to become famous early on, you should be an actor, because then fame starts rising by the end of your 20s -- you're still young, it's really great. Now if you can wait a little bit, you should be an author, because then you rise to very great heights, like Mark Twain, for instance: extremely famous. But if you want to reach the very top, you should delay gratification and, of course, become a politician. So here you will become famous by the end of your 50s, and become very, very famous afterward. So scientists also tend to get famous when they're much older. Like for instance, biologists and physics tend to be almost as famous as actors. One mistake you should not do is become a mathematician. (Laughter) If you do that, you might think, "Oh great. I'm going to do my best work when I'm in my 20s." But guess what, nobody will really care.
ЖМ: Невелика кар'ерна порада. Для тих із вас, хто прагне слави, можна навчитися у 25-ти найвідоміших політиків, авторів, акторів і т.д. Якщо ви хочете рано стати знаменитимм, вам потрібно бути актором, тому, що слава почне зростати близько кінця вашого третього десятку - ви досі молоді, і це чудово. Якщо ви можете трішки почекати, тоді вам потрібно стати автором, тому, що це дозволить піднятися на більші висоти, як Марк Твен, наприклад, дуже відомий. Але якщо ви хочете піднятися на саму вершину, потрібно відкласти задоволення і, звісно, стати політиком. Ви станете відомими під кінець вашого шостого десятку, та станете дуже, дуже відомими потім. Вчені також стають знаменитими, коли вони стають набагато старішими. Наприклад, біологи та фізики стають приблизно такими ж відомими як і актори. Помилкою, яку робити не варто - ставати математиком. (Сміх) У цьому випадку, ви можете думати: "Чудово. Свої накращі роботи я зроблю до тридцяти років". Але знаете що? Це нікого не цікавить.
(Laughter)
(Сміх)
ELA: There are more sobering notes among the n-grams. For instance, here's the trajectory of Marc Chagall, an artist born in 1887. And this looks like the normal trajectory of a famous person. He gets more and more and more famous, except if you look in German. If you look in German, you see something completely bizarre, something you pretty much never see, which is he becomes extremely famous and then all of a sudden plummets, going through a nadir between 1933 and 1945, before rebounding afterward. And of course, what we're seeing is the fact Marc Chagall was a Jewish artist in Nazi Germany.
ЕЛА: Існують більш серьйозніші речі в N-граммах. Наприклад, ось траекторія Марка Шагала, художника, що народився у 1887-му. Виглядає, як нормальна траекторія знаменитої людини. Він стає все більш і більш знаменитим, за виключенням відомості серед німців. Якщо подивитися на німецьку мову, ви бачите щось зовсім дивне, те, що ви майже ніколи не бачите - він стає надзвичайно відомим, а потім раптом різко падає, переживає надир між 1933 і 1945, перш ніж повертається знову. Звісно, ми бачимо факт того, що Марк Шагал був єврейським художником у нацистській Німеччині.
Now these signals are actually so strong that we don't need to know that someone was censored. We can actually figure it out using really basic signal processing. Here's a simple way to do it. Well, a reasonable expectation is that somebody's fame in a given period of time should be roughly the average of their fame before and their fame after. So that's sort of what we expect. And we compare that to the fame that we observe. And we just divide one by the other to produce something we call a suppression index. If the suppression index is very, very, very small, then you very well might be being suppressed. If it's very large, maybe you're benefiting from propaganda.
Ці сигнали настільки сильні, що нам не потрібно знати, що хтось піддавався цензурі. Ми можемо це зрозуміти, використовуючи найпростіший аналіз сигналів. Ось простий спосіб це зробити. Доцільно припустити, що чиясь слава в даний період часу повинна бути приблизно рівна середньому рівню слави до і слави після. Це те, чого ми очікуємо. Ми порівнюємо це зі славою, яку ми спостерігаємо. А потім ділимо одне на інше, щоб отримати дещо, що ми називаємо індексом пригнічення. Якщо індекс пригнічення дуже, дуже, дуже низький, то найбільш ймовірно, що ви дійсно зазнаєте утисків. Коли він дуже великий, напевне, ви отримуєте зиск від пропаганди.
JM: Now you can actually look at the distribution of suppression indexes over whole populations. So for instance, here -- this suppression index is for 5,000 people picked in English books where there's no known suppression -- it would be like this, basically tightly centered on one. What you expect is basically what you observe. This is distribution as seen in Germany -- very different, it's shifted to the left. People talked about it twice less as it should have been. But much more importantly, the distribution is much wider. There are many people who end up on the far left on this distribution who are talked about 10 times fewer than they should have been. But then also many people on the far right who seem to benefit from propaganda. This picture is the hallmark of censorship in the book record.
ЖМ: Тепер можна подивитись на розподілення індексів подавлення по всьому населенню. Наприклад, тут: це індекс подавлення для 5 тисяч людей, взятих з англійських книг, де відомо про відсутність цензури, він, приблизно, ось такий, сконцентрований біля одиниці. Очікуване співпадає з тим, що ми спостерігаємо. Це розподілення спостерігалось у Німеччині - воно зовсім інше, зміщене вліво. Люди говорили про це в вдвічі менше, ніж мали-б. Але, що більш важливо, розподілення набагато ширше. Про більшість людей, які опиняються на лівому боці цього розподілу говорять у 10 разів менше, ніж повинні. Але і багато людей на правому краю, які отримують вигоди від пропаганди. Ця картинка є характерною ознакою цензури в історії книг.
ELA: So culturomics is what we call this method. It's kind of like genomics. Except genomics is a lens on biology through the window of the sequence of bases in the human genome. Culturomics is similar. It's the application of massive-scale data collection analysis to the study of human culture. Here, instead of through the lens of a genome, through the lens of digitized pieces of the historical record. The great thing about culturomics is that everyone can do it. Why can everyone do it? Everyone can do it because three guys, Jon Orwant, Matt Gray and Will Brockman over at Google, saw the prototype of the Ngram Viewer, and they said, "This is so fun. We have to make this available for people." So in two weeks flat -- the two weeks before our paper came out -- they coded up a version of the Ngram Viewer for the general public. And so you too can type in any word or phrase that you're interested in and see its n-gram immediately -- also browse examples of all the various books in which your n-gram appears.
ЕЛА: Культуроміка - ось як ми називаємо цей метод. Це ніби як геноміка. Хіба що, геноміка це лінза для біології, погляд через вікно послідовностей основ генома людини. Культуроміка схожа. Це застосування аналізу набору даних величезного маштабу для вивчення людської культури. А тут, замість лінзи геному, ми дивимось через лінзу оцифрованих частинок історії. Чудовим аспектом культуроміки є те, що будь-хто може нею зайнятися. Чому ж будь-хто може нею зайнятися? Кожен може робити це, тому що троє хлопців, Джон Орвант, Метт Грей та Уилл Брокман з Google, побачивши прототип засобу перегляду N-грамм, сказали: "Це так весело. Ми повинні зробити це доступним для людей". Рівно через два тижні - за два тижні до публікації нашої статті - вони запрограмували публічну версію засобу перегляду N-грам. Тепер і ви можете надрукувати будь-яке слово або речення, яке вас цікавить, і відразу подивитись його N-грами, включаючи перегляд прикладів із усіх тих різних книг, в яких зустрічається ваша N-грамма.
JM: Now this was used over a million times on the first day, and this is really the best of all the queries. So people want to be their best, put their best foot forward. But it turns out in the 18th century, people didn't really care about that at all. They didn't want to be their best, they wanted to be their beft. So what happened is, of course, this is just a mistake. It's not that strove for mediocrity, it's just that the S used to be written differently, kind of like an F. Now of course, Google didn't pick this up at the time, so we reported this in the science article that we wrote. But it turns out this is just a reminder that, although this is a lot of fun, when you interpret these graphs, you have to be very careful, and you have to adopt the base standards in the sciences.
ЖМ: В перший же день цим скористалися більше мільйона разів, і це - найкраще із усіх запитів. Люди хочуть показати себе з найкращої сторони. Але виявляється, що у 18-му столітті людей це зовсім не цікавило. Вони не хотіли показати себе з кращої [best], вони хотіли показати себе з кращої сторони [beft]. Як зазвичай, це була просто помилка. Це не прагнення до посередньості, просто буква S писалася по іншому, схоже на F. Звісно, Google тоді це не дослідив, тому ми відмітили це в написаній нами науковій статті. Але виявляється, це всього лише нагадування про те, що, хоча це дуже весело, при інтерпритації цих графіків ви повинні бути дуже обережні і ви маєте керуватись базовими нормами наукових досліджень.
ELA: People have been using this for all kinds of fun purposes. (Laughter) Actually, we're not going to have to talk, we're just going to show you all the slides and remain silent. This person was interested in the history of frustration. There's various types of frustration. If you stub your toe, that's a one A "argh." If the planet Earth is annihilated by the Vogons to make room for an interstellar bypass, that's an eight A "aaaaaaaargh." This person studies all the "arghs," from one through eight A's. And it turns out that the less-frequent "arghs" are, of course, the ones that correspond to things that are more frustrating -- except, oddly, in the early 80s. We think that might have something to do with Reagan.
ЕЛА: Як тільки люди цим не користувались. (Сміх) Насправда, говорити нічого не потрібно, ми просто збираємося показати вам усі слайди мовчки. Ця людина була зацікавлена в історії розчарування. Існують різні види розчарування. Якщо ви ударились великим пальцем, це "ах" з одним А. Якщо планета Земля буде знищена Вогонами, щоб звільнити місце для міжгалактичного тунелю, це "аааааааах" з вісьмома А. Ця людина вивчила усі "ахи", які містять від одного до восьми А. Виходить, найбільш рідкими "ахами" являються ті, які відносяться до найстрашніших речей, окрім, як не дивно, початку 80-х. Напевне, Рейган має до цього відношення.
(Laughter)
(Сміх)
JM: There are many usages of this data, but the bottom line is that the historical record is being digitized. Google has started to digitize 15 million books. That's 12 percent of all the books that have ever been published. It's a sizable chunk of human culture. There's much more in culture: there's manuscripts, there newspapers, there's things that are not text, like art and paintings. These all happen to be on our computers, on computers across the world. And when that happens, that will transform the way we have to understand our past, our present and human culture.
ЖМ: Ці дані можна використовувати по різному, але суть в тому, що історія оцифровується. Google почав оцифровувати 15 мільйонів книг. Це 12 відсотків усіх книг, які коли-небудь були опубліковані. Це значна частина людської культури. Але в культурі набагато більше речей: рукописи, газети, нетекстові речі, наприклад, мистецтво і картини. Все це виявляється на наших комп'ютерах, на комп'ютерах по всьому світу. І коли це трапиться, це змінить те, як ми розуміємо минуле, сьогодення та людську культуру.
Thank you very much.
Дуже дякую.
(Applause)
(Оплески)