Erez Lieberman Aiden: Everyone knows that a picture is worth a thousand words. But we at Harvard were wondering if this was really true. (Laughter) So we assembled a team of experts, spanning Harvard, MIT, The American Heritage Dictionary, The Encyclopedia Britannica and even our proud sponsors, the Google. And we cogitated about this for about four years. And we came to a startling conclusion. Ladies and gentlemen, a picture is not worth a thousand words. In fact, we found some pictures that are worth 500 billion words.
Erez Lieberman Aiden: Herkes bilir ki bir resim 1000 kelimeye değerdir. Ama Harvard'daki bizler bunun gerçekten doğru olup olmadığını merak ediyorduk. (Gülüşmeler) Böylece, Harvard, MIT, American Heritage Sözlüğü, Britannica Ansiklopedisi, ve gururlu sponsorlarımız Google'ın da arasında bulunduğu uzmanlardan oluşan bir ekip hazırladık. ve 4 yıl kadar bunun üzerinde düşündük. Ve şaşırtıcı bir sonuca vardık. Bayanlar baylar, bir resim 1000 kelimeye değer değil. Hatta, biz 500 milyar kelimeye değer resimler bulduk.
Jean-Baptiste Michel: So how did we get to this conclusion? So Erez and I were thinking about ways to get a big picture of human culture and human history: change over time. So many books actually have been written over the years. So we were thinking, well the best way to learn from them is to read all of these millions of books. Now of course, if there's a scale for how awesome that is, that has to rank extremely, extremely high. Now the problem is there's an X-axis for that, which is the practical axis. This is very, very low.
Jean-Baptiste Michel: peki bu sonuca nasıl vardık? Erez ve ben, insan kültürünün ve insanlık tarihinin zamanla değişiminin genel bir tablosunu oluşturmak istiyorduk. Yıllar içinde o kadar çok kitap yazılmış ki. Biz de düşündük ki. onlardan öğrenmenin en iyi yolu tüm bu milyonlarca kitapları okumak. Tabiki eğer bunun ne kadar süper bir şey olduğunu gösteren bir grafik varsa, bu çok çok yüksek bir sıralamaya sahip olmalı. Problem şu ki, bir de X ekseni var, ki o da kullanışlılık ekseni. Bu da çok çok düşük bir seviyede.
(Applause)
(Alkışlar)
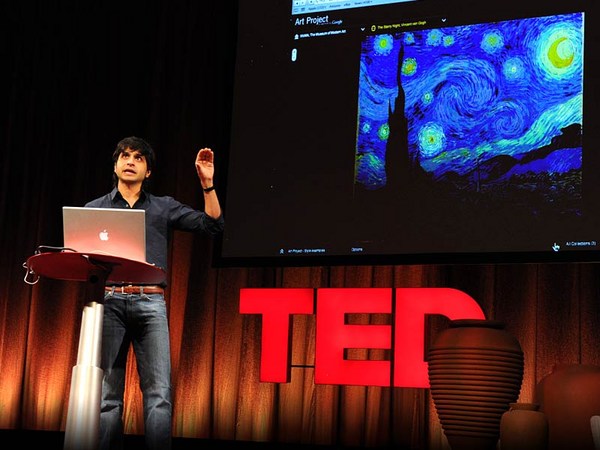
Now people tend to use an alternative approach, which is to take a few sources and read them very carefully. This is extremely practical, but not so awesome. What you really want to do is to get to the awesome yet practical part of this space. So it turns out there was a company across the river called Google who had started a digitization project a few years back that might just enable this approach. They have digitized millions of books. So what that means is, one could use computational methods to read all of the books in a click of a button. That's very practical and extremely awesome.
Şimdi insanlar alternatif bir yaklaşım kullanmaya meyilli, bu da bir kaç kaynağı almak ve onlar dikkatlice okumak. Bu inanılmaz kullanışlı, ama o kadar süper değil. Gerçekte yapmak istediğiniz şey süper ama kullanışlı olan bu alana gelmek. Öğrendik ki bir kaç sene önce bir dijitalizasyon projesi başlatan bu yaklaşımı mümkün kılabilecek nehrin ötesinde Google adında bir şirket varmış. Mİlyonlarca kitabı dijitalize hale getirdiler. Yani bu şu anlama geliyor: biri bu kitapların hepsini okumak için bir klikle bilgisayarlı methodları kullanabilir. Bu çok kullanışlı ve inanılmaz süper.
ELA: Let me tell you a little bit about where books come from. Since time immemorial, there have been authors. These authors have been striving to write books. And this became considerably easier with the development of the printing press some centuries ago. Since then, the authors have won on 129 million distinct occasions, publishing books. Now if those books are not lost to history, then they are somewhere in a library, and many of those books have been getting retrieved from the libraries and digitized by Google, which has scanned 15 million books to date.
ELA: Sizlere biraz kitapların nereden geldiğinden bahsedeyim. Zamanın başlangıcından beri, yazarlar vardı. Bu yazarlar kitap yazmak için çabalayıp durdular. Bir kaç yüzyıl önce matbaa makinesinin geliştirilmesiyle bu gittikçe kolaylaştı. O zamandan beri, 129 milyon farklı vesilelerle kitaplar yayınlayarak, yazarlar kazandı. Şimdi ise bu kitaplar tarih arasında kaybolup gitmediyse bir kütüphanenin tekinde ve bu kitapların çoğu kütüphanelerden getirtiliyor, ve günümüze kadar 15 milyon kitabı taramış olan, Google tarafından dijitalize hale getiriliyorlar.
Now when Google digitizes a book, they put it into a really nice format. Now we've got the data, plus we have metadata. We have information about things like where was it published, who was the author, when was it published. And what we do is go through all of those records and exclude everything that's not the highest quality data. What we're left with is a collection of five million books, 500 billion words, a string of characters a thousand times longer than the human genome -- a text which, when written out, would stretch from here to the Moon and back 10 times over -- a veritable shard of our cultural genome. Of course what we did when faced with such outrageous hyperbole ... (Laughter) was what any self-respecting researchers would have done. We took a page out of XKCD, and we said, "Stand back. We're going to try science."
Şimdi Google bir kitabı dijitalize hale getirdiğinde, onu çok güzel bir formatla sunuyorlar. Şimdi elimizde veri var ve meta veri var. Kitabın nerede basıldığı, yazarın kim olduğu ne zaman basıldığı gibi şeyler hakkında bilgimiz var. Yaptığımız ise bütün bu bilgileri taramak ve yüksek kaliteli olmayan tüm verileri ayıklamak. Elimizde kalan şey ise 5 milyon kitabın 500 milyar kelimenin toplamı, kültürel genomumuzun gerçek bir parçası, açık açık yazıldığında, buradan aya kadar, 10 kez gidip gelebilecek, insan genomundan 1000 kere daha uzun olan bir karakterler dizisi. Böyle aşırı abartılı bir durumla karşı karşıya kaldığımızda yaptığımız şey (Gülüşmeler) kendine saygısı olan her araştırmacının yapacağı şeydi. XKDC'den bir sayfayı aldık, ve "Sıkı durun, bilim yapmayı deneyeceğiz" dedik.
(Laughter)
(Gülüşmeler)
JM: Now of course, we were thinking, well let's just first put the data out there for people to do science to it. Now we're thinking, what data can we release? Well of course, you want to take the books and release the full text of these five million books. Now Google, and Jon Orwant in particular, told us a little equation that we should learn. So you have five million, that is, five million authors and five million plaintiffs is a massive lawsuit. So, although that would be really, really awesome, again, that's extremely, extremely impractical. (Laughter)
JM: Tabii ki, şöyle düşündük, bilimle ilgilenen insanlar için elimizdeki datayı ortaya koyalım. Düşünmeye başladık, hangi datayı yayınlayabiliriz? Tabii ki, bu kitapları alıp bu 5 milyon kitabın tam metinlerini yayınlamak istiyorsunuz. Google'dakiler, özellikle Jon Orwant, bize öğrenmemiz gereken bir denklemden bahsettiler. Şimdi elinizde 5 milyon yazar var ve 5 milyon davacı devasa bir toplu dava demek. Yani bu her ne kadar çok çok süper bir şey olsa da, tekrar edelim, çok ama çok kullanışsız. (Gülüşmeler)
Now again, we kind of caved in, and we did the very practical approach, which was a bit less awesome. We said, well instead of releasing the full text, we're going to release statistics about the books. So take for instance "A gleam of happiness." It's four words; we call that a four-gram. We're going to tell you how many times a particular four-gram appeared in books in 1801, 1802, 1803, all the way up to 2008. That gives us a time series of how frequently this particular sentence was used over time. We do that for all the words and phrases that appear in those books, and that gives us a big table of two billion lines that tell us about the way culture has been changing.
Ve tekrardan, boyun eğdik, ve o kadar süper olmayan kullanışlı yaklaşımı kullandık. Tam metini yayınlamak yerine, kitaplar hakkında istatistikleri yayınlayalım dedik. "Bir Pırıltı Mutluluk" 'u ele alalım. 3 kelime; biz buna üç-gram dedik. Size bu üç-gram'ın 1801, 1802, 1803 ten baslayip 2008'e kadar olan kitaplarda kaç defa geçtiğini söyleyeceğiz. Bu, bize bu cümlenin zaman içinde kaç defa tekrarladığını gösteren bir zaman dizini sunacak. Bu yöntemi, bu kitaplardaki tüm kelime ve deyimlere uygularsak sonunda elimizde kültürümüzün ne şekilde değistigini gösteren iki milyar satırlık bir tablo ortaya çıkacak.
ELA: So those two billion lines, we call them two billion n-grams. What do they tell us? Well the individual n-grams measure cultural trends. Let me give you an example. Let's suppose that I am thriving, then tomorrow I want to tell you about how well I did. And so I might say, "Yesterday, I throve." Alternatively, I could say, "Yesterday, I thrived." Well which one should I use? How to know?
ELA: Peki, bu iki milyar satır, bunlara iki milyar n-gram diyelim. Bize ne söylüyorlar? Yalın n-gramlar, kültürel trendleri ölçmeye yarıyor. Bir örnek vermeme izin verin. Diyelim ki ben çok başarılı oldum. ve ertesi gün size ne kadar başarılı olduğumu söylemek istedim. Diyebilirim ki, ben dün "başardım." (throve) Ya da diyebilirim ki "başardım". (thrived) Hangisini kullanmalıyım? Nasıl bileceğiz?
As of about six months ago, the state of the art in this field is that you would, for instance, go up to the following psychologist with fabulous hair, and you'd say, "Steve, you're an expert on the irregular verbs. What should I do?" And he'd tell you, "Well most people say thrived, but some people say throve." And you also knew, more or less, that if you were to go back in time 200 years and ask the following statesman with equally fabulous hair, (Laughter) "Tom, what should I say?" He'd say, "Well, in my day, most people throve, but some thrived." So now what I'm just going to show you is raw data. Two rows from this table of two billion entries. What you're seeing is year by year frequency of "thrived" and "throve" over time. Now this is just two out of two billion rows. So the entire data set is a billion times more awesome than this slide.
Bundan yaklaşık altı ay önce bu sorunun yanıtını öğrenmek için mesela bu muhteşem saçlara sahip psikoloğa gider ve derdiniz ki, "Steve, sen düzensiz fiil çekimi konusunda tam bir uzmansın. Hangisini ( throve veya thrived) kullanmam gerekir?" O da size derdi ki "Bak insanların çoğu 'thrived' diyor, ama bazıları 'thrıve' da diyorlar." Ve şunu da biliyorsunuz ki, eğer bundan 200 yıl önceye gidebiliyor olsanız ve aynı derece müthiş saçlara sahip bu devlet adamına aynı soruyu sorsanız, (Gülüşmeler) "Tom, hangisini kullanmalıyım?" deseniz O size " Bak, benim zamanımda çoğu insan 'throve' diyordu, ama bazıları 'thrived' da der." diyecektir. Öylese şimdi sizle ham veriyi paylaşacağım. Bu tablodaki iki sıra, iki milyar kayıt demek. Burada gördüğünüz zaman içinde "thrived" ve "throve" kelimelerinin yıllık frekansı. Burada gördüğünüz, iki milyar satırdan sadece iki tanesi. Yani aslında veri setinin tamamı bu slaytta gördüşünüzden milyar kez daha müthiş.
(Laughter)
(Gülüşmeler)
(Applause)
(Alkışlar)
JM: Now there are many other pictures that are worth 500 billion words. For instance, this one. If you just take influenza, you will see peaks at the time where you knew big flu epidemics were killing people around the globe.
JM: Şimdi, 500 milyar kelime eden çok farklı başka resimler de var. mesela bu gördüğünüz. Eğer sadece grip virüsünü alırsanız, dünyada insanların ölümüne neden olan bir grip salgını olduğu zamanlarda pik yaptığını görürsünüz.
ELA: If you were not yet convinced, sea levels are rising, so is atmospheric CO2 and global temperature.
ELA: Eğer hala deniz seviyesinin yükseldiğine ve atmosferik CO2 ve yerkürenin ısısının arttığına ikna olmadıysanız buna bakabilirsiniz.
JM: You might also want to have a look at this particular n-gram, and that's to tell Nietzsche that God is not dead, although you might agree that he might need a better publicist.
JM: Ya da bu diğer n-grama bakarsanız, Nietzsche'ye Tanrıinın ölmediğini söyleyebilirsiniz, ama siz de kabul edeceksiniz ki daha iyi bir halkla ilişkiler uzmanına ihtiyacı var.
(Laughter)
(Gülüşmeler)
ELA: You can get at some pretty abstract concepts with this sort of thing. For instance, let me tell you the history of the year 1950. Pretty much for the vast majority of history, no one gave a damn about 1950. In 1700, in 1800, in 1900, no one cared. Through the 30s and 40s, no one cared. Suddenly, in the mid-40s, there started to be a buzz. People realized that 1950 was going to happen, and it could be big. (Laughter) But nothing got people interested in 1950 like the year 1950. (Laughter) People were walking around obsessed. They couldn't stop talking about all the things they did in 1950, all the things they were planning to do in 1950, all the dreams of what they wanted to accomplish in 1950. In fact, 1950 was so fascinating that for years thereafter, people just kept talking about all the amazing things that happened, in '51, '52, '53. Finally in 1954, someone woke up and realized that 1950 had gotten somewhat passé. (Laughter) And just like that, the bubble burst.
ELA: Bu tip birşeyi kullanarak epey soyut kavramlara varabilirsiniz. mesela izin verin size 1950 yılının hikayesini anlatayım. Tarih boyunca 1950 yılı kimsenin pek de umrunda olmadı. 1700'ler, 1800'ler veya 1900'lerde kimsenin umrunda değildi. 30'lar ve 40'larda da öyle. Kimse takmadı. Birden, 40'lı yılların ortasında, bir uğultu ortaya çıkmaya başladı. İnsanlar 1950'nin yaklaştığını fark ettiler, ve bu büyük bir olaydı. (Gülüşmeler) Ama 1950'lerde hiçbir şey insanları 1950 yılı kadar çok ilgilendirmedi. (Gülüşmeler) İnsanlar kafayı yemişlerdi, 1950'de yaptıkları şeykeri anlatmaktan başka hiçbir şey yapmadan ortalıkta dolanıyorladı, 1950'de yapmayı planladıkları şeyler, 1950'de kavuşmayı umdukları bütün hayalleri. Aslında, 1950 öylesine inanılmazdı ki, geçtikten yıllarca sonra bile, bu müthiş yıl ve onda olup bitenlerden bahsettiler. 1951, 52, 53 yıllarında. Sonunda 1954 yılında biri uyandı ve nihayet insanlar 1950'nin geçip gitmiş olduğunu fark ettiler. (Gülüşmeler) Birdenbire, patlayan bir balon gibi.
(Laughter)
(Gülüşmeler)
And the story of 1950 is the story of every year that we have on record, with a little twist, because now we've got these nice charts. And because we have these nice charts, we can measure things. We can say, "Well how fast does the bubble burst?" And it turns out that we can measure that very precisely. Equations were derived, graphs were produced, and the net result is that we find that the bubble bursts faster and faster with each passing year. We are losing interest in the past more rapidly.
Ve 1950 yılının hikayesi aslında yaşadığımız her yılın hikayesi. Ufak tefek farklılıklar, çünkü artık bu güzel grafiklere sahibiz. Bunlara sahip olduğumuz için bazı şeyleri ölçümleyebiliyoruz. Böylece şunu sorabiliyoruz, "Balonun patlaması ne kadar sürer?" ve görünen o ki artık bunu oldukça hassas şekilde ölçebiliyoruz. Formüller yazıyor, grafikler çiziyoruz, ve net sonuç şu ki her geçen yıl bu baloncuklar daha kolay sönüyor. Her geçen yıl geçmişe olan ilgimizi daha büyük bir hızla kaybediyoruz.
JM: Now a little piece of career advice. So for those of you who seek to be famous, we can learn from the 25 most famous political figures, authors, actors and so on. So if you want to become famous early on, you should be an actor, because then fame starts rising by the end of your 20s -- you're still young, it's really great. Now if you can wait a little bit, you should be an author, because then you rise to very great heights, like Mark Twain, for instance: extremely famous. But if you want to reach the very top, you should delay gratification and, of course, become a politician. So here you will become famous by the end of your 50s, and become very, very famous afterward. So scientists also tend to get famous when they're much older. Like for instance, biologists and physics tend to be almost as famous as actors. One mistake you should not do is become a mathematician. (Laughter) If you do that, you might think, "Oh great. I'm going to do my best work when I'm in my 20s." But guess what, nobody will really care.
JM: Siz ufak bir kariyer önerisi. Eğer aranızda ünlü olmayı planlayanlar varsa, bu 25 ünlü politik figürden, yazardan ve aktörden birşeyler öğrenebilirsiniz. Eğer genç yaşta ünlü olmak isterseniz, aktör olmalısınız, çünkü onlar 20'li yaşların sonunda ünlü olmaya başlıyorlar -- hala genç bir yaş, süper. Eğer biraz daha bekleyecek olursanız, o zaman yazar olmalısınız, çünkü o zaman çok ama çok ünlü olabilirsiniz. Mark Twain gibi mesela: çok çok ünlü. Ama en tepeye ulaşmak istiyorsanız, o zaman ünlü olmak için daha beklemeli ve elbette ki poitikacı olmalısınız. Böylece 50 yaş civarında ünlü olabilir, ve hayatınızın sonrasını çok ama çok ünlü geçirebilirsiniz. Bilimadamlar çok daha geç yaşlarda ünlü oluyorlar. Mesela biyologlar ve fizikçiler neredeyse aktörler kadar ünlü olabilirler. Ama yapacağınız en büyük hata Matematikçi olmak olacaktır. (Gülüşmeler) Eğer bunu yaparsanız, şöyle düşünebilirsiniz, " Şahane, 20'li yaşlarda en önemli çalışmalarımı yapacağım." Ama bilin bakalım ne olacak: kimse sizi umursamayacak.
(Laughter)
(Gülüşmeler)
ELA: There are more sobering notes among the n-grams. For instance, here's the trajectory of Marc Chagall, an artist born in 1887. And this looks like the normal trajectory of a famous person. He gets more and more and more famous, except if you look in German. If you look in German, you see something completely bizarre, something you pretty much never see, which is he becomes extremely famous and then all of a sudden plummets, going through a nadir between 1933 and 1945, before rebounding afterward. And of course, what we're seeing is the fact Marc Chagall was a Jewish artist in Nazi Germany.
ELA: n-gramlardan elde edebileceğiniz daha fena veriler de var. Mesela, Marc Chagall'ın trajedisini ele alalım. 1887 yılında doğmuş bir sanatçı. Bu gördüğünüz ünlü bir insanın normal grafiğini gösteriyor. her geçen gün daha ünlü oluyor, ama eğer Almanca kayıtlara bakarsanız, Almanca kayıtlarda çok acaip birşey göreceksiniz, daha önce pek görmediğiniz birşey. Çok çok ünlü olurken, birden bire adeta yok oluyor. 1933-1945 yılları arasında birden bire düşüyor, daha sonra da tekrar yükseliyor. Ve burada gördüğümz şeyin açıklaması da Marc Chagall'ın Nazi Almanyası'nda Yahudi bir sanatçı olmaından kaynaklanıyor.
Now these signals are actually so strong that we don't need to know that someone was censored. We can actually figure it out using really basic signal processing. Here's a simple way to do it. Well, a reasonable expectation is that somebody's fame in a given period of time should be roughly the average of their fame before and their fame after. So that's sort of what we expect. And we compare that to the fame that we observe. And we just divide one by the other to produce something we call a suppression index. If the suppression index is very, very, very small, then you very well might be being suppressed. If it's very large, maybe you're benefiting from propaganda.
Bu işaretler öylesine güçlü ki birinin sansürlendiğini önceden bilmenize gerek yok. Bunu basit veri işleme yolu ile kendiniz bulabilirsiniz. İşte bunu yapmanın basit bir yolu. Bir kimsenin herhangi bir zamandaki ün miktarı, kabaca ünlü olmadan önceki ve ünlü olduktan sonraki ün miktarlarının ortalaması olmalıdır. Görmeyi beklediğimiz şey budur. Ve bu veriyi gözlemlediğimiz ünle karşılaştırırız. Sonra bunları birbirine bölerek baskılama indeksi dediğimiz bir rakam buluruz. Eğer baskılama indeksi çok çok küçük bir rakamsa, baskılanmış olma ihtimaliniz çok yüksektir. Eğer çok büyükse o zaman da propogandayla pomplanmış olma ihtimaliniz vardır.
JM: Now you can actually look at the distribution of suppression indexes over whole populations. So for instance, here -- this suppression index is for 5,000 people picked in English books where there's no known suppression -- it would be like this, basically tightly centered on one. What you expect is basically what you observe. This is distribution as seen in Germany -- very different, it's shifted to the left. People talked about it twice less as it should have been. But much more importantly, the distribution is much wider. There are many people who end up on the far left on this distribution who are talked about 10 times fewer than they should have been. But then also many people on the far right who seem to benefit from propaganda. This picture is the hallmark of censorship in the book record.
JM: Şimdi, eğer toplumların genel baskılanma indekslerinin dağılımına bakacak olursanız, mesela burada -- 5000 kişinin baskılama indeksleri var, bilinen bir baskılama olmayan İngilizce kitaplar bunlar -- buna benzer birşey olacaktır, ortada yoğunlaşıyor. Kısaca görmeyi beklediğiniz şey ile gördüşünüz aynıdır. Almanya'da gördüğümüz dağılım ise bu -- çok farklı, sola doğru kaymış durumda. İnsanlar bunlar hakkında konuşmuş olmaları gerekenin yarısı kadar konuşmuşlar, daha da önemlisi, dağılım çok daha geniş. Dağılımın en solunda yer alan pek çok insan var, bunlar haklarında beklenenden 10 kat daha az konuşulmuş olan insanlar. Ama en sağda da başkaları var. Bunlar da propoganda'dan faydalanmış kimseler. Bu şekil, kitaplardaki sansürün fotoğrafı.
ELA: So culturomics is what we call this method. It's kind of like genomics. Except genomics is a lens on biology through the window of the sequence of bases in the human genome. Culturomics is similar. It's the application of massive-scale data collection analysis to the study of human culture. Here, instead of through the lens of a genome, through the lens of digitized pieces of the historical record. The great thing about culturomics is that everyone can do it. Why can everyone do it? Everyone can do it because three guys, Jon Orwant, Matt Gray and Will Brockman over at Google, saw the prototype of the Ngram Viewer, and they said, "This is so fun. We have to make this available for people." So in two weeks flat -- the two weeks before our paper came out -- they coded up a version of the Ngram Viewer for the general public. And so you too can type in any word or phrase that you're interested in and see its n-gram immediately -- also browse examples of all the various books in which your n-gram appears.
ELA: Biz bu yönteme Kültüromik adını verdik. Biraz Genomik gibi. Ancak genomik insan genomundaki baz dizilimi aracılığı ile biyoloji bilimine bir pencere açıyor. Kültüromik de buna benziyor. İnsan kültrünü incelemek için yapılan çok yoğun bir veri toplama analizi uygulaması. Burada, genomdaki pencere yerine dijital hale getirilmiş tarihsel verilerin penceresinden bakıyoruz. Kültüromik ile ilgili müthiş olan şey bunu herkesin yapabiliyor olması. Nasıl herkes yapabilir? herkes yapabilir, çünkü üç kişi Google'da çalışan Jon Orwant, Matt Gray ve Wıll Brockman, Ngram prototipine baktılar ve dediler ki, " Bu çok eğlenceli birşey. Bunu herkesin ulaşabileceği hale getirmemiz lazım." Ve iki hafta içinde -- bizim makalemiz yayınlanmadan iki hafta önce -- herkesin kullanımına açık bir Ngram versiyonu programladılar. ve artık siz de ilginizi çeken bir kelime ya da deyim yazarak ona ait n-gramı hemen görebilirsiniz -- ve sizin n-gramınızın yer aldığı kitapları tarayabilirsiniz.
JM: Now this was used over a million times on the first day, and this is really the best of all the queries. So people want to be their best, put their best foot forward. But it turns out in the 18th century, people didn't really care about that at all. They didn't want to be their best, they wanted to be their beft. So what happened is, of course, this is just a mistake. It's not that strove for mediocrity, it's just that the S used to be written differently, kind of like an F. Now of course, Google didn't pick this up at the time, so we reported this in the science article that we wrote. But it turns out this is just a reminder that, although this is a lot of fun, when you interpret these graphs, you have to be very careful, and you have to adopt the base standards in the sciences.
JM: Bu uygulama, hayata geçtiği ilk gün ir milyonda defadan fazla kullanıldı, ve bu bence en güzel sorgulardan biri. İnsanlar iyi bir şey yapmak istediklerinde "ellerinden geleni yaptılar" ama görünen o ki, 18. yüzyılda bunu pek umursamıyorlardı. O zaman "ellerinden geleni" değil, "evlerinden geleni" yapmak istediler. Aslında olan şu, be elbette bir hata. Gayret etmeyi bırakmadılar, sadece o dönemde L harfi daha farklı yazılıyordu, V'ye beziyordu biraz. Elbette, Google bunu o zaman yakalayamadı, bu nedenle bunu yazdığımız makaleye ekledik. Ama görünen o ki, bu her ne kadar eğlenceli birşey olsa da, bize şunu anımsattı bu grafikleri anlamlandırırken çok dikkatli olmanız gerekiyor. ve mutlaka bilimsel yöntemdeki temel standartları gözetmelisiniz.
ELA: People have been using this for all kinds of fun purposes. (Laughter) Actually, we're not going to have to talk, we're just going to show you all the slides and remain silent. This person was interested in the history of frustration. There's various types of frustration. If you stub your toe, that's a one A "argh." If the planet Earth is annihilated by the Vogons to make room for an interstellar bypass, that's an eight A "aaaaaaaargh." This person studies all the "arghs," from one through eight A's. And it turns out that the less-frequent "arghs" are, of course, the ones that correspond to things that are more frustrating -- except, oddly, in the early 80s. We think that might have something to do with Reagan.
ELA: İnsanlar bunu her türlü eğlenceli şey için kullanıyorlar. (Gülüşmeler) Aslında bundan sonra konuşmamız gereksiz, size sadece bazı slaytları üzerinde konuşmaksızın göstereceğiz. Bu kişi, düşkırıklığının, sıkıntının tarihçesi ile ilgileniyormuş. Düşkırıklığının birkaç çeşidi vardır. Eğer ayak parmağınızı bir yere çarpacak olursanız bu tek A harfli bir "Ah" demek. Eğer gezegenimiz dünya gezegenler arası otoyol yapmak isteyen Vogonlar tarafından işgal edilecek olursa, bu sekiz A değerinde bir "Aaaaaaaah" eder. Bu kişi bütün "Ahéları incelemiş. Tek A'lıdan sekiz A'lısına dek. Ve görmüş ki, daha can sıkıcı şeylere ait "Ah"lar daha az sıklıkla ortaya çıkıyor, ama 80'li yılların başları hariç. Biz bu durumun Reagan ile ilgili olduğunu düşünüyoruz.
(Laughter)
(Gülüşmeler(
JM: There are many usages of this data, but the bottom line is that the historical record is being digitized. Google has started to digitize 15 million books. That's 12 percent of all the books that have ever been published. It's a sizable chunk of human culture. There's much more in culture: there's manuscripts, there newspapers, there's things that are not text, like art and paintings. These all happen to be on our computers, on computers across the world. And when that happens, that will transform the way we have to understand our past, our present and human culture.
JM: Bu verilerin pek çok kullanım alanı var ama nihayetinde, bunlar tarihsel kayıtların dijital veriler hakine çevrilmesi. Google, 15 milyon kitabı dijital hale getirdi. Bu, bugüne dek basılmış kitapların %12'si demek. İnsanlığa ait kültür birikimin kayda değer bir kısmı. Kültüre ait daha pek çok veri var: yazmalar, gazeteler, yazılı olmayan şeyler, sanat ve tablolar gibi. Bunların hepsi dünyanın dört bir yanındaki bilgisayarlarımıza geçebilir. Ve bu olduğunda, insanlığın geçmişi, bu günü ve tüm yarattığı kültüre bakış açımız tamamen değişecek.
Thank you very much.
Çok teşekkürler.
(Applause)
(Alkışlar)