Erez Lieberman Aiden: Everyone knows that a picture is worth a thousand words. But we at Harvard were wondering if this was really true. (Laughter) So we assembled a team of experts, spanning Harvard, MIT, The American Heritage Dictionary, The Encyclopedia Britannica and even our proud sponsors, the Google. And we cogitated about this for about four years. And we came to a startling conclusion. Ladies and gentlemen, a picture is not worth a thousand words. In fact, we found some pictures that are worth 500 billion words.
ארז ליברמן איידן: כולם יודעים שתמונה שווה אלף מילים. אבל אנחנו בהרווארד תהינו אם זה באמת נכון. (צחוק) לכן הרכבנו צוות של מומחים שמגיעים מהרווארד, MIT, המילון למורשת אמריקאית, אנציקלופדיה בריטניקה ואפילו מנותני החסות הגאים שלנו, גוגל. הרהרנו בזה במשך כארבע שנים והגענו למסקנה מדהימה. גבירותיי ורבותיי, תמונה אינה שווה אלף מילים. בעצם, מצאנו כמה תמונות השוות 500 מיליארד מילים.
Jean-Baptiste Michel: So how did we get to this conclusion? So Erez and I were thinking about ways to get a big picture of human culture and human history: change over time. So many books actually have been written over the years. So we were thinking, well the best way to learn from them is to read all of these millions of books. Now of course, if there's a scale for how awesome that is, that has to rank extremely, extremely high. Now the problem is there's an X-axis for that, which is the practical axis. This is very, very low.
ג'ין-בפטיסט מישל: כיצד הגענו למסקנה זו? ארז ואני חשבנו על דרכים לקבלת תמונה כוללת של תרבות והיסטוריה אנושית: של שינוי לאורך זמן. כל-כך הרבה ספרים נכתבו במהלך השנים. לכן חשבנו שהדרך הכי טובה ללמוד מהם היא לקרוא את כל מיליוני הספרים. כמובן שאם יש מדד לעד כמה שזה מרשים, יש למקם אותו מאוד, מאוד גבוה. הבעיה היא שקיים גם ציר X, שהוא ציר התכליתיות במקרה זה, שעל-פיו זה מאוד, מאוד נמוך.
(Applause)
(מחיאות כפיים)
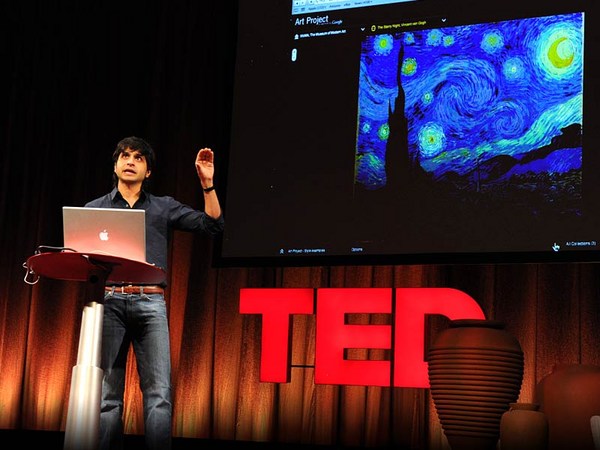
Now people tend to use an alternative approach, which is to take a few sources and read them very carefully. This is extremely practical, but not so awesome. What you really want to do is to get to the awesome yet practical part of this space. So it turns out there was a company across the river called Google who had started a digitization project a few years back that might just enable this approach. They have digitized millions of books. So what that means is, one could use computational methods to read all of the books in a click of a button. That's very practical and extremely awesome.
אנשים נוטים להשתמש בגישה אלטרנטיבית, שזה לקחת כמה מקורות ולקרוא אותם בתשומת לב. זה מאוד מעשי אבל לא מרשים. מה שבאמת צריך לעשות זה להיכנס לחלק המרשים אבל גם המעשי של סביבה זו. מתברר שיש חברה מעבר לנהר שנקראת גוגל שהחלה במיזם דיגיטליזציה לפני כמה שנים העשוי לאפשר את יישומה של גישה זו. הם ביצעו דיגיטליזציה למיליוני ספרים. זה אומר שניתן לנצל שיטות ממוחשבות כדי לקרוא את כל הספרים בלחיצת כפתור. זה מאוד מעשי וגם מרשים ביותר.
ELA: Let me tell you a little bit about where books come from. Since time immemorial, there have been authors. These authors have been striving to write books. And this became considerably easier with the development of the printing press some centuries ago. Since then, the authors have won on 129 million distinct occasions, publishing books. Now if those books are not lost to history, then they are somewhere in a library, and many of those books have been getting retrieved from the libraries and digitized by Google, which has scanned 15 million books to date.
א.ל.א.: אספר לכם קצת מאיפה הספרים מגיעים. מאז זמנים קדומים, היו כבר מיליוני סופרים. סופרים אלה שאפו לכתוב ספרים. וזה הפך לקל משמעותית עם התפתחות הדפוס לפני מספר מאות שנים. מאז, הסופרים זכו לפרסם ספרים 129 מיליון פעמים. אם כל אותם הספרים לא הלכו לאיבוד במהלך ההיסטוריה, הם נמצאים בספריות, ורבים מבין הספרים האלה נשלפים מהספריות ועוברים דיגיטליזציה אצל גוגל, אשר סרקה עד כה 15 מיליון ספרים.
Now when Google digitizes a book, they put it into a really nice format. Now we've got the data, plus we have metadata. We have information about things like where was it published, who was the author, when was it published. And what we do is go through all of those records and exclude everything that's not the highest quality data. What we're left with is a collection of five million books, 500 billion words, a string of characters a thousand times longer than the human genome -- a text which, when written out, would stretch from here to the Moon and back 10 times over -- a veritable shard of our cultural genome. Of course what we did when faced with such outrageous hyperbole ... (Laughter) was what any self-respecting researchers would have done. We took a page out of XKCD, and we said, "Stand back. We're going to try science."
כאשר בגוגל עושים דיגיטליזציה לספר, הם מעבירים אותו לפורמט באמת יפה. יש לנו נתונים ובנוסף יש לנו נתונים על מאפייני הנתונים. יש לנו מידע על דברים כגון היכן זה פורסם, מי היה המחבר, מתי זה פורסם. ומה שאנו עושים זה לעבור על כל הרשומות האלו ולוותר על כל הנתונים שאינם מהאיכות הכי גבוהה. מה שנשאר זה אוסף של 5 מיליון ספרים, 500 מיליארד מילים, מחרוזת של אותיות הארוכה פי אלף מהחומר התורשתי האנושי -- טקסט שאם ייכתב, יגיע מכאן לירח ובחזרה 10 פעמים ויותר -- זהו פלח משמעותי מהתורשה התרבותית שלנו. ברור שמה שעשינו כאשר נתקלנו בהיפרבולה שערורייתית כזו -- (צחוק) היה מה שכל חוקר המכבד את עצמו היה עושה. לקחנו דף מתוך קטע קומי ברשת, ואמרנו, "תתרחקי מאיתנו. אנו הולכים להיעזר במדע."
(Laughter)
(צחוק)
JM: Now of course, we were thinking, well let's just first put the data out there for people to do science to it. Now we're thinking, what data can we release? Well of course, you want to take the books and release the full text of these five million books. Now Google, and Jon Orwant in particular, told us a little equation that we should learn. So you have five million, that is, five million authors and five million plaintiffs is a massive lawsuit. So, although that would be really, really awesome, again, that's extremely, extremely impractical. (Laughter)
ג'.מ.: טוב, ברור שחשבנו שאולי נחשוף את הנתונים לאנשים כדי שיעשו עליהם מחקרים מדעיים. התחלנו לחשוב איזה נתונים לשחרר. האמת שהיינו רוצים לשחרר את מלוא הטקסט של כל 5 מיליון הספרים. אבל גוגל, ובעיקר ג'ון אורוונט, סיפרו לנו שעלינו ללמוד משוואה אחת. אם יש לכם 5 מיליון, זה אומר 5 מיליון סופרים ו-5 מיליון תביעות משפטיות שזה ממש המון. כך שגם אם זה יהיה ממש, ממש מרשים, שוב, זה מאוד, מאוד לא מעשי. (צחוק)
Now again, we kind of caved in, and we did the very practical approach, which was a bit less awesome. We said, well instead of releasing the full text, we're going to release statistics about the books. So take for instance "A gleam of happiness." It's four words; we call that a four-gram. We're going to tell you how many times a particular four-gram appeared in books in 1801, 1802, 1803, all the way up to 2008. That gives us a time series of how frequently this particular sentence was used over time. We do that for all the words and phrases that appear in those books, and that gives us a big table of two billion lines that tell us about the way culture has been changing.
ואנו שוב ויתרנו, ואימצנו את הגישה המאוד מעשית, שהיתה קצת פחות מרשימה. אמרנו, במקום לשחרר את מלוא הטקסט, נשחרר סטטיסטיקות על הספרים. ניקח לדוגמא "קורטוב של אושר". אלו הן ארבע מילים (באנגלית); נקרא לזה משקל-ארבע. נספר לכם כמה פעמים משקל-ארבע מסויים הופיע בספרים ב-1801, 1802, 1803, עד 2008. זה נותן לנו מרווחי זמן של תדירות השימוש בביטוי מסויים זה לאורך תקופה. אנו עושים זאת לכל המילים והביטויים אשר מופיעים בספרים הללו, וזה נותן לנו טבלה גדולה של שני מיליארד שורות המספרות לנו על הדרך בה תרבות משתנה.
ELA: So those two billion lines, we call them two billion n-grams. What do they tell us? Well the individual n-grams measure cultural trends. Let me give you an example. Let's suppose that I am thriving, then tomorrow I want to tell you about how well I did. And so I might say, "Yesterday, I throve." Alternatively, I could say, "Yesterday, I thrived." Well which one should I use? How to know?
א.ל.א.: שני מיליארד השורות הללו, אנו מכנים אותן שני מיליארד משקלי-n. מה הן מספרות לנו? כל משקל-n לכשעצמו מודד מגמות תרבותיות. אתן לכם דוגמא. נניח שאני מצליח במשהו, לכן מחר ברצוני לספר לכם על ההצלחה שלי. אני עשוי לומר, "אתמול, הצלחתי (I throve)." או לחילופין, אתמול, הצלחתי (I thrived)". במה עליי להשתמש? כיצד יודעים?
As of about six months ago, the state of the art in this field is that you would, for instance, go up to the following psychologist with fabulous hair, and you'd say, "Steve, you're an expert on the irregular verbs. What should I do?" And he'd tell you, "Well most people say thrived, but some people say throve." And you also knew, more or less, that if you were to go back in time 200 years and ask the following statesman with equally fabulous hair, (Laughter) "Tom, what should I say?" He'd say, "Well, in my day, most people throve, but some thrived." So now what I'm just going to show you is raw data. Two rows from this table of two billion entries. What you're seeing is year by year frequency of "thrived" and "throve" over time. Now this is just two out of two billion rows. So the entire data set is a billion times more awesome than this slide.
עד לפני 6 חודשים, המצב העדכני בתחום זה היה שהולכים, לדוגמא, לפסיכולוג כזה עם שיער מדהים, ואומרים, "סטיב, אתה מומחה בפעלים חריגים. מה עליי לעשות?" והוא היה עונה, "רוב האנשים אומרים thrived, אבל כמה אומרים throve" גם אתם יודעים, פחות או יותר, שאם הייתם חוזרים 200 שנה אחורה ושואלים את המדינאי הזה שגם לו יש שיער מדהים, (צחוק) "טום, מה עליי להגיד?" הוא היה עונה, "בזמני, רוב האנשים השתמשו ב-throve, אבל כמה ב-thrived". כעת מה שאראה לכם זה נתונים גולמיים. שתי שורות מטבלה זו של 2 מיליארד שורות. מה שרואים זו התדירות, שנה אחר שנה, של "thrived" מול "throve" לאורך זמן. אלו רק שתי שורות מתוך 2 מיליארד שורות. כך שכל מערך הנתונים מרשים פי מיליארד מאשר שקופית זו.
(Laughter)
(צחוק)
(Applause)
(מחיאות כפיים)
JM: Now there are many other pictures that are worth 500 billion words. For instance, this one. If you just take influenza, you will see peaks at the time where you knew big flu epidemics were killing people around the globe.
ג'.מ: ישנן הרבה תמונות אחרות השוות 500 מיליארד מילים. למשל זו. אם ניקח את שפעת, נראה שיאים בזמנים שאנו יודעים שבהם מגיפות השפעת חיסלו אנשים בכל העולם.
ELA: If you were not yet convinced, sea levels are rising, so is atmospheric CO2 and global temperature.
א.ל.א.: אם עדיין לא השתכנעתם, פני-הים עולים, כך גם דו-תחמוצת הפחמן באויר והטמפרטורה הממוצעת.
JM: You might also want to have a look at this particular n-gram, and that's to tell Nietzsche that God is not dead, although you might agree that he might need a better publicist.
ג'.מ.: אולי גם תרצו לראות את משקל-n המסויים הזה, וזה כדי לספר לניטשה שאלוהים לא מת, אף על-פי שתסכימו אולי שהוא זקוק ליחצ"ן יותר טוב.
(Laughter)
(צחוק)
ELA: You can get at some pretty abstract concepts with this sort of thing. For instance, let me tell you the history of the year 1950. Pretty much for the vast majority of history, no one gave a damn about 1950. In 1700, in 1800, in 1900, no one cared. Through the 30s and 40s, no one cared. Suddenly, in the mid-40s, there started to be a buzz. People realized that 1950 was going to happen, and it could be big. (Laughter) But nothing got people interested in 1950 like the year 1950. (Laughter) People were walking around obsessed. They couldn't stop talking about all the things they did in 1950, all the things they were planning to do in 1950, all the dreams of what they wanted to accomplish in 1950. In fact, 1950 was so fascinating that for years thereafter, people just kept talking about all the amazing things that happened, in '51, '52, '53. Finally in 1954, someone woke up and realized that 1950 had gotten somewhat passé. (Laughter) And just like that, the bubble burst.
א.ל.א.: ניתן להגיע לכמה תפיסות מופשטות מדבר כזה. לדוגמא, אספר לכם על ההיסטוריה של שנת 1950. לאורך רוב ההיסטוריה בקירוב, אף אחד לא שם על שנת 1950. ב-1700, ב-1800, ב-1900, לאף אחד לא היה אכפת. לאורך שנות ה-30 וה-40, לאף אחד לא היה אכפת. פתאום, באמצע שנות ה-40, התחיל הבאז. אנשים גילו ש-1950 עומדת להגיע, והיא יכולה להיות דבר גדול. (צחוק) אבל שום דבר לא גרם להם להתעניין ב-1950 כמו השנה 1950 עצמה. (צחוק) אנשים התהלכו עם אובססיה בתוכם. הם לא יכלו להפסיק לדבר על כל הדברים שהם עשו ב-1950, כל הדברים שהם תיכננו לעשות ב-1950, כל החלומות שהם רצו להגשים ב-1950. למעשה, 1950 היתה כה מרתקת שבשנים שלאחריה, אנשים פשוט המשיכו לדבר על כל הדברים המדהימים שקרו, ב-51, 52, 53. לבסוף ב-1954, מישהו התעורר ושם לב ש-1950 איכשהו עבר זמנה. (צחוק) וככה סתם, הבלון התפוצץ.
(Laughter)
(צחוק)
And the story of 1950 is the story of every year that we have on record, with a little twist, because now we've got these nice charts. And because we have these nice charts, we can measure things. We can say, "Well how fast does the bubble burst?" And it turns out that we can measure that very precisely. Equations were derived, graphs were produced, and the net result is that we find that the bubble bursts faster and faster with each passing year. We are losing interest in the past more rapidly.
וסיפורה של 1950 הוא הסיפור של כל שנה שיש עליה רשומות, עם שינוי קטן, כי כעת יש לנו את התרשימים היפים האלה. ומאחר ויש לנו אותם, אנו יכולים למדוד דברים שונים. אנו יכולים לשאול, "כמה מהר הבלון מתפוצץ?" מתברר שניתן למדוד זאת בדיוק מאוד גבוה. מזה נוצרו משוואות, נוצרו גרפים, והתוצאה הסופית היא שמצאנו שהבלון מתפוצץ יותר ויותר מהר עם כל שנה שעוברת. אנו מאבדים עניין בעבר בקצב הולך וגובר.
JM: Now a little piece of career advice. So for those of you who seek to be famous, we can learn from the 25 most famous political figures, authors, actors and so on. So if you want to become famous early on, you should be an actor, because then fame starts rising by the end of your 20s -- you're still young, it's really great. Now if you can wait a little bit, you should be an author, because then you rise to very great heights, like Mark Twain, for instance: extremely famous. But if you want to reach the very top, you should delay gratification and, of course, become a politician. So here you will become famous by the end of your 50s, and become very, very famous afterward. So scientists also tend to get famous when they're much older. Like for instance, biologists and physics tend to be almost as famous as actors. One mistake you should not do is become a mathematician. (Laughter) If you do that, you might think, "Oh great. I'm going to do my best work when I'm in my 20s." But guess what, nobody will really care.
ג'.מ.: ועכשיו עצה קטנה בנושא קריירה. עבור אלה מכם ששואפים להתפרסם, ניתן ללמוד מ-25 הפוליטיקאים המובילים, הסופרים, השחקנים ועוד. אם ברצונכם להתפרסם מוקדם, עליכם להיות שחקנים, מכיוון שהפירסום מתחיל לטפס בסוף שנות ה-20 שלכם -- אתם עדיין צעירים וזה נהדר. אם אתם יכולים להמתין מעט, עליכם להיות סופרים, מאחר ואז אתם מטפסים לגבהים גדולים, כמו מרק טוויין: מאוד מפורסם. אבל אם ברצונכם להגיע ממש לפיסגה, עליכם לדחות סיפוקים וכמובן, להיות פוליטיקאי. כאן תהיו מפורסמים בסוף שנות ה-50 שלכם, ותהיו מאוד, מאוד מפורסמים אחר-כך. גם המדענים נוטים להתפרסם כאשר הם מבוגרים בהרבה. כמו לדוגמא, ביולוגים ופיזיקאים שמקבלים פירסום כמו שחקנים. שגיאה אחת שעליכם להימנע ממנה זה להיות מתמטיקאי. (צחוק) אם תעשו זאת, אולי תחשבו, "נהדר, אגיע לשיאי בשנות ה-20 שלי." אבל אתם יודעים מה? לאף אחד זה לא יהיה אכפת.
(Laughter)
(צחוק)
ELA: There are more sobering notes among the n-grams. For instance, here's the trajectory of Marc Chagall, an artist born in 1887. And this looks like the normal trajectory of a famous person. He gets more and more and more famous, except if you look in German. If you look in German, you see something completely bizarre, something you pretty much never see, which is he becomes extremely famous and then all of a sudden plummets, going through a nadir between 1933 and 1945, before rebounding afterward. And of course, what we're seeing is the fact Marc Chagall was a Jewish artist in Nazi Germany.
א.ל.א.: ישנן תובנות נוספות מאירות-עיניים בתוך המשקלי-n. לדוגמא, הנה המסלול של מרק שאגל, אמן יליד 1887. וזה נראה כמסלול רגיל של אדם שהתפרסם. הוא נהיה יותר ויותר מפורסם, אלא אם בודקים בשפה הגרמנית. אם בודקים בגרמנית, רואים משהו לגמרי מוזר, משהו שכמעט ולא רואים, שזה שהוא נהיה מאוד מפורסם ואז פתאום צולל לתחתית, עובר שפל בין 1933 ו-1945, לפני עלייתו מחדש. ובעצם, מה שרואים זו העובדה שמרק שאגאל היה אמן יהודי בגרמניה הנאצית.
Now these signals are actually so strong that we don't need to know that someone was censored. We can actually figure it out using really basic signal processing. Here's a simple way to do it. Well, a reasonable expectation is that somebody's fame in a given period of time should be roughly the average of their fame before and their fame after. So that's sort of what we expect. And we compare that to the fame that we observe. And we just divide one by the other to produce something we call a suppression index. If the suppression index is very, very, very small, then you very well might be being suppressed. If it's very large, maybe you're benefiting from propaganda.
הסימנים האלה הם כה חזקים שאין צורך לדעת שמישהו צונזר. ניתן פשוט להסיק זאת בעזרת עיבוד נתונים בסיסי. הנה דרך פשוטה לעשות את זה. סביר לצפות שמידת הפירסום של פלוני בזמן נתון תהיה בקירוב הממוצע של פירסומו לפני אותו זמן ופירסומו אחריו. זה בערך מה שאנו מצפים ומשווים את התוצאה למידת הפירסום בפועל. מחלקים את האחד בשני כדי לקבל מה שנקרא מדד דיכוי. אם מדד הדיכוי מאוד, מאוד קטן, זה אומר שמישהו כנראה סובל מדיכוי. אם הוא מאוד גדול, אולי מישהו נהנה מתעמולה.
JM: Now you can actually look at the distribution of suppression indexes over whole populations. So for instance, here -- this suppression index is for 5,000 people picked in English books where there's no known suppression -- it would be like this, basically tightly centered on one. What you expect is basically what you observe. This is distribution as seen in Germany -- very different, it's shifted to the left. People talked about it twice less as it should have been. But much more importantly, the distribution is much wider. There are many people who end up on the far left on this distribution who are talked about 10 times fewer than they should have been. But then also many people on the far right who seem to benefit from propaganda. This picture is the hallmark of censorship in the book record.
ג'.מ.: ניתן בעצם להסתכל על פילוג מדדי הדיכוי על-פני האוכלוסייה כולה. לדוגמא, מדד דיכוי זה הוא של 5,000 אנשים הלקוח מספרים באנגליה שלא אמור להיות שם דיכוי -- הוא ייראה כך, בגדול מרוכז סביב 1. מה שמצפים לו זה בערך מה שרואים כאן. זה הפילוג שמתקבל בגרמניה -- מאוד שונה, הוא מוסט שמאלה. אנשים שם דיברו כפליים פחות ממה שהיה ניתן לצפות. אבל יותר חשוב, הפילוג הרבה יותר רחב. יש הרבה אנשים הנמצאים בקצה השמאלי של פילוג זה אשר דיברו פי-10 פחות ממה שהיו "צריכים". אבל יש גם הרבה אנשים בקצה הימני שנראה שהם מרויחים מתעמולה. תמונה זו היא המאפיין המזהה, במסד נתוני הספרים, לצנזורה.
ELA: So culturomics is what we call this method. It's kind of like genomics. Except genomics is a lens on biology through the window of the sequence of bases in the human genome. Culturomics is similar. It's the application of massive-scale data collection analysis to the study of human culture. Here, instead of through the lens of a genome, through the lens of digitized pieces of the historical record. The great thing about culturomics is that everyone can do it. Why can everyone do it? Everyone can do it because three guys, Jon Orwant, Matt Gray and Will Brockman over at Google, saw the prototype of the Ngram Viewer, and they said, "This is so fun. We have to make this available for people." So in two weeks flat -- the two weeks before our paper came out -- they coded up a version of the Ngram Viewer for the general public. And so you too can type in any word or phrase that you're interested in and see its n-gram immediately -- also browse examples of all the various books in which your n-gram appears.
א.ל.א.: אנו מכנים שיטה זו culturomics (חקר תורשה תרבותית). זה דומה לחקר התורשה בביולוגיה. חקר התורשה שם עדשה על ביולוגיה דרך החלון של סדרות של רצפי בסיס בחומר התורשתי האנושי. חקר תורשה תרבותית זה משהו דומה. זה שימוש באנליזה של איסוף נתונים בקנה-מידה ענקי לחקר של תרבות אנושית. כאן, במקום להביט דרך עדשת החומר התורשתי, מביטים דרך עדשה של פיסות של רשומות היסטוריות שעברו דיגיטליזציה. הדבר הגדול בחקר תורשה תרבותית הוא שכל אחד יכול לעשות זאת. מדוע כל אחד יכול לעשות זאת? זה מכיוון ששלושה אנשים, ג'ון אורוונט, מאט גריי וויל ברוקמן מגוגל, ראו את אב-הטיפוס של מצגת המשקל-n, ואמרו, "זה כזה כיף. עלינו להפכה לזמינה לציבור." תוך שבועיים -- שבועיים לפני שהמאמר שלנו התפרסם -- הם כתבו תוכנית לגירסת מצגת משקל-n בשביל כלל הציבור. ניתן להקליד כל מילה או ביטוי שחפצים בהם ולראות את משקל ה-n שלהם מייד -- וגם להציג דוגמאות של כל הספרים המגוונים שבהם מופיע המשקל-n שבחרת.
JM: Now this was used over a million times on the first day, and this is really the best of all the queries. So people want to be their best, put their best foot forward. But it turns out in the 18th century, people didn't really care about that at all. They didn't want to be their best, they wanted to be their beft. So what happened is, of course, this is just a mistake. It's not that strove for mediocrity, it's just that the S used to be written differently, kind of like an F. Now of course, Google didn't pick this up at the time, so we reported this in the science article that we wrote. But it turns out this is just a reminder that, although this is a lot of fun, when you interpret these graphs, you have to be very careful, and you have to adopt the base standards in the sciences.
ג'.מ.: נעשה בזה שימוש יותר ממיליון פעם ביום הראשון, וזו באמת השאילתא הטובה ביותר מכולן. אנשים רוצים את הטוב ביותר, להניח את הרגל היותר טובה מלפנים. אבל מתברר שבמאה ה-18, לאנשים לא היה ממש אכפת מכל זה. הם לא רצו את הטוב ביותר (best), אלא את הטוב ביותר (beft). לכן מה שקרה הוא, טוב, ברור שזו טעות. זה לא שהם שאפו לבינוניות, אלא שהיו נוהגים לכתוב S בצורה שונה, בערך כמו F. גוגל לא תפסו זאת בזמנו, לכן דיווחנו על כך במאמר המדעי שכתבנו. אבל מתברר שזה רק מזכיר לנו שלמרות שכל זה כיף גדול, כאשר מפרשים את הגרפים הללו, צריך מאוד להיזהר, ושעלינו לאמץ סטנדרטים בסיסיים של מדע.
ELA: People have been using this for all kinds of fun purposes. (Laughter) Actually, we're not going to have to talk, we're just going to show you all the slides and remain silent. This person was interested in the history of frustration. There's various types of frustration. If you stub your toe, that's a one A "argh." If the planet Earth is annihilated by the Vogons to make room for an interstellar bypass, that's an eight A "aaaaaaaargh." This person studies all the "arghs," from one through eight A's. And it turns out that the less-frequent "arghs" are, of course, the ones that correspond to things that are more frustrating -- except, oddly, in the early 80s. We think that might have something to do with Reagan.
א.ל.א: אנשים נוהגים להשתמש בזה לכל מיני מטרות. (צחוק) בעצם, אין לנו יותר צורך לדבר, אנו רק נראה לכם את כל השקופיות ונישאר דוממים. אדם זה התעניין בהיסטוריית התיסכול. ישנם סוגי תיסכול שונים. אם נפגעים בבוהן, יש אחד "ארג". אם כדור-הארץ מושמד על-ידי הווגונים כדי לפנות דרך למעבר בין-כוכבי, זה שמונה א "אאאאאאאארג". אדם זה חוקר את כל ה"ארגים", מאחד עד שמונה א-ים. מתברר שה"ארגים" הפחות נפוצים הם אלה אשר קשורים בדברים היותר מתסכלים -- מלבד, באופן משונה, בשנות ה-80 המוקדמות. אנו סבורים שזה עשוי להיות קשור איכשהו ברייגן.
(Laughter)
(צחוק)
JM: There are many usages of this data, but the bottom line is that the historical record is being digitized. Google has started to digitize 15 million books. That's 12 percent of all the books that have ever been published. It's a sizable chunk of human culture. There's much more in culture: there's manuscripts, there newspapers, there's things that are not text, like art and paintings. These all happen to be on our computers, on computers across the world. And when that happens, that will transform the way we have to understand our past, our present and human culture.
ג'.מ.: ישנם הרבה שימושים לנתונים אלה, אבל השורה התחתונה היא שרשומות היסטוריות עוברות דיגיטליזציה. גוגל החלה בדיגיטליזציה של 15 מיליון ספרים. זה 12 אחוז מכל הספרים שיצאו אי-פעם לאור. זוהי פיסה גדולה למדיי של התרבות האנושית. יש בנוסף עוד הרבה בתרבות: ישנם כתבי-יד, ישנם עיתונים, ישנם דברים שאינם טקסטים, כמו אמנות וציורים. כל זה אמור להיות במחשבים שלנו, במחשבים בכל העולם. וכאשר זה יקרה, יחול שינוי באופן בו אנו מבינים את עברנו, את ההווה שלנו ואת התרבות האנושית.
Thank you very much.
תודה רבה לכם.
(Applause)
(מחיאות כפיים)