Erez Lieberman Aiden: Everyone knows that a picture is worth a thousand words. But we at Harvard were wondering if this was really true. (Laughter) So we assembled a team of experts, spanning Harvard, MIT, The American Heritage Dictionary, The Encyclopedia Britannica and even our proud sponsors, the Google. And we cogitated about this for about four years. And we came to a startling conclusion. Ladies and gentlemen, a picture is not worth a thousand words. In fact, we found some pictures that are worth 500 billion words.
Erez Lieberman Aiden: Todo el mundo sabe que una imagen vale más que mil palabras. Pero en Harvard nos preguntábamos si realmente es verdad. (Risas) Así que reunimos a un equipo de expertos de Harvard, del MIT de "The American Heritage Dictionary", de la Enciclopedia Británica e incluso de nuestros patrocinadores: Google. Y meditamos sobre esto durante unos 4 años hasta llegar a una conclusión sorprendente. Damas y caballeros: una imagen no vale más que mil palabras. De hecho, hallamos que algunas imágenes valen 500.000 millones de palabras.
Jean-Baptiste Michel: So how did we get to this conclusion? So Erez and I were thinking about ways to get a big picture of human culture and human history: change over time. So many books actually have been written over the years. So we were thinking, well the best way to learn from them is to read all of these millions of books. Now of course, if there's a scale for how awesome that is, that has to rank extremely, extremely high. Now the problem is there's an X-axis for that, which is the practical axis. This is very, very low.
Jean-Baptiste Michel: ¿Cómo llegamos a esta conclusión? Erez y yo estábamos pensando formas de ver el panorama general de la cultura humana y de la historia humana: su cambio en el tiempo. Se han escrito muchos libros en los últimos años. Así que estábamos pensando que la mejor forma de aprender de ellos es leyendo estos millones de libros. Por supuesto, si existe una escala de lo impresionante, ese tiene que estar posicionado muy, muy arriba. Pero el problema es que hay un eje X que es el eje de lo práctico. Este está muy, muy abajo.
(Applause)
(Aplausos)
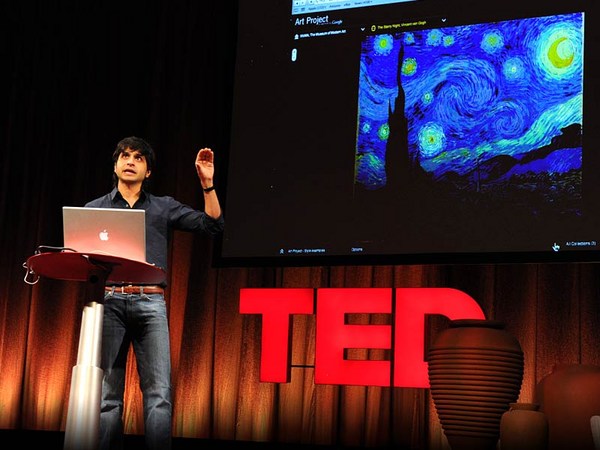
Now people tend to use an alternative approach, which is to take a few sources and read them very carefully. This is extremely practical, but not so awesome. What you really want to do is to get to the awesome yet practical part of this space. So it turns out there was a company across the river called Google who had started a digitization project a few years back that might just enable this approach. They have digitized millions of books. So what that means is, one could use computational methods to read all of the books in a click of a button. That's very practical and extremely awesome.
Ahora bien, la gente suele usar un enfoque alternativo: tener pocas fuentes y leerlas con mucho cuidado. Esto es muy práctico pero no tan impresionante. Lo que realmente queremos es llegar a lo impresionante y práctico. Y resulta que había una empresa del otro lado del río llamada Google que hace unos años había comenzado un proyecto de digitalización que podría permitir este enfoque. Ellos han digitalizado millones de libros. Eso significa que uno podría usar métodos computacionales para leer todos los libros con el clic de un botón. Eso es muy práctico y sumamente impresionante.
ELA: Let me tell you a little bit about where books come from. Since time immemorial, there have been authors. These authors have been striving to write books. And this became considerably easier with the development of the printing press some centuries ago. Since then, the authors have won on 129 million distinct occasions, publishing books. Now if those books are not lost to history, then they are somewhere in a library, and many of those books have been getting retrieved from the libraries and digitized by Google, which has scanned 15 million books to date.
ELA: Ahora les voy a contar un poco de dónde vienen los libros. Desde la noche de los tiempos existen autores. Estos autores se han esforzado por escribir libros. Y eso se volvió considerablemente más fácil con el desarrollo de la imprenta hace algunos siglos. Desde entonces, los autores han tenido 129 millones de ocasiones para publicar libros. Y si esos libros no se perdieron en la historia entonces están en alguna biblioteca y muchos de esos libros han sido recuperados de las bibliotecas y digitalizados por Google que ha escaneado 15 millones de libros hasta la fecha.
Now when Google digitizes a book, they put it into a really nice format. Now we've got the data, plus we have metadata. We have information about things like where was it published, who was the author, when was it published. And what we do is go through all of those records and exclude everything that's not the highest quality data. What we're left with is a collection of five million books, 500 billion words, a string of characters a thousand times longer than the human genome -- a text which, when written out, would stretch from here to the Moon and back 10 times over -- a veritable shard of our cultural genome. Of course what we did when faced with such outrageous hyperbole ... (Laughter) was what any self-respecting researchers would have done. We took a page out of XKCD, and we said, "Stand back. We're going to try science."
Pero cuando Google digitaliza un libro lo pone en un formato muy bueno. Ahora tenemos los datos y tenemos metadatos. Tenemos información sobre cosas como el lugar de publicación el autor, fecha de publicación. Y recorremos todos esos registros, excluyendo todo lo que no tenga la más alta calidad. Lo que nos queda es una colección de 5 millones de libros 500.000 millones de palabras, una cadena de caracteres mil veces más larga que el genoma humano; un texto que, de escribirlo, se extendería desde aquí hasta la luna ida y vuelta 10 veces más... un verdadero fragmento de nuestro genoma cultural. Por supuesto lo que hicimos frente a tal extravagante hipérbole... (Risas) fue hacer lo que cualquier investigador que se respete habría hecho. Tomamos una página de XKDC, y dijimos: "Háganse a un lado. Vamos a intentar con la ciencia".
(Laughter)
(Risas)
JM: Now of course, we were thinking, well let's just first put the data out there for people to do science to it. Now we're thinking, what data can we release? Well of course, you want to take the books and release the full text of these five million books. Now Google, and Jon Orwant in particular, told us a little equation that we should learn. So you have five million, that is, five million authors and five million plaintiffs is a massive lawsuit. So, although that would be really, really awesome, again, that's extremely, extremely impractical. (Laughter)
JM: Ahora, por supuesto, estábamos pensando: primero pongamos los datos allí para que la gente haga ciencia con eso. Ahora estamos pensando: ¿qué datos podemos liberar? Por supuesto, uno quiere tomar los libros y liberar el texto completo de estos 5 millones de libros. Pero Google, y Jon Orwant en particular, nos explicaron una pequeña ecuación: 5 millones de autores y 5 millones de demandantes, genera demandas masivas. Por eso aunque sea muy, muy impresionante de nuevo, es completamente impráctico. (Risas)
Now again, we kind of caved in, and we did the very practical approach, which was a bit less awesome. We said, well instead of releasing the full text, we're going to release statistics about the books. So take for instance "A gleam of happiness." It's four words; we call that a four-gram. We're going to tell you how many times a particular four-gram appeared in books in 1801, 1802, 1803, all the way up to 2008. That gives us a time series of how frequently this particular sentence was used over time. We do that for all the words and phrases that appear in those books, and that gives us a big table of two billion lines that tell us about the way culture has been changing.
Pero, de nuevo, cedimos y adoptamos un enfoque muy práctico, un poco menos impresionante. Dijimos: bueno, en vez de liberar todo el texto vamos a liberar estadísticas sobre los libros. Tomemos, por ejemplo, "un destello de felicidad". Tiene 4 palabras; lo denominamos cuatro-grama. Les vamos a contar cuántas veces aparece un cuatro-grama particular en libros en 1801, 1802, 1803, en cada año hasta 2008. Eso nos da series temporales de la frecuencia con que esta oración particular se usó en el tiempo. Hacemos eso para todas las palabras y frases que aparecen en esos libros y eso nos da una gran tabla de 2.000 millones de líneas que nos cuentan formas en las que fue cambiando la cultura.
ELA: So those two billion lines, we call them two billion n-grams. What do they tell us? Well the individual n-grams measure cultural trends. Let me give you an example. Let's suppose that I am thriving, then tomorrow I want to tell you about how well I did. And so I might say, "Yesterday, I throve." Alternatively, I could say, "Yesterday, I thrived." Well which one should I use? How to know?
ELA: Esos dos millones de líneas se denominan 2 millones de n-gramas. ¿Qué nos dicen? Los n-gramas individuales miden las tendencias culturales. Les daré un ejemplo. Supongamos que soy muy próspero y mañana quiero contarles lo bien que me fue. Podría decir: "Ayer prosperé". En inglés, prosperé ¿es 'throve' o 'thrived'? ¿Cuál debería usar? ¿Cómo saberlo?
As of about six months ago, the state of the art in this field is that you would, for instance, go up to the following psychologist with fabulous hair, and you'd say, "Steve, you're an expert on the irregular verbs. What should I do?" And he'd tell you, "Well most people say thrived, but some people say throve." And you also knew, more or less, that if you were to go back in time 200 years and ask the following statesman with equally fabulous hair, (Laughter) "Tom, what should I say?" He'd say, "Well, in my day, most people throve, but some thrived." So now what I'm just going to show you is raw data. Two rows from this table of two billion entries. What you're seeing is year by year frequency of "thrived" and "throve" over time. Now this is just two out of two billion rows. So the entire data set is a billion times more awesome than this slide.
Desde hace unos 6 meses la vanguardia en este campo dice que, por ejemplo, uno tiene que ir a ese psicólogo de pelo fabuloso y decirle: "Steve, eres experto en verbos irregulares. ¿Qué debería hacer?" Y él dirá: "Bueno la mayoría de la gente dice 'thrive' pero alguna gente dice 'throve'". Y también sabían, más o menos, que si retrocedieran en el tiempo 200 años y le preguntaran a este estadista de pelo fabuloso, (Risas) "Tom, ¿cómo debería decir?" Diría: "Bueno, en mis tiempos era 'throve' pero había 'thrived'". Por eso ahora voy a mostrar los datos en crudo. Dos filas de esta tabla de 2.000 millones de entradas. Lo que están viendo es la frecuencia año por año de 'thrived' y 'throve' en el tiempo. Estas son sólo 2 de 2.000 millones de filas. Así que el set de datos entero es mil millones de veces más impresionante que esta diapositiva.
(Laughter)
(Risas)
(Applause)
(Aplausos)
JM: Now there are many other pictures that are worth 500 billion words. For instance, this one. If you just take influenza, you will see peaks at the time where you knew big flu epidemics were killing people around the globe.
JM: Ahora bien, hay muchas otras imágenes que valen 500.000 millones de palabras. Por ejemplo, ésta. Si uno toma el caso de la gripe, verá picos en el tiempo en el que se sabía de la muerte por grandes epidemias de gripe en todo el mundo.
ELA: If you were not yet convinced, sea levels are rising, so is atmospheric CO2 and global temperature.
ELA: Si todavía no están convencidos, los niveles del mar están subiendo, y también el CO2 en la atmósfera y la temperatura del planeta.
JM: You might also want to have a look at this particular n-gram, and that's to tell Nietzsche that God is not dead, although you might agree that he might need a better publicist.
JM: Puede ser que también deseen echar un vistazo a estos n-gramas, para decirle a Nietzsche que Dios no está muerto, aunque, estamos de acuerdo, necesitaría un mejor publicista.
(Laughter)
(Risas)
ELA: You can get at some pretty abstract concepts with this sort of thing. For instance, let me tell you the history of the year 1950. Pretty much for the vast majority of history, no one gave a damn about 1950. In 1700, in 1800, in 1900, no one cared. Through the 30s and 40s, no one cared. Suddenly, in the mid-40s, there started to be a buzz. People realized that 1950 was going to happen, and it could be big. (Laughter) But nothing got people interested in 1950 like the year 1950. (Laughter) People were walking around obsessed. They couldn't stop talking about all the things they did in 1950, all the things they were planning to do in 1950, all the dreams of what they wanted to accomplish in 1950. In fact, 1950 was so fascinating that for years thereafter, people just kept talking about all the amazing things that happened, in '51, '52, '53. Finally in 1954, someone woke up and realized that 1950 had gotten somewhat passé. (Laughter) And just like that, the bubble burst.
ELA: Con este tipo de cosas se puede llegar a conceptos bastante abstractos. Por ejemplo, tenemos la historia del año 1950. En general para la gran mayoría de la historia a nadie le importa un comino 1950. En 1700, en 1800, en 1900, a nadie le importa. Entre los años 30 y 40 a nadie le importa. De repente, a mediados de los 40, empezó a desatarse un rumor. La gente se dio cuenta que venía 1950 y quizá era algo genial. (Risas) Pero nada cautivó el interés de la gente en 1950 tanto como el año 1950. (Risas) La gente iba por ahí obsesionada. No podía parar de pensar en todo lo que hicieron en 1950 todas las cosas que planeaban hacer en 1950 todos los sueños que querían cumplir en 1950. De hecho, 1950 fue tan fascinante que en los años sucesivos la gente siguió hablando de las cosas sorprendentes que sucedieron en el 51, 52, 53. Finalmente, en 1954, alguien despertó y se dio cuenta que 1950 ya estaba un poco pasado de moda. (Risas) Y, así porque sí, estalló la burbuja.
(Laughter)
(Risas)
And the story of 1950 is the story of every year that we have on record, with a little twist, because now we've got these nice charts. And because we have these nice charts, we can measure things. We can say, "Well how fast does the bubble burst?" And it turns out that we can measure that very precisely. Equations were derived, graphs were produced, and the net result is that we find that the bubble bursts faster and faster with each passing year. We are losing interest in the past more rapidly.
Y la historia de 1950 es la historia de cada año que tenemos registrado con un pequeño giro, porque ahora contamos con estos lindos gráficos. Y, porque los tenemos, podemos medir cosas. Podemos decir: "Bueno, ¿a qué velocidad estalla la burbuja?" Y resulta que podemos medir con mucha precisión. Se derivaron ecuaciones, se hicieron gráficos, y el resultado neto es que hallamos que la burbuja estalla cada vez más rápidamente con cada año que pasa. Estamos perdiendo interés por el pasado más rápidamente.
JM: Now a little piece of career advice. So for those of you who seek to be famous, we can learn from the 25 most famous political figures, authors, actors and so on. So if you want to become famous early on, you should be an actor, because then fame starts rising by the end of your 20s -- you're still young, it's really great. Now if you can wait a little bit, you should be an author, because then you rise to very great heights, like Mark Twain, for instance: extremely famous. But if you want to reach the very top, you should delay gratification and, of course, become a politician. So here you will become famous by the end of your 50s, and become very, very famous afterward. So scientists also tend to get famous when they're much older. Like for instance, biologists and physics tend to be almost as famous as actors. One mistake you should not do is become a mathematician. (Laughter) If you do that, you might think, "Oh great. I'm going to do my best work when I'm in my 20s." But guess what, nobody will really care.
JM: Ahora un pequeño consejo de carrera. Para los que buscan ser famosos podemos aprender de los 25 personajes políticos más famosos: autores, actores, etc. Si quieren llegar a ser famosos desde temprano, deberían ser actores porque empiezan a tener fama al final de los ventipico... todavía son jóvenes, es genial. Ahora, si pueden esperar un poquito, deberían ser autores porque entonces alcanzarían grandes alturas como Mark Twain, por ejemplo, que es sumamente famoso. Pero si quieren llegar realmente a la cima deberían demorar la gratificación y, claro, ser políticos. En este caso se harán famosos al final de los 50 y tantos y se volverán muy, muy famosos en lo sucesivo. Los científicos suelen hacerse famosos cuando son mucho mayores. Por ejemplo, los biólogos y los físicos suelen ser casi tan famosos como los actores. Un error que no deben cometer es ser matemáticos. (Risas) Si lo hacen podrían pensar: "Oh, genial. Voy a hacer mi mejor trabajo a los ventipico". Pero adivinen qué; a nadie le importará.
(Laughter)
(Risas)
ELA: There are more sobering notes among the n-grams. For instance, here's the trajectory of Marc Chagall, an artist born in 1887. And this looks like the normal trajectory of a famous person. He gets more and more and more famous, except if you look in German. If you look in German, you see something completely bizarre, something you pretty much never see, which is he becomes extremely famous and then all of a sudden plummets, going through a nadir between 1933 and 1945, before rebounding afterward. And of course, what we're seeing is the fact Marc Chagall was a Jewish artist in Nazi Germany.
ELA: Hay notas más preocupantes entre los n-gramas. Por ejemplo, esta es la trayectoria de Marc Chagall, un artista nacido en 1887. Parece la trayectoria normal de un famoso. Se hace cada vez más y más famoso salvo que miremos en alemán. Si miramos en alemán vamos a notar algo muy extraño, algo casi nunca visto y es que se vuelve sumamente famoso y de repente se desploma cayendo al punto más bajo entre 1933 y 1945, y después se recupera. Por supuesto, lo que vemos es que, de hecho, Marc Chagall era un artista judío en la Alemania nazi.
Now these signals are actually so strong that we don't need to know that someone was censored. We can actually figure it out using really basic signal processing. Here's a simple way to do it. Well, a reasonable expectation is that somebody's fame in a given period of time should be roughly the average of their fame before and their fame after. So that's sort of what we expect. And we compare that to the fame that we observe. And we just divide one by the other to produce something we call a suppression index. If the suppression index is very, very, very small, then you very well might be being suppressed. If it's very large, maybe you're benefiting from propaganda.
Estas señales son tan fuertes, en realidad, que no hace falta saber que alguien fue censurado. Podemos averiguarlo mediante procesamiento básico de señales. Esta es una manera simple de hacerlo. Una expectativa razonable es que la fama de alguien en un período dado de tiempo debería ser aproximadamente el promedio de su fama antes y su fama después de eso. Es más o menos lo que esperamos. Comparamos eso con la fama que observamos y dividimos una por otra para producir algo que llamamos «índice de represión». Si el índice de represión es muy, muy, muy pequeño podrían estar reprimiéndote. Si es muy grande, quizá uno se está beneficiando de la propaganda.
JM: Now you can actually look at the distribution of suppression indexes over whole populations. So for instance, here -- this suppression index is for 5,000 people picked in English books where there's no known suppression -- it would be like this, basically tightly centered on one. What you expect is basically what you observe. This is distribution as seen in Germany -- very different, it's shifted to the left. People talked about it twice less as it should have been. But much more importantly, the distribution is much wider. There are many people who end up on the far left on this distribution who are talked about 10 times fewer than they should have been. But then also many people on the far right who seem to benefit from propaganda. This picture is the hallmark of censorship in the book record.
JM: Ahora bien, podemos mirar la distribución de los índices de represión en poblaciones enteras. Así, por ejemplo, aquí... este índice de represión es para 5.000 personas calculado sobre libros de inglés, donde no hay represión conocida, sería algo así, bastante centrado en el uno. Lo que uno espera es básicamente lo que observa. Esta es la distribución como se ve en Alemania... muy diferente, está desplazada a la izquierda. Se habla de la gente 2 veces menos de lo que se debería. Pero aún más importante, la distribución es mucho más amplia. Hay muchas personas que terminan en el extremo izquierdo de esta distribución; gente de la que se habla unas 10 veces menos de lo que se debería. Pero también mucha gente en el extremo derecho que parece beneficiarse de la propaganda. Esta imagen muestra el sello de la censura en el libro registrado.
ELA: So culturomics is what we call this method. It's kind of like genomics. Except genomics is a lens on biology through the window of the sequence of bases in the human genome. Culturomics is similar. It's the application of massive-scale data collection analysis to the study of human culture. Here, instead of through the lens of a genome, through the lens of digitized pieces of the historical record. The great thing about culturomics is that everyone can do it. Why can everyone do it? Everyone can do it because three guys, Jon Orwant, Matt Gray and Will Brockman over at Google, saw the prototype of the Ngram Viewer, and they said, "This is so fun. We have to make this available for people." So in two weeks flat -- the two weeks before our paper came out -- they coded up a version of the Ngram Viewer for the general public. And so you too can type in any word or phrase that you're interested in and see its n-gram immediately -- also browse examples of all the various books in which your n-gram appears.
ELA: «Culturomía», así denominamos al método. Es una especie de genómica, salvo que la genómica hace foco en la biología mediante la ventana de la secuencia de bases del genoma humano. La «culturomía» es similar. Es la aplicación del análisis de grandes volúmenes de datos al estudio de la cultura humana. Aquí, en vez de mirar bajo la lente del genoma, lo hacemos mediante la digitalización de registros históricos. Lo genial de la «culturomía» es que todos podemos practicarla. ¿Por qué podemos todos? Todo el mundo puede hacerlo porque tres muchachos Jon Orwant, Matt Gray y Will Brockman en Google, vieron el prototipo del visor de n-gramas y dijeron: "Es algo muy divertido. Tenemos que dejarlo disponible para la gente". Así que en dos semanas -dos semanas antes de que salga nuestro artículo- programaron una versión del visor de n-gramas para el público en general. De ese modo, Uds también pueden escribir la palabra o frase que les interese y ver su n-grama de inmediato; también explorar ejemplos de los distintos libros en los que aparece el n-grama.
JM: Now this was used over a million times on the first day, and this is really the best of all the queries. So people want to be their best, put their best foot forward. But it turns out in the 18th century, people didn't really care about that at all. They didn't want to be their best, they wanted to be their beft. So what happened is, of course, this is just a mistake. It's not that strove for mediocrity, it's just that the S used to be written differently, kind of like an F. Now of course, Google didn't pick this up at the time, so we reported this in the science article that we wrote. But it turns out this is just a reminder that, although this is a lot of fun, when you interpret these graphs, you have to be very careful, and you have to adopt the base standards in the sciences.
JM: El primer día lo usaron más de un millón de veces y esta es realmente la mejor de todas las consultas. La gente quiere dar lo mejor de sí, en inglés se dice 'best'. Pero resulta que en el siglo XVIII esto no importaba para nada. En inglés, no decían "dar lo mejor de sí" usando 'best' sino 'beft'. Por supuesto, se debe a un error. No es que se esforzaran en ser mediocres, sino que la S se solía escribir como una F. Pero claro, Google no advirtió esto en ese momento por eso lo informamos en el artículo científico que escribimos. Pero resulta que esto nos recuerda que, aunque es muy divertido, al interpretar estos gráficos hay que tener mucho cuidado y adoptar las normas básicas de la ciencia.
ELA: People have been using this for all kinds of fun purposes. (Laughter) Actually, we're not going to have to talk, we're just going to show you all the slides and remain silent. This person was interested in the history of frustration. There's various types of frustration. If you stub your toe, that's a one A "argh." If the planet Earth is annihilated by the Vogons to make room for an interstellar bypass, that's an eight A "aaaaaaaargh." This person studies all the "arghs," from one through eight A's. And it turns out that the less-frequent "arghs" are, of course, the ones that correspond to things that are more frustrating -- except, oddly, in the early 80s. We think that might have something to do with Reagan.
ELA: La gente ha estado usando esto para todo tipo de cosas. (Risas) En realidad no vamos a hablar sino a mostrarles diapositivas y quedarnos en silencio. Esta persona estaba interesada en la historia de la frustración. Hay varios tipos de frustración. Si nos damos con el pie en algo, es con 1A: "Ay". Si la Tierra es aniquilada por la Vogons para hacer espacio para una autopista interestelar eso es con 8A: "Aaaaaaaay". Esta persona estudia todos los "Ay" que tienen de 1 a 8 aes. Y resulta que los "ay" menos frecuentes son, por supuesto, los correspondientes a las cosas más frustrantes salvo, curiosamente, en los años 80. Pensamos que podría tener algo que ver con Reagan.
(Laughter)
(Risas)
JM: There are many usages of this data, but the bottom line is that the historical record is being digitized. Google has started to digitize 15 million books. That's 12 percent of all the books that have ever been published. It's a sizable chunk of human culture. There's much more in culture: there's manuscripts, there newspapers, there's things that are not text, like art and paintings. These all happen to be on our computers, on computers across the world. And when that happens, that will transform the way we have to understand our past, our present and human culture.
JM: Hay muchos usos para estos datos pero la conclusión es que el registro histórico se está digitalizando. Google ha empezado a digitalizar 15 millones de libros. Eso representa el 12% de todos los libros publicados en la historia. Es un fragmento considerable de la cultura humana. La cultura tiene más cosas: hay manuscritos, hay periódicos, hay cosas que no tienen texto, como el arte y las pinturas. Todo está en nuestras computadoras, en las computadores del mundo. Y cuando eso suceda va a transformar nuestra manera de entender nuestro pasado, nuestro presente y la cultura humana.
Thank you very much.
Muchas gracias.
(Applause)
(Aplausos)