We are here today because [the] United Nations have defined goals for the progress of countries. They're called Millennium Development Goals. And the reason I really like these goals is that there are eight of them. And by specifying eight different goals, the United Nations has said that there are so many things needed to change in a country in order to get the good life for people. Look here -- you have to end poverty, education, gender, child and maternal health, control infections, protect the environment and get the good global links between nations in every aspect from aid to trade.
Estamos aqui, hoje, porque a ONU definiu objectivos para o desenvolvimento dos países. São chamados de Objetivos de Desenvolvimento do Milénio. E a razão por que eu gosto bastante destes objectivos é porque são oito. E ao especificarem oito objectivos diferentes, as Nações Unidas dizem que estas são as coisas que é necessário mudar num país para obter uma vida boa para a população. Reparem aqui, temos de acabar com a pobreza, educação, igualdade para ambos os sexos, saúde materna e infantil controlar infecções, proteger o meio ambiente e construir boas ligações entre as nações em todos os aspectos desde a ajuda até ao comércio.
There's a second reason I like these development goals, and that is because each and every one is measured. Take child mortality; the aim here is to reduce child mortality by two-thirds, from 1990 to 2015. That's a four percent reduction per year -- and this, with measuring. That's what makes the difference between political talking like this and really going for the important thing, a better life for people. And what I'm so happy about with this is that we have already documented that there are many countries in Asia, in the Middle East, in Latin America and East Europe that [are] reducing with this rate. And even mighty Brazil is going down with five percent per year, and Turkey with seven percent per year. So there's good news. But then I hear people saying, "There is no progress in Africa. And there's not even statistics on Africa to know what is happening." I'll prove them wrong on both points.
Há uma segunda razão por que eu gosto destes objectivos de desenvolvimento, e ela é porque cada um deles pode ser medido. Por exemplo, a mortalidade infantil. O objectivo aqui é reduzir a mortalidade infantil em dois terços, de 1990 a 2015. É uma redução de 4% ao ano. E isto, com medições. Isso é que faz a diferença entre a conversa política assim e realmente tentar alcançar o importante, uma vida melhor para as pessoas. E o que me deixa tão contente com isto é que já está documentado que há muitos países na Ásia, no Médio Oriente, na América Latina e Europa de Leste a reduzir a este ritmo. E mais, o poderoso Brasil está a reduzir a 5% por ano, e a Turquia a 7% por ano. Portanto, temos boas notícias. Mas depois ouço pessoas dizerem: "Não há progresso em África. "E nem sequer há estatísticas sobre África "para sabermos o que está a acontecer". Vou provar que estão errados em ambos os pontos.
Come with me to the wonderful world of statistics. I bring you to the webpage, ChildMortality.org, where you can take deaths in children below five years of age for all countries -- it's done by U.N. specialists. And I will take Kenya as an example. Here you see the data. Don't panic -- don't panic now, I'll help you through this. It looks nasty, like in college when you didn't like statistics. But first thing, when you see dots like this, you have to ask yourself: from where do the data come? What is the origin of the data? Is it so that in Kenya, there are doctors and other specialists who write the death certificate at the death of the child and it's sent to the statistical office? No -- low-income countries like Kenya still don't have that level of organization. It exists, but it's not complete because so many deaths occur in the home with the family, and it's not registered. What we rely on is not an incomplete system. We have interviews, we have surveys. And this is highly professional female interviewers who sit down for one hour with a woman and ask her about [her] birth history. How many children did you have? Are they alive? If they died, at what age and what year? And then this is done in a representative sample of thousands of women in the country and put together in what used to be called a demographic health survey report. But these surveys are costly, so they can only be done [in] three- to five-year intervals. But they have good quality. So this is a limitation. And all these colored lines here are results; each color is one survey. But that's too complicated for today, so I'll simplify it for you, and I give you one average point for each survey.
Venham comigo para o mundo maravilhoso da estatística. Conduzo-vos para a página da "web", ChildMortality.org, onde podem encontrar o número de mortes em crianças abaixo dos cinco anos de idade para todos os países. É feito por especialistas da ONU. E vou usar o Quénia como exemplo. Aqui podem ver os dados. Não entrem em pânico agora. Eu ajudo-vos com isto. Parece horrível, como na universidade, quando não gostavam de estatística. Mas a primeira coisa, quando vêem pontos como estes, que têm de perguntar a vocês mesmos, é: "De onde é que vem a informação? "Qual é a origem dos dados? "Será o caso de que, no Quénia, "há médicos e outros especialistas "que escrevem a certidão de óbito quando a criança morre, "e depois a enviam para o gabinete de estatística?" Não, os países de baixos rendimentos como o Quénia ainda não têm esse nível de organização. Existe, mas não está completo, porque tantas mortes ocorrem em casa com a família, e não são registadas. Nós não nos baseamos num sistema incompleto. Temos entrevistas, temos questionários. E são feitos por entrevistadoras altamente profissionais, que se sentam com uma mulher, por uma hora, e lhe fazem perguntas acerca da sua história reprodutiva. Quantas crianças teve? Estão todas vivas? Se morreram, que idade tinham e em que ano aconteceu? E depois, isto é feito numa amostra representativa de milhares de mulheres no país e resumido no que costumava ser chamado Relatório dos Estudos de Saúde Demográfica. Mas estes estudos são caros, por isso só podem ser feitos em intervalos de três a cinco anos. Mas são de boa qualidade. Mas essa é a limitação. E todas estas linhas coloridas aqui são os resultados; cada cor é um estudo. Mas isto é demasiado complicado, por isso, vou simplificar para vocês, e dou-vos um ponto médio por cada estudo.
This was 1977, 1988, 1992, '97 and 2002. And when the experts in the U.N. have got these surveys in place in their database, then they use advanced mathematical formulas to produce a trend line, and the trend line looks like this. See here -- it's the best fit they can get of this point. But watch out -- they continue the line beyond the last point out into nothing. And they estimated that in 2008, Kenya had per child mortality of 128. And I was sad, because we could see this reversal in Kenya with an increased child mortality in the 90s. It was so tragic. But in June, I got a mail in my inbox from Demographic Health Surveys, and it showed good news from Kenya. I was so happy. This was the estimate of the new survey. Then it just took another three months for [the] U.N. to get it into their server, and on Friday we got the new trend line -- it was down here. Isn't it nice -- isn't it nice, yeah? I was actually, on Friday, sitting in front of my computer, and I saw the death rate fall from 128 to 84 just that morning. So we celebrated.
Este foi em 1977, 1988, 1992, 1997 e 2002. E quando os especialistas na ONU colocam todos estes estudos na sua base de dados, eles usam fórmulas matemáticas avançadas para produzirem uma linha de regressão, que é esta. Vejam aqui. É a melhor aproximação que conseguem. Mas reparem: Eles continuam a linha para lá do último ponto para o vazio. E estimaram que em 2008 o Quénia teria uma mortalidade infantil de 128. E eu fiquei triste, porque podíamos ver esta inversão no Quénia com um aumento da mortalidade infantil nos anos 90. Era tão trágico. Mas em Junho, recebi um "email" dos Estudos de Saúde Demográfica que mostrava boas notícias do Quénia. Fiquei tão contente. Esta era a estimativa do último estudo. Depois, só demorou outros três meses para a ONU colocar tudo no seu servidor e na sexta-feira, recebemos a nova linha de regressão. Estava aqui em baixo. Tão agradável, não é? Eu estava, na sexta-feira, sentado em frente ao meu computador, e vi a taxa de mortalidade cair de 128 para 84 naquela manhã. E então festejámos.
But now, when you have this trend line, how do we measure progress? I'm going into some details here, because [the] U.N. do it like this. They start [in] 1990 -- they measure to 2009. They say, "0.9 percent, no progress." That's unfair. As a professor, I think I have the right to propose something differently. I would say, at least do this -- 10 years is enough to follow the trend. It's two surveys, and you can see what's happening now. They have 2.4 percent. Had I been in the Ministry of Health in Kenya, I may have joined these two points. So what I'm telling you is that we know the child mortality. We have a decent trend. It's coming into some tricky things then when we are measuring MDGs. And the reason here for Africa is especially important, because '90s was a bad decade, not only in Kenya, but across Africa. The HIV epidemic peaked. There was resistance for the old malaria drugs, until we got the new drugs. We got, later, the mosquito netting. And there was socio-economic problems, which are now being solved at a much better scale. So look at the average here -- this is the average for all of sub-Saharan Africa. And [the] U.N. says it's a reduction with 1.8 percent.
Mas agora, quando temos esta linha de regressão, como é que medimos o progresso? Vou entrar em alguns detalhes aqui, porque a ONU faz isto desta forma. Eles começam em 1990, e medem até 2009. Eles dizem "0,9%, não há progresso." É injusto. Como professor, acho que tenho o direito de propor algo diferente. Eu diria, ao menos façam isto. Dez anos é suficiente para seguir a tendência. São dois estudos, e podem ver o que está a acontecer agora. Eles estão a 2,4%. Se eu estivesse no Ministério da Saúde no Quénia, provavelmente usava estes dois pontos. Portanto, o que estou a dizer-vos é que sabemos qual é a taxa de mortalidade. Temos uma boa estimativa. Estamos a encontrar algumas dificuldades quando medimos os ODM. E a razão, para África, é especialmente importante, porque os anos 90 foram uma má década, não só no Quénia, mas por toda a África. A epidemia do VIH atingiu o seu ponto máximo. Havia resistência aos antigos medicamentos contra a malária, até surgirem os novos. Recebemos, depois, as redes contra os mosquitos. E houve problemas socioeconómicos, que estão agora a ser resolvidos a uma escala muito melhor. Portanto, olhem para a média aqui. Esta é a média para toda a África Subsariana. E a ONU diz que é uma redução de 1,8%.
Now this sounds a little theoretical, but it's not so theoretical. You know, these economists, they love money, they want more and more of it, they want it to grow. So they calculate the percent annual growth rate of [the] economy. We in public health, we hate child death, so we want less and less and less of child deaths. So we calculate the percent reduction per year, but it's sort of the same percentage. If your economy grows with four percent, you ought to reduce child mortality four percent; if it's used well and people are really involved and can get the use of the resources in the way they want it. So is this fair now to measure this over 19 years? An economist would never do that. I have just divided it into two periods. In the 90s, only 1.2 percent, only 1.2 percent. Whereas now, second gear -- it's like Africa had first gear, now they go into second gear. But even this is not a fair representation of Africa, because it's an average, it's an average speed of reduction in Africa.
Agora, isto parece um pouco teórico, mas não é assim tão teórico. Sabem, estes economistas adoram dinheiro, e eles querem mais, querem que o dinheiro cresça. Por isso, calculam a taxa percentual de crescimento anual da economia. Nós, em saúde pública, detestamos morte infantil, por isso, queremos cada vez menos mortes infantis. Por isso, calculamos a redução percentual por ano. Mas é mais ou menos o mesmo tipo de percentagem. Se a vossa economia crescer a 4%, deveriam reduzir a mortalidade infantil em 4%, se o crescimento for bem utilizado e as pessoas se envolverem realmente e puderem utilizar os recursos da forma que quiserem. Então, será justo medir isto num período de 19 anos? Um economista nunca faria isso. Simplesmente, dividi-o em dois períodos. Nos anos 90, apenas 1,2%. apenas 1,2%. Enquanto que agora, em segunda, é como se a África tivesse estado em primeira, e agora engataram a segunda. Mas mesmo isto, não é uma representação justa de África, porque é uma média, é a velocidade média de redução em África.
And look here when I take you into my bubble graphs. Still here, child death per 1,000 on that axis. Here we have [the] year. And I'm now giving you a wider picture than the MDG. I start 50 years ago when Africa celebrated independence in most countries. I give you Congo, which was high, Ghana -- lower. And Kenya -- even lower. And what has happened over the years since then? Here we go. You can see, with independence, literacy improved and vaccinations started, smallpox was eradicated, hygiene was improved, and things got better. But then, in the '80s, watch out here. Congo got into civil war, and they leveled off here. Ghana got very ahead, fast. This was the backlash in Kenya, and Ghana bypassed, but then Kenya and Ghana go down together -- still a standstill in Congo. That's where we are today. You can see it doesn't make sense to make an average of this zero improvement and this very fast improvement. Time has come to stop thinking about sub-Saharan Africa as one place. Their countries are so different, and they merit to be recognized in the same way, as we don't talk about Europe as one place. I can tell you that the economy in Greece and Sweden are very different -- everyone knows that. And they are judged, each country, on how they are doing.
E vejam aqui quando eu vos levo para os meus gráficos de bolas. Aqui ainda temos a mortalidade infantil por cada 1000, neste eixo. Aqui temos o ano. E agora estou a mostrar-vos uma imagem mais abrangente do que os ODM. Começo há 50 anos, quando África celebrou a independência da maioria dos países. Aqui mostro o Congo, que estava lá em cima, o Gana mais abaixo e o Quénia, ainda mais abaixo. E o que aconteceu nestes anos? Aqui vamos nós. Podem ver, com a independência, a alfabetização melhorou e as vacinações começaram, a varíola foi erradicada, a higiene melhorou e a situação, em geral, também. Mas depois, nos anos 80, reparem aqui. O Congo entrou em guerra civil, e estabilizaram ali. O Gana melhorou muito rápido. Aqui foi o recuo no Quénia e o Gana ultrapassou, mas depois o Quénia e o Gana descem juntos, o Congo ainda paralisado. E aqui estamos hoje. Podem ver, não faz sentido fazer uma média desta melhoria zero e desta melhoria muito rápida. Chegou o tempo de parar de pensar na África Subsariana com um único lugar. Os países são tão diferentes e merecem ser reconhecidos dessa forma, tal como nós não falamos da Europa como um só lugar. Posso dizer-vos que a economia na Grécia e na Suécia é muito diferente. Toda a gente sabe isso. E eles são avaliados, cada país, com base no seu desempenho.
So let me show the wider picture. My country, Sweden: 1800, we were up there. What a strange personality disorder we must have, counting the children so meticulously in spite of a high child death rate. It's very strange. It's sort of embarrassing. But we had that habit in Sweden, you know, that we counted all the child deaths, even if we didn't do anything about it. And then, you see, these were famine years. These were bad years, and people got fed up with Sweden. My ancestors moved to the United States. And eventually, soon they started to get better and better here. And here we got better education, and we got health service, and child mortality came down. We never had a war; Sweden was in peace all this time. But look, the rate of lowering in Sweden was not fast. Sweden achieved a low child mortality because we started early. We had primary school actually started in 1842. And then you get that wonderful effect when we got female literacy one generation later. You have to realize that the investments we do in progress are long-term investments. It's not about just five years -- it's long-term investments. And Sweden never reached [the] Millennium Development Goal rate, 3.1 percent when I calculated. So we are off track -- that's what Sweden is. But you don't talk about it so much. We want others to be better than we were, and indeed, others have been better.
Então deixem-me dar-vos uma visão mais ampla. O meu país, a Suécia: Em 1800 estávamos lá em cima. Que estranho distúrbio de personalidade nós devemos ter, contar as crianças de forma tão meticulosa, apesar da alta taxa de mortalidade infantil. É muito estranho. É meio embaraçoso. Mas tínhamos esse hábito na Suécia, sabem, de contar todas as mortes infantis mesmo que não fizéssemos nada para resolver o problema. E depois, vejam, estes foram anos de fome. Estes foram anos maus, e as pessoas fartaram-se da Suécia. Os meus antepassados mudaram-se para os EUA. E eventualmente, começaram a melhorar aqui. E aqui começámos a ter melhor educação, e começámos a ter serviço de saúde, e a mortalidade infantil desceu. Nunca tivemos uma guerra; a Suécia esteve em paz todo este tempo. Mas reparem, a taxa de diminuição na Suécia não foi rápida. A Suécia alcançou uma taxa de mortalidade infantil baixa porque começámos cedo. Na verdade, o ensino primário começou em 1842. E depois, temos aquele efeito maravilhoso de quando tivemos a alfabetização das mulheres, uma geração depois. Têm que compreender que os investimentos que fazemos em progresso são investimentos a longo prazo. Não é apenas a cinco anos. São investimentos a longo prazo. E a Suécia nunca alcançou a taxa dos ODM 3,1%, segundo os meus cálculos. Então estamos fora dos carris. É como a Suécia está. Mas não se fala muito sobre isso. Queremos que os outros sejam melhores do que nós.
Let me show you Thailand, see what a success story, Thailand from the 1960s -- how they went down here and reached almost the same child mortality levels as Sweden. And I'll give you another story -- Egypt, the most hidden, glorious success in public health. Egypt was up here in 1960, higher than Congo. The Nile Delta was a misery for children with diarrheal disease and malaria and a lot of problems. And then they got the Aswan Dam. They got electricity in their homes, they increased education and they got primary health care. And down they went, you know. And they got safer water, they eradicated malaria. And isn't it a success story. Millennium Development Goal rates for child mortality is fully possible. And the good thing is that Ghana today is going with the same rate as Egypt did at its fastest. Kenya is now speeding up. Here we have a problem. We have a severe problem in countries which are at a standstill.
E, de facto, os outros têm sido melhores. Deixem-me que vos mostre a Tailândia, vejam que história de sucesso, a Tailândia desde os anos 60, como eles desceram aqui e alcançaram quase o mesmo nível de mortalidade infantil que na Suécia. E dou-vos outra história, a do Egipto, o mais bem escondido e glorioso sucesso em saúde pública. O Egipto estava aqui em cima em 1960, mais alto do que o Congo. O delta do Nilo era uma miséria para as crianças, com doenças diarreicas e malária e muitos problemas. E depois eles construíram a barragem de Assuão. Começaram a ter electricidade nas suas casas. Aumentaram a educação. E começaram a ter cuidados de saúde primários. E vieram por aí abaixo, vêem? E obtiveram água mais saudável, erradicaram a malária. E vejam que história de sucesso. As taxas para a mortalidade infantil dos ODM são inteiramente possíveis. E a boa notícia é que o Gana hoje está com a mesma taxa que o Egipto apresentou na sua fase mais rápida. O Quénia está a acelerar. Aqui temos um problema. Temos um problema grave em países que estão estagnados.
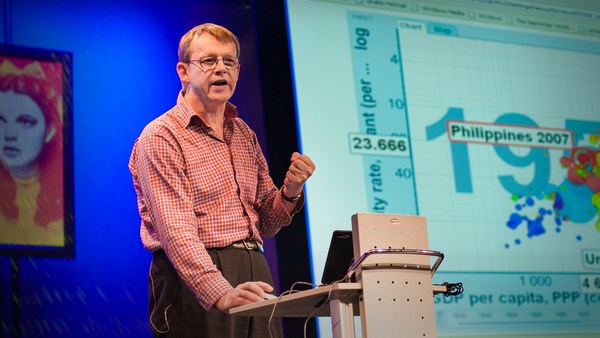
Now, let me now bring you to a wider picture, a wider picture of child mortality. I'm going to show you the relationship between child mortality on this axis here -- this axis here is child mortality -- and here I have the family size. The relationship between child mortality and family size. One, two, three, four children per woman: six, seven, eight children per woman. This is, once again, 1960 -- 50 years ago. Each bubble is a country -- the color, you can see, a continent. The dark blue here is sub-Saharan Africa. And the size of the bubble is the population. And these are the so-called "developing" countries. They had high, or very high, child mortality and family size, six to eight. And the ones over there, they were so-called Western countries. They had low child mortality and small families. What has happened? What I want you [to do] now is to see with your own eyes the relation between fall in child mortality and decrease in family size. I just want not to have any room for doubt -- you have to see that for yourself. This is what happened. Now I start the world. Here we come down with the eradication of smallpox, better education, health service. It got down there -- China comes into the Western box here. And here Brazil is in the Western Box. India is approaching. The first African countries coming into the Western box, and we get a lot a new neighbors. Welcome to a decent life. Come on. We want everyone down there. This is the vision we have, isn't it. And look now, the first African countries here are coming in. There we are today.
Agora, deixem-me mostrar-vos uma visão mais ampla, uma visão mais ampla da mortalidade infantil. Vou mostrar-vos a relação entre a mortalidade infantil aqui, neste eixo, -- este eixo aqui é a mortalidade infantil -- e aqui temos o tamanho da família. A relação entre a mortalidade infantil e o tamanho das famílias. Uma, duas, três, quatro crianças por mulher. Seis, sete, oito crianças por mulher. Isto é, mais uma vez, 1960, há 50 anos. Cada bola é um país. As cores, podem ver, são os continentes O azul escuro aqui é a África Subsariana. E o tamanho das bolas é a população. E estes são os chamados países "em desenvolvimento". Eles tinham mortalidades infantis altas ou muito altas e famílias de seis a oito membros. E aqueles daquele lado, estes eram os chamados países ocidentais. Tinham baixa mortalidade infantil e famílias pequenas. O que é que aconteceu? O que eu quero é que vejam com os vossos próprios olhos a relação entre a queda da mortalidade infantil e a diminuição do tamanho das famílias. Peço-vos que vejam, para que não haja dúvidas. Têm de ver com os vossos próprios olhos. Isto é o que aconteceu. Agora começo com o mundo. Aqui descemos com erradicação da varíola, melhor educação, serviços de saúde. Chegaram ali abaixo. A China entra na caixa dos países ocidentais aqui. E aqui o Brasil está na caixa ocidental. A Índia aproxima-se. Os primeiros países africanos entram na caixa ocidental. E ganhamos muitos vizinhos. Bem-vindos a uma vida decente. Venham daí. Queremos toda a gente aqui em baixo. Esta é a nossa ambição, não é? E vejam agora, os primeiros países africanos estão a entrar. Aqui estamos hoje.
There is no such thing as a "Western world" and "developing world." This is the report from [the] U.N., which came out on Friday. It's very good -- "Levels and Trends in Child Mortality" -- except this page. This page is very bad; it's a categorization of countries. It labels "developing countries," -- I can read from the list here -- developing countries: Republic of Korea -- South Korea. Huh? They get Samsung, how can they be [a] developing country? They have here Singapore. They have the lowest child mortality in the world, Singapore. They bypassed Sweden five years ago, and they are labeled a developing country. They have here Qatar. It's the richest country in the world with Al Jazeera. How the heck could they be [a] developing country? This is crap. (Applause) The rest here is good -- the rest is good.
Não existe essa coisa de um "mundo ocidental" e um "mundo em desenvolvimento". Este é o relatório da ONU que saiu na sexta-feira. É muito bom -- "Níveis e Tendências em Mortalidade Infantil" -- excepto esta página. Esta página é muito má. É uma categorização de países. Classifica de "países em desenvolvimento" -- posso ler da lista aqui -- países em desenvolvimento: Coreia do Sul. Hã? Eles têm a Samsung, como podem ser um país em desenvolvimento? Têm aqui Singapura. Singapura tem a mortalidade infantil mais baixa do mundo. Ultrapassaram a Suécia há cinco anos, e são classificados como um país em desenvolvimento. Têm aqui o Qatar. É dos países com a Al Jazeera, o mais rico. Como é que podem ser um país em desenvolvimento? Isto é uma porcaria. (Aplausos) O resto que aqui está é bom. O resto é bom.
We have to have a modern concept, which fits to the data. And we have to realize that we are all going to into this, down to here. What is the importance now with the relations here. Look -- even if we look in Africa -- these are the African countries. You can clearly see the relation with falling child mortality and decreasing family size, even within Africa. It's very clear that this is what happens. And a very important piece of research came out on Friday from the Institute of Health Metrics and Evaluation in Seattle showing that almost 50 percent of the fall in child mortality can be attributed to female education. That is, when we get girls in school, we'll get an impact 15 to 20 years later, which is a secular trend which is very strong. That's why we must have that long-term perspective, but we must measure the impact over 10-year periods. It's fully possible to get child mortality down in all of these countries and to get them down in the corner where we all would like to live together.
Temos de ter um conceito moderno, que se encaixe nos dados. E temos de perceber que vamos todos para aqui para baixo. Qual é a importância destas relações aqui. Vejam. Mesmo se olharmos para África. Estes são os países africanos. Podem ver claramente a relação entre a queda da mortalidade infantil e a diminuição do tamanho das famílias mesmo em África. É muito claro que é isto que acontece. E um resultado muito importante saiu na sexta-feira do Instituto de Avaliação e Métricas de Saúde, em Seattle, que mostra que quase 50% da redução da mortalidade infantil pode ser atribuída à educação das mulheres. Ou seja, quando pomos raparigas na escola, temos um impacto 15 a 20 anos mais tarde, uma tendência secular que é muito forte. É por isso que temos de ter essa perspectiva a longo prazo, mas temos de medir o impacto de um período de 10 anos. É inteiramente possível diminuir a mortalidade infantil em todos estes países e levá-los para o canto ali em baixo onde todos gostaríamos de viver juntos.
And of course, lowering child mortality is a matter of utmost importance from humanitarian aspects. It's a decent life for children, we are talking about. But it is also a strategic investment in the future of all mankind, because it's about the environment. We will not be able to manage the environment and avoid the terrible climate crisis if we don't stabilize the world population. Let's be clear about that. And the way to do that, that is to get child mortality down, get access to family planning and behind that drive female education. And that is fully possible. Let's do it.
E, claro, diminuir a mortalidade infantil é um assunto da maior importância da perspectiva humanitária. É de uma vida decente para as crianças que estamos a falar. Mas também é um investimento estratégico no futuro de toda a humanidade, porque é acerca do ambiente. Nós não seremos capazes de tratar do ambiente e evitar a terrível crise climática se não estabilizarmos a população mundial. Sejamos claros acerca disso. E a forma de o fazer é reduzir a mortalidade infantil, ter acesso ao planeamento familiar e por trás disso, incentivar a educação das mulheres. E isso é inteiramente possível. Vamos a isso.
Thank you very much.
Muito obrigado.
(Applause)
(Aplausos)