Technology can change our understanding of nature.
我們對自然的認識 隨著科技而改變
Take for example the case of lions. For centuries, it's been said that female lions do all of the hunting out in the open savanna, and male lions do nothing until it's time for dinner. You've heard this too, I can tell. Well recently, I led an airborne mapping campaign in the Kruger National Park in South Africa. Our colleagues put GPS tracking collars on male and female lions, and we mapped their hunting behavior from the air. The lower left shows a lion sizing up a herd of impala for a kill, and the right shows what I call the lion viewshed. That's how far the lion can see in all directions until his or her view is obstructed by vegetation. And what we found is that male lions are not the lazy hunters we thought them to be. They just use a different strategy. Whereas the female lions hunt out in the open savanna over long distances, usually during the day, male lions use an ambush strategy in dense vegetation, and often at night. This video shows the actual hunting viewsheds of male lions on the left and females on the right. Red and darker colors show more dense vegetation, and the white are wide open spaces. And this is the viewshed right literally at the eye level of hunting male and female lions. All of a sudden, you get a very clear understanding of the very spooky conditions under which male lions do their hunting.
拿獅子來說 好幾世紀以來 我們都認為 只有母獅會在大草原上會狩獵 公獅總是坐享其成 就以這一對而言 這是正確的 我最近主持的空拍地形描繪計畫 位於南非的克魯格國家公園 我們在公獅跟母獅的 頸子上配戴GPS追蹤頸環 然後我們從空中追蹤 觀察牠們的狩獵習性 左下方的圖 可以看出一隻獅子準備獵食 要把羚羊群聚一起 準備狩獵 右圖就是我說的 獅子的視域 這是獅子在各方向視野所及的範圍 直到視野被植被遮擋 我們發現 公獅並不是我們想像中 好吃懶做的傢伙 牠們只是用了不同的策略 相較於喜愛在大草原 進行長距離狩獵的母獅 通常是日間狩獵 公獅更喜歡在夜間埋伏 在茂密的植被區域 這段影片說明 母獅跟公獅狩獵視域的差異性 左邊是公獅的視域 右邊的是母獅 紅色深色區塊 表示茂密的植被 白色區塊代表開放場域 這個視域高度 就是公獅跟母獅眼睛看到的高度 你會突然瞭解 公獅狩獵時的 詭譎氣氛
I bring up this example to begin, because it emphasizes how little we know about nature. There's been a huge amount of work done so far to try to slow down our losses of tropical forests, and we are losing our forests at a rapid rate, as shown in red on the slide. I find it ironic that we're doing so much, yet these areas are fairly unknown to science. So how can we save what we don't understand?
我以這個例子開場白 因為它能強調 我們對大自然的了解這麼淺 時至今日 已有大量計畫投入 試圖減緩熱帶森林消失 儘管它消失的速度迅速 可以從投影片上的紅色看出來 諷刺的是 我們做得這麼多 對科學而言 這些卻是陌生的區域 究竟如何保護我們不了解的雨林呢
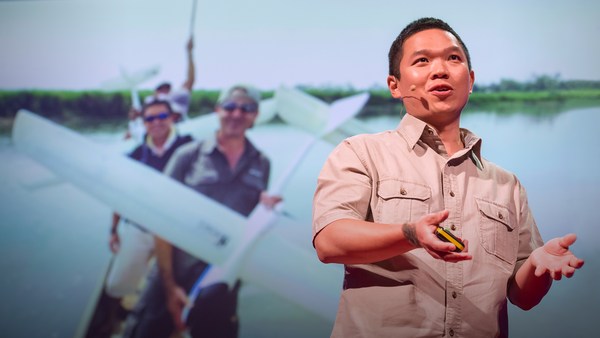
Now I'm a global ecologist and an Earth explorer with a background in physics and chemistry and biology and a lot of other boring subjects, but above all, I'm obsessed with what we don't know about our planet. So I created this, the Carnegie Airborne Observatory, or CAO. It may look like a plane with a fancy paint job, but I packed it with over 1,000 kilos of high-tech sensors, computers, and a very motivated staff of Earth scientists and pilots. Two of our instruments are very unique: one is called an imaging spectrometer that can actually measure the chemical composition of plants as we fly over them. Another one is a set of lasers, very high-powered lasers, that fire out of the bottom of the plane, sweeping across the ecosystem and measuring it at nearly 500,000 times per second in high-resolution 3D. Here's an image of the Golden Gate Bridge in San Francisco, not far from where I live. Although we flew straight over this bridge, we imaged it in 3D, captured its color in just a few seconds. But the real power of the CAO is its ability to capture the actual building blocks of ecosystems. This is a small town in the Amazon, imaged with the CAO. We can slice through our data and see, for example, the 3D structure of the vegetation and the buildings, or we can use the chemical information to actually figure out how fast the plants are growing as we fly over them. The hottest pinks are the fastest-growing plants. And we can see biodiversity in ways that you never could have imagined. This is what a rainforest might look like as you fly over it in a hot air balloon. This is how we see a rainforest, in kaleidoscopic color that tells us that there are many species living with one another. But you have to remember that these trees are literally bigger than whales, and what that means is that they're impossible to understand just by walking on the ground below them. So our imagery is 3D, it's chemical, it's biological, and this tells us not only the species that are living in the canopy, but it tells us a lot of information about the rest of the species that occupy the rainforest.
我是全球生態學家跟地球探險家 我有物理跟化學的背景 還有生物以及一堆無聊科目的知識 但更重要的是 我對於未知的地球的狂熱 所以我創立了 卡內基空中天文台號 簡稱CAO 它看起來像一架花俏的飛機 但是當我把它裝滿 超過1000公斤的高科技感應器、電腦 還有一群積極主動的組員 地球科學家跟飛行員 我們有兩台非常特別的儀器 一個是成像光譜儀 它能即時測量 飛行路線經過的 植物的化學成分 另一台是一組雷射 非常高功率的雷射 能從飛機底部射出 掃過整個生態統 同時以幾乎每秒50萬的速度 掃瞄出3D高解析圖 這是舊金山的金門大橋 距離我家不太遠 儘管我們飛過了這座橋 我們以3D描繪 記錄色彩 僅僅花了幾秒鐘 但是CAO真正的強項 是它能記錄生態系裡的 組成元件 這是亞馬遜的一個小鎮 以CAO描繪的 我們能從資料中取樣分析 例如植被的3D結構 還有建築 或是我們可以應用化學資料 來調查植物的生長速度 在我們飛越它們的當下 深粉紅色的是生長最迅速的植物 我們觀察到的生物多樣性 也是從所未見的 如果你從熱氣球往下看 雨林可能會長這樣 但這是我們看到的雨林 跟萬花筒一樣的繽紛色彩 告訴我們有很多生物同時存在 你別忘了 這些樹有的比鯨魚還要大 也就是說 如果僅僅在地面上走過 你是絕對無法了解它們的 所以我們的影像是3D的 是化學的 是生物的 它說明的 不只是在樹冠層的生物 還有很多的資訊 關於雨林中的其他物種
Now I created the CAO in order to answer questions that have proven extremely challenging to answer from any other vantage point, such as from the ground, or from satellite sensors. I want to share three of those questions with you today. The first questions is, how do we manage our carbon reserves in tropical forests? Tropical forests contain a huge amount of carbon in the trees, and we need to keep that carbon in those forests if we're going to avoid any further global warming. Unfortunately, global carbon emissions from deforestation now equals the global transportation sector. That's all ships, airplanes, trains and automobiles combined. So it's understandable that policy negotiators have been working hard to reduce deforestation, but they're doing it on landscapes that are hardly known to science. If you don't know where the carbon is exactly, in detail, how can you know what you're losing? Basically, we need a high-tech accounting system. With our system, we're able to see the carbon stocks of tropical forests in utter detail. The red shows, obviously, closed-canopy tropical forest, and then you see the cookie cutting, or the cutting of the forest in yellows and greens. It's like cutting a cake except this cake is about whale deep. And yet, we can zoom in and see the forest and the trees at the same time. And what's amazing is, even though we flew very high above this forest, later on in analysis, we can go in and actually experience the treetrops, leaf by leaf, branch by branch, just as the other species that live in this forest experience it along with the trees themselves.
我創立CAO的目的 是為了解開不論從任何制高點 都具有相當挑戰性的問題 不論是從地面或是衛星感測器 今天我要跟你分享其中三個問題 第一個問題 我們該如何管理 熱帶森林的碳儲量? 熱帶森林的樹木含有大量的二氧化碳 我們必須把二氧化碳保留在森林裡 如果要避免地球暖化持續惡化 遺憾的是全球森林砍伐 所釋出的碳排放量 已經等於全球交通釋出的碳排放量 這包含所有的船隻、飛機、火車、汽車總和 所以政策談判者當然會 持續努力減低森林砍伐 但是這些地區 在科學領域中 都是相對陌生的區域 如果不確實知道二氧化碳在哪裡 又該如何知道會失去什麼呢? 其實我們需要一個高科技的會計系統 在我們的系統裡 你可以仔細看見 熱帶雨林的碳儲量 紅色區塊是熱帶森林的茂密樹冠層 然後像是蛋糕被切開 黃色跟綠色區塊是被開發的地帶 就像切蛋糕一樣 只是這塊蛋糕大概有一隻鯨魚這麼深 我們能同時放大 看看森林還有樹木 驚人的是 儘管我們從高空飛過 分析之後 我們能進入 並且體驗樹冠層的 每一片葉 每一個樹枝 如同森林裡的其他生物一樣 親身體驗這些樹木
We've been using the technology to explore and to actually put out the first carbon geographies in high resolution in faraway places like the Amazon Basin and not-so-faraway places like the United States and Central America. What I'm going to do is I'm going to take you on a high-resolution, first-time tour of the carbon landscapes of Peru and then Panama. The colors are going to be going from red to blue. Red is extremely high carbon stocks, your largest cathedral forests you can imagine, and blue are very low carbon stocks. And let me tell you, Peru alone is an amazing place, totally unknown in terms of its carbon geography until today. We can fly to this area in northern Peru and see super high carbon stocks in red, and the Amazon River and floodplain cutting right through it. We can go to an area of utter devastation caused by deforestation in blue, and the virus of deforestation spreading out in orange. We can also fly to the southern Andes to see the tree line and see exactly how the carbon geography ends as we go up into the mountain system. And we can go to the biggest swamp in the western Amazon. It's a watery dreamworld akin to Jim Cameron's "Avatar." We can go to one of the smallest tropical countries, Panama, and see also a huge range of carbon variation, from high in red to low in blue. Unfortunately, most of the carbon is lost in the lowlands, but what you see that's left, in terms of high carbon stocks in greens and reds, is the stuff that's up in the mountains. One interesting exception to this is right in the middle of your screen. You're seeing the buffer zone around the Panama Canal. That's in the reds and yellows. The canal authorities are using force to protect their watershed and global commerce. This kind of carbon mapping has transformed conservation and resource policy development. It's really advancing our ability to save forests and to curb climate change.
我們應用這種科技探索 並整合出第一份 高解析度的碳地圖 包含遙遠的亞馬遜河流域 還有鄰近的 美國跟中美洲 現在我要帶你體驗 首度的高解析碳地理圖 探索祕魯跟巴拿馬 顏色會由紅色到藍色 紅色是極高碳含量 這裡有你能想像到最壯觀的森林 藍色代表很低的碳含量 單單是祕魯 就是一個不可思議的地方 她的碳地圖 從未被探討過 我們先飛到祕魯北部 紅色代表極高碳含量 亞馬遜河域跟洪氾區 切過了這個地區 再看看狀況極糟的地方 因為森林砍伐轉為藍色 森林砍伐如同病毒 蔓延到橘色的區域 我們再飛到安第斯山脈的南方 看看森林的邊緣 隨著上升的山脈地形 觀察碳地圖如何止盡 接著來到西亞馬遜的最大沼澤地 這個夢幻水澤地 類似詹姆斯·卡麥隆的「阿凡達」 我們可以到最小的熱帶國家 巴拿馬 觀察變化萬千的碳地圖 從高密度的紅色 到低密度的藍色 可惜低地的碳含量 已經消失殆盡 但是看到左側的區塊 紅色跟綠色標示的高碳含量 是在山區的部分 有個例外 很有趣 在銀幕的正中央 是巴拿馬運河周遭的緩衝區 紅色跟黃色的區塊 運河的管理單位 以強制手段 捍衛的流域跟全球經濟 這樣的碳地圖描繪 改變了環境保育 以及資源政策的發展 大大提升我們的能力 在保育森林跟抑制氣候變遷 有很大助益
My second question: How do we prepare for climate change in a place like the Amazon rainforest? Let me tell you, I spend a lot of time in these places, and we're seeing the climate changing already. Temperatures are increasing, and what's really happening is we're getting a lot of droughts, recurring droughts. The 2010 mega-drought is shown here with red showing an area about the size of Western Europe. The Amazon was so dry in 2010 that even the main stem of the Amazon river itself dried up partially, as you see in the photo in the lower portion of the slide. What we found is that in very remote areas, these droughts are having a big negative impact on tropical forests. For example, these are all of the dead trees in red that suffered mortality following the 2010 drought. This area happens to be on the border of Peru and Brazil, totally unexplored, almost totally unknown scientifically.
我的第二個問題是: 我們該如何為氣候變遷做準備? 以亞馬遜熱帶雨林為例 我花了很多時間在這些地方 而且我們已經看到氣候變遷 溫度上升 真實的是 乾旱越來越頻繁 重複不斷的乾旱 這裡顯示2010年的超級旱災 標註的紅色區塊 有西歐這麼大 2010年的亞馬遜非常乾燥 甚至連亞馬遜河的主流 有一部分都乾枯了 在幻燈片的下半部可以看到 我們發現在非常偏遠地區 這些乾旱對於熱帶森林 有很大的負面衝擊 舉例 紅色顯示的是因為2010年旱災 受災的枯死樹木 受災區在 祕魯跟巴西的邊境 是從未被探索過的地帶 幾乎是科學上的未知地帶
So what we think, as Earth scientists, is species are going to have to migrate with climate change from the east in Brazil all the way west into the Andes and up into the mountains in order to minimize their exposure to climate change. One of the problems with this is that humans are taking apart the western Amazon as we speak. Look at this 100-square-kilometer gash in the forest created by gold miners. You see the forest in green in 3D, and you see the effects of gold mining down below the soil surface. Species have nowhere to migrate in a system like this, obviously.
身為地球科學家 我們認為物種會遷移 隨著氣候的變遷 從巴西東部 往西移動到安地斯 往山上遷移 儘量減低氣候變遷 對他們的衝擊 其中一個問題就是 人類整在瓦解西亞馬遜區域 看看這個100平方公尺的開發區 這是金礦工在森林裡開墾的 3D的綠色區塊是森林 還有金礦開採帶來的效果 在地底下的系統裡 物種沒有任何地方可以遷移
If you haven't been to the Amazon, you should go. It's an amazing experience every time, no matter where you go. You're going to probably see it this way, on a river. But what happens is a lot of times the rivers hide what's really going on back in the forest itself. We flew over this same river, imaged the system in 3D. The forest is on the left. And then we can digitally remove the forest and see what's going on below the canopy. And in this case, we found gold mining activity, all of it illegal, set back away from the river's edge, as you'll see in those strange pockmarks coming up on your screen on the right. Don't worry, we're working with the authorities to deal with this and many, many other problems in the region.
如果你還沒去過亞馬遜 你真應該去 不論你去哪裡 每一次都是不可思議的經驗 你可能會看到這種河上景色 但很多時候 河流會隱藏森林裡的 事實真相 我們飛越同一條河流 以3D掃描這個河域系統 左邊的有森林 然後我們以數位分析 把森林移開 觀察樹冠層底下 結果我們發現金礦開採活動 全都是非法的 全都遠離河岸 看那些奇怪的麻子點點 在銀幕的右側 放心 我們已經跟當局在努力 解決這個地區的採礦問題 和許多其他的問題
So in order to put together a conservation plan for these unique, important corridors like the western Amazon and the Andes Amazon corridor, we have to start making geographically explicit plans now. How do we do that if we don't know the geography of biodiversity in the region, if it's so unknown to science? So what we've been doing is using the laser-guided spectroscopy from the CAO to map for the first time the biodiversity of the Amazon rainforest. Here you see actual data showing different species in different colors. Reds are one type of species, blues are another, and greens are yet another. And when we take this together and scale up to the regional level, we get a completely new geography of biodiversity unknown prior to this work. This tells us where the big biodiversity changes occur from habitat to habitat, and that's really important because it tells us a lot about where species may migrate to and migrate from as the climate shifts. And this is the pivotal information that's needed by decision makers to develop protected areas in the context of their regional development plans.
為了成立保育計畫 給這些獨特又重要的廊道 例如西亞馬遜 以及安地斯亞馬遜廊道 我們開始製作 地理上明確的計畫 如果不清楚這區域 生物多樣性的地理 又該怎麼著手呢? 所以我們應用 CAO的雷射導引光譜 繪製第一個亞馬遜雨林的 生物多樣性地圖 這個資料以顏色標註不同的物種 紅色的是相同物種 藍色則是另一種 綠色也是不同種的物種 當我們放大這張圖 到區域性的規模 我們看見一個全新的地理圖像 顯示前所未知的生物多樣性 這告訴我們哪裡有大規模的生物樣性變化 從一個棲息地 到另一個棲息地 這非常重要 因為我們可以知道 隨著氣候的變遷 很多物種的遷移動向 保護區發展計劃的決策者 正需要這種以他們區域背景做規劃的關鍵資訊 正需要這種以他們區域背景做規劃的關鍵資訊
And third and final question is, how do we manage biodiversity on a planet of protected ecosystems? The example I started out with about lions hunting, that was a study we did behind the fence line of a protected area in South Africa. And the truth is, much of Africa's nature is going to persist into the future in protected areas like I show in blue on the screen. This puts incredible pressure and responsibility on park management. They need to do and make decisions that will benefit all of the species that they're protecting. Some of their decisions have really big impacts. For example, how much and where to use fire as a management tool? Or, how to deal with a large species like elephants, which may, if their populations get too large, have a negative impact on the ecosystem and on other species. And let me tell you, these types of dynamics really play out on the landscape. In the foreground is an area with lots of fire and lots of elephants: wide open savanna in blue, and just a few trees. As we cross this fence line, now we're getting into an area that has had protection from fire and zero elephants: dense vegetation, a radically different ecosystem. And in a place like Kruger, the soaring elephant densities are a real problem. I know it's a sensitive issue for many of you, and there are no easy answers with this. But what's good is that the technology we've developed and we're working with in South Africa, for example, is allowing us to map every single tree in the savanna, and then through repeat flights we're able to see which trees are being pushed over by elephants, in the red as you see on the screen, and how much that's happening in different types of landscapes in the savanna. That's giving park managers a very first opportunity to use tactical management strategies that are more nuanced and don't lead to those extremes that I just showed you. So really, the way we're looking at protected areas nowadays is to think of it as tending to a circle of life, where we have fire management, elephant management, those impacts on the structure of the ecosystem, and then those impacts affecting everything from insects up to apex predators like lions.
第三個也是最後的問題 我們如何管理地球上 受保護的生態系裡的生物多樣性? 我最初舉例的獅子狩獵 那是我們的一項研究 在南非的 圈化保護區裡 事實上 未來非洲大部分的自然 將會在這種圈化的保護區裡延續 像銀幕上看到的藍色區塊 這在公園的管理處 造成極大的壓力跟責任 他們必須做出並且執行決策 讓所有受保護的物種受益 他們的一些決策有重大的影響 例如 以火作為管理工具的 次數跟地點 或是如何管理大型動物 例如大象 大象可能繁衍過量 對生態系裡的其他物種 產生負面衝擊 這些動態變化 是真實在大地上演的 前景看到的是大量用火 還有很多大象的地帶 藍色是開放性的大草原 樹很少 當我們跨過這個圍籬 進入的地區 用火適當 也沒有大象 茂密的植被 跟一個全然不同的生態系 在克魯格國家公園 大象的族群暴增 已經是個難題 我知道對很多人而言 這議題很敏感 這也沒有簡單的答案 但往好處想 我們發展的科技 還有例如我們跟南非的合作 讓我們描繪了大草原上的每棵樹 經過反覆的飛行 我們看到哪些樹 被大象推倒 從銀幕上的紅色 可以看見 還有次數的頻繁度 在大草原上不同的地景 這是公園管理員 有史以來第一次有機會用 更細微的管理策略 進而避免我們剛看到的極端狀況 所以 我們現在看待保護區的方式 所以 我們現在看待保護區的方式 已經趨向一種生命循環 我們有用火管理, 大象管理 這些衝擊生態系統的結構 而且這些衝擊 影響的所有物種 小至昆蟲 大至食物鏈頂端的獅子
Going forward, I plan to greatly expand the airborne observatory. I'm hoping to actually put the technology into orbit so we can manage the entire planet with technologies like this. Until then, you're going to find me flying in some remote place that you've never heard of. I just want to end by saying that technology is absolutely critical to managing our planet, but even more important is the understanding and wisdom to apply it.
在未來 我計劃更大量使用 卡內基空中天文台號 我希望讓這技術上星球軌道 以這種技術 管理我們的整個星球 在那之前 你會看到我不停飛行 在你從未耳聞的偏遠地區 最後我要說 在管理我們的星球 這項科技絕對有關鍵的角色 但更重要的是理解它 還有妥善的運用
Thank you.
謝謝
(Applause)
(掌聲)