Technology can change our understanding of nature.
เทคโนโลยีสามารถเปลี่ยนความเข้าใจของเรา เกี่ยวกับธรรมชาติได้
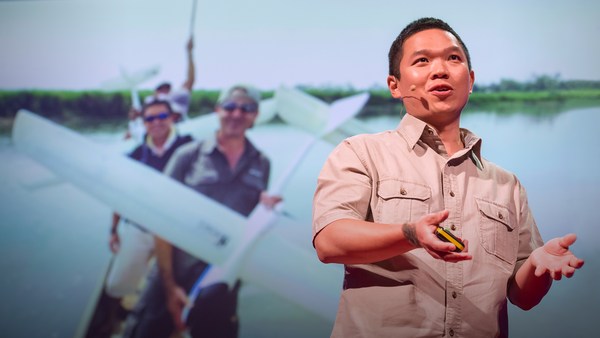
Take for example the case of lions. For centuries, it's been said that female lions do all of the hunting out in the open savanna, and male lions do nothing until it's time for dinner. You've heard this too, I can tell. Well recently, I led an airborne mapping campaign in the Kruger National Park in South Africa. Our colleagues put GPS tracking collars on male and female lions, and we mapped their hunting behavior from the air. The lower left shows a lion sizing up a herd of impala for a kill, and the right shows what I call the lion viewshed. That's how far the lion can see in all directions until his or her view is obstructed by vegetation. And what we found is that male lions are not the lazy hunters we thought them to be. They just use a different strategy. Whereas the female lions hunt out in the open savanna over long distances, usually during the day, male lions use an ambush strategy in dense vegetation, and often at night. This video shows the actual hunting viewsheds of male lions on the left and females on the right. Red and darker colors show more dense vegetation, and the white are wide open spaces. And this is the viewshed right literally at the eye level of hunting male and female lions. All of a sudden, you get a very clear understanding of the very spooky conditions under which male lions do their hunting.
ยกตัวอย่างเช่น กรณีของสิงห์โต หลายศตวรรษมาแล้ว กล่าวกันว่า สิงห์โตตัวเมีย ทำการล่าเหยื่อทั้งหมด ในป่าเปิดทุ่งหญ้าเขตร้อนสะวันนา (savanna) และสิงห์โตตัวผู้ไม่ได้ทำอะไรเลย จนถึงเวลาอาหาร คุณก็เคยได้ยินเรื่องนี้มาเหมือนกัน ผมบอกได้ แต่ไม่นานมานี้ ผมได้เป็นผู้นำโครงการ ทำแผนที่ทางอากาศ ในอุทยานแห่งชาติครูเกอร์ (Kruger) ในแอฟริกาใต้ เพื่อนร่วมงานของเรา เอาปลอกคอ GPS สวมให้กับสิงห์โตตัวผู้และตัวเมีย และเราก็ทำแผนที่ พฤติกรรมการล่าเหยื่อของมัน จากทางอากาศ ข้างใต้ซ้ายมือ แสดงสิงห์โตตัวหนึ่งกำลังจดจ้อง ฝูงละมั่งเพื่อจะล่าเป็นเหยื่อ ด้านขวามือแสดงสิ่งที่ผมเรียกว่า พื้นที่การมองเห็นของสิงห์โต ซึ่งก็คือ ระยะทางไกลแค่ไหน ที่สิงห์โตมองเห็นได้ ในทุกทิศทาง จนกระทั่งมุมมองที่มันเห็น ถูกขวางกั้นด้วยต้นไม้ใบไม้ และสิ่งที่เราพบ ก็คือ สิงห์โตตัวผู้ ไม่ได้เป็นนักล่าที่เกียจคร้าน อย่างที่พวกเราคิดว่ามันเป็น พวกมันแค่พียงใช้กลยุทธที่ต่างออกไป ในขณะที่ สิงห์โตตัวเมียล่าเหยื่อ ในที่เปิดโล่งของป่าเปิดสะวันนา ระยะทางยาวไกล โดยปกติในช่วงกลางวัน สิงห์โตตัวผู้จะใช้วิธีการซุ่มอยู่ ในป่าหนาทึบ และมักจะเป็นในช่วงกลางคืน วิดีโอนี้ แสดงการวิเคราะห์ พื้นที่การมองห็นในการล่าจริงๆ ของสิงห์โตตัวผู้ ทางด้านซ้ายมือ ส่วนตัวเมีย ทางด้านขวามือ สีแดงและสีคลํ้าๆนั้น แสดงถึงป่าที่หนาทึบมากยิ่งขี้น และสีขาวเป็นพื้นที่เปิดกว้าง นี่เป็นการวิเคราะห์พื้นที่การมองเห็น ตรงระดับสายตาพอดี ของสิงห์โตตัวผู้ และตัวเมีย ทันทีทันใด คุณก็จะเข้าใจได้ อย่างชัดเจนมาก ถึงสภาพที่เอื้อต่อการพรางตัวอย่างยิ่งที่ สิงห์โตตัวผู้ทำการล่าเหยื่อ
I bring up this example to begin, because it emphasizes how little we know about nature. There's been a huge amount of work done so far to try to slow down our losses of tropical forests, and we are losing our forests at a rapid rate, as shown in red on the slide. I find it ironic that we're doing so much, yet these areas are fairly unknown to science. So how can we save what we don't understand?
ผมนำเรื่องนี้มาเป็นตัวอย่าง ในการเริ่มต้นพูด ก็เพราะว่า มันยํ้าว่า เรายังรู้เรื่องของธรรมชาติ น้อยนิดเพียงใด จนถึงเดี๋ยวนี้ มีงานที่ได้ทำไปแล้วมากมาย ในการพยายามที่จะชะลอการสูญเสียป่าเขตร้อน เรากำลังสูญเสียป่าของเรา ในอัตราที่รวดเร็วมาก ตามที่แสดงให้เห็นเป็นสีแดง ในสไลด์ ผมพบว่า มันเป็นเรื่องตลกร้าย ที่เราก็กำลังทำอะไรมากมาย แต่พื้นที่เหล่านี้ เกือบไม่ได้ถูกศึกษาเลย ในทางวิทยาศาสตร์ ดังนั้น เราจะอนุรักษ์สิ่งที่เรายังไม่เข้าใจ ได้อย่างไร
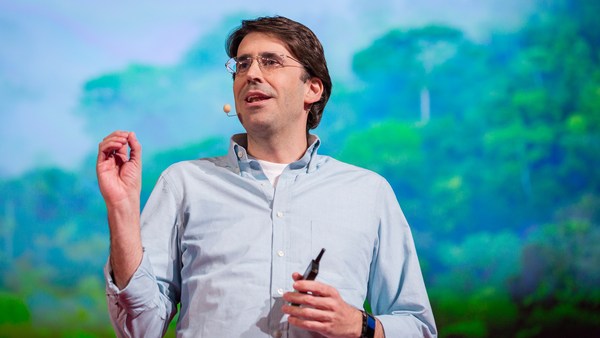
Now I'm a global ecologist and an Earth explorer with a background in physics and chemistry and biology and a lot of other boring subjects, but above all, I'm obsessed with what we don't know about our planet. So I created this, the Carnegie Airborne Observatory, or CAO. It may look like a plane with a fancy paint job, but I packed it with over 1,000 kilos of high-tech sensors, computers, and a very motivated staff of Earth scientists and pilots. Two of our instruments are very unique: one is called an imaging spectrometer that can actually measure the chemical composition of plants as we fly over them. Another one is a set of lasers, very high-powered lasers, that fire out of the bottom of the plane, sweeping across the ecosystem and measuring it at nearly 500,000 times per second in high-resolution 3D. Here's an image of the Golden Gate Bridge in San Francisco, not far from where I live. Although we flew straight over this bridge, we imaged it in 3D, captured its color in just a few seconds. But the real power of the CAO is its ability to capture the actual building blocks of ecosystems. This is a small town in the Amazon, imaged with the CAO. We can slice through our data and see, for example, the 3D structure of the vegetation and the buildings, or we can use the chemical information to actually figure out how fast the plants are growing as we fly over them. The hottest pinks are the fastest-growing plants. And we can see biodiversity in ways that you never could have imagined. This is what a rainforest might look like as you fly over it in a hot air balloon. This is how we see a rainforest, in kaleidoscopic color that tells us that there are many species living with one another. But you have to remember that these trees are literally bigger than whales, and what that means is that they're impossible to understand just by walking on the ground below them. So our imagery is 3D, it's chemical, it's biological, and this tells us not only the species that are living in the canopy, but it tells us a lot of information about the rest of the species that occupy the rainforest.
ขณะนี้ ผมเป็นนักอนุรักษ์โลก และนักสำรวจโลก พร้อมกับพื้นฐานทางฟิสิกส์และเคมี และชีววิทยา และวิชาการที่น่าเบื่ออื่นๆ อีกมาก แต่เหนือสิ่งอื่นใด ผมใจจดจ่อ อยู่กับสิ่งที่พวกเรายังไม่รู้ เกี่ยวกับโลกของเรานี้ ผมจึงได้สร้างสิ่งนี้ขึ้นมา หอสังเกตการณ์ทางอากาศคาร์เนกี (Carnegie Aorborne Observatory) หรือ CAO มันอาจจะดูเหมือนเครื่องบิน ที่มีสีฉูดฉาด แต่ผมใช้ขนอุปกรณ์หนักมากกว่า 1,000 กิโลกรัม ได้แก่ เครื่องมือตรวจวัดที่มีเทคโนโลยีชั้นสูง เครื่องคอมพิวเตอร์ และคนปฏิบัติงานที่มีแรงจูงใจสูง เป็นนักวิทยาศาสตร์โลก และนักบิน เครื่องมือสองแบบของเรา มีลักษณะเฉพาะอย่างมาก เครื่องหนึ่งเรียกชื่อว่า กล้องสเปกโตรมิเตอร์ (imaging spectrometer) ซึ่งวัดส่วนประกอบทางเคมีได้อย่างถ่องแท้ ของพืช ขณะเราบินอยู่เหนือพืชเหล่านั้น อีกเครื่องหนึ่ง เป็นชุดเครื่องเลเซอร์หนึ่งชุด ที่มีพลังเลเซอร์สูงมาก ซึ่งยิงรังสีออกมา จากทางข้างใต้ท้องเครื่องบิน กวาดไปตลอดทั่วระบบนิเวศน์ และวัดได้เกือบ 500,000 ครั้งต่อวินาที มีความคมชัดสูงในระบบสามมิติ นี่เป็นภาพของสะพานโกลเดนเกท ในกรุงซานฟรานซิสโก ซึ่งไม่ไกลจากที่ผมอยู่ แม้ว่าพวกเราบินตรงอยู่เหนือสะพานนี้ เราถ่ายภาพสามมิติ จับสีของมันไว้ได้ ภายในแค่สองสามวินาที แต่พลังจริงๆของเครื่อง CAO ก็คือความสามารถของมัน ในการจับภาพองค์ประกอบพื้นฐาน ของระบบนิเวศน์ นี่เป็นเมืองเล็กๆ ในอเมซอน เป็นภาพที่ได้จากเครื่อง CAO พวกเราสามารถแยกข้อมูลของเราออก และดูหลายๆ สิ่ง เช่น โครงสร้างสามมิติ ของพืช และอาคารก่อสร้าง หรือ เราจะสามารถใช้ข้อมูลทางเคมี เพื่อคำนวณว่า พืชเหล่านั้นเติบโตได้รวดเร็วเท่าใด ในขณะที่เราบินอยู่เหนือมัน สีชมพูที่เข้มที่สุด คือพืชที่โตได้เร็วที่สุด และเราจะสามารถเห็นความหลากหลาย ทางชีวภาพ ในแบบที่ คุณไม่เคยคาดคิดมาก่อน นี่คือ สิ่งที่ป่าหนาทึบในเขตร้อน ซึ่งมีฝนตกมากอาจจะเป็นอยู่ เหมือนกับที่คุณบินอยู่เหนือมัน ในลูกบอลลูน นี่คือ สิ่งที่เราเห็นในป่าฝนเขตร้อน มีสีสันหลากหลาย ซึ่งบอกเรา ว่ามีสิ่งมีชีวิตกี่สายพันธุ์ ที่อาศัยอยู่ด้วยกัน แต่คุณจะต้องจดจำไว้ว่า ต้นไม้เหล่านี้ จริงๆแล้ว ใหญ่กว่าวาฬ และนั่นหมายความได้ว่า เป็นไปไม่ได้ ที่จะเข้าใจมัน โดยเพียงเดินอยู่บนพื้นดิน ใต้ต้นไม้เหล่านั้น ภาพที่เราได้จึงเป็นสามมิติ มีข้อมูลทางเคมี และชีวภาพ และสิ่งนี้ ไม่เพียงแค่บอกเราว่ามีกี่สายพันธุ์ ที่อาศัยอยู่ในแมกไม้เหล่านั้น แต่มันให้ข้อมูลมากมายแก่เรา เกี่ยวกับสายพันธุ์หลายที่เหลือ ซึ่งมีอยู่ในป่าฝนเขตร้อน
Now I created the CAO in order to answer questions that have proven extremely challenging to answer from any other vantage point, such as from the ground, or from satellite sensors. I want to share three of those questions with you today. The first questions is, how do we manage our carbon reserves in tropical forests? Tropical forests contain a huge amount of carbon in the trees, and we need to keep that carbon in those forests if we're going to avoid any further global warming. Unfortunately, global carbon emissions from deforestation now equals the global transportation sector. That's all ships, airplanes, trains and automobiles combined. So it's understandable that policy negotiators have been working hard to reduce deforestation, but they're doing it on landscapes that are hardly known to science. If you don't know where the carbon is exactly, in detail, how can you know what you're losing? Basically, we need a high-tech accounting system. With our system, we're able to see the carbon stocks of tropical forests in utter detail. The red shows, obviously, closed-canopy tropical forest, and then you see the cookie cutting, or the cutting of the forest in yellows and greens. It's like cutting a cake except this cake is about whale deep. And yet, we can zoom in and see the forest and the trees at the same time. And what's amazing is, even though we flew very high above this forest, later on in analysis, we can go in and actually experience the treetrops, leaf by leaf, branch by branch, just as the other species that live in this forest experience it along with the trees themselves.
ขณะนี้ผมได้สร้างเครือง CAO เพื่อใช้ตอบคำถามที่ถูกพิสูจน์แล้วว่า เป็นสิ่งท้าทายอย่างที่สุด ที่จะหาคำตอบได้ จากตำแหน่งอื่นๆ เช่น จากพื้นดิน หรือจากเครื่องมือตรวจวัดจากดาวเทียม ในวันนี้ ผมอยากจะบอกคุณ ถึงคำถามสามข้อนั้น คำถามข้อแรกคือ เราจะจัดการกับแหล่งคาร์บอนของเรา ในป่าเขตร้อนอย่างไร ป่าเขตร้อนมีปริมาณของคาร์บอนในตันไม้ อยู่เป็นจำนวนมาก และเราจำเป็นต้องเก็บรักษา คาร์บอนในป่าเหล่านั้นไว้ ถ้าเราจะหลีกเลี่ยง ไม่ให้ภาวะโลกร้อนเพิ่มขึ้นอีก แต่โชคร้าย ที่การปล่อยคาร์บอนออกมา จากการทำลายป่าทั่วโลก ปัจจุบัน มีปริมาณเท่าๆ กับภาคการขนส่งทั่วโลก ซึ่งได้แก่ เรือ เครื่องบิน รถไฟ และรถยนต์ ทั้งหมด เอามารวมกัน เป็นที่พอเข้าใจได้ว่า เหล่านักเจรจาเพื่อร่างนโยบาย ได้ทำงานหนักมาอย่างต่อเนื่อง เพื่อลดการทำลายป่า แต่พวกเขากำลังทำอยู่บนภูมิทัศน์ ที่ไม่เป็นที่รู้จักดี ในเชิงวิทยาศาสตร์เลย ถ้าคุณไม่รู้ว่า คาร์บอนนั้นอยู่ตรงไหนแน่ ในรายละเอียด คุณจะรู้ได้อย่างไร ว่าคุณกำลัง สูญเสียอะไรอยู่ โดยพื้นฐานแล้ว เราต้องการระบบการจดบัญชี ที่มีเทคโนโลยีสูง ระบบของเรานั้น เราสามารถเห็นคลังของคาร์บอน ของป่าเขตร้อน ในรายละเอียดสูงสุด สีแดงแสดงอย่างชัดเจน ถึงป่าเขตร้อนที่แมกไม้ ขึ้นชิดติดกันอย่างหนาแน่น แล้วคุณก็จะเห็นการตัดพื้นที่ หรือการตัดป่าเป็นสีเหลืองและสีเขียว เหมือนๆ กับการตัดขนมเค้ก ยกเว้นเค้กก้อนนี้ มีความลึกประมาณ เท่าๆกับวาฬ แต่เราก็สามารถซูมเข้าไปดูป่า และดูต้นไม้ได้ ในเวลาเดียวกัน และสิ่งที่น่าอัศจรรย์ก็คือ แม้ว่าเราจะบิน อยู่สูงมาก เหนือผืนป่านี้ และหลังจากนั้น ในการวิเคราะห์ เราสามารถเข้าไป และสัมผัสประสบการณ์ ราวกับอยู่บนยอดไม้จริงๆ เห็นถึงใบไม้ และกิ่งก้าน เช่นเดียวกับที่สัตว์อื่นๆ ที่อาศัยอยู่ในป่านี้ ได้สัมผัสต้นไม้เหล่านี้
We've been using the technology to explore and to actually put out the first carbon geographies in high resolution in faraway places like the Amazon Basin and not-so-faraway places like the United States and Central America. What I'm going to do is I'm going to take you on a high-resolution, first-time tour of the carbon landscapes of Peru and then Panama. The colors are going to be going from red to blue. Red is extremely high carbon stocks, your largest cathedral forests you can imagine, and blue are very low carbon stocks. And let me tell you, Peru alone is an amazing place, totally unknown in terms of its carbon geography until today. We can fly to this area in northern Peru and see super high carbon stocks in red, and the Amazon River and floodplain cutting right through it. We can go to an area of utter devastation caused by deforestation in blue, and the virus of deforestation spreading out in orange. We can also fly to the southern Andes to see the tree line and see exactly how the carbon geography ends as we go up into the mountain system. And we can go to the biggest swamp in the western Amazon. It's a watery dreamworld akin to Jim Cameron's "Avatar." We can go to one of the smallest tropical countries, Panama, and see also a huge range of carbon variation, from high in red to low in blue. Unfortunately, most of the carbon is lost in the lowlands, but what you see that's left, in terms of high carbon stocks in greens and reds, is the stuff that's up in the mountains. One interesting exception to this is right in the middle of your screen. You're seeing the buffer zone around the Panama Canal. That's in the reds and yellows. The canal authorities are using force to protect their watershed and global commerce. This kind of carbon mapping has transformed conservation and resource policy development. It's really advancing our ability to save forests and to curb climate change.
เราได้ใช้เทคโนยีนี้เพื่อสำรวจ และทำภูมิทัศน์ของคาร์บอนชิ้นแรกออกมาได้จริง ที่มีความละเอียดของภาพสูง ในที่ไกลๆ อย่างเช่น ลุ่มนํ้าอเมซอน และในที่ที่ไม่ไกลนัก อย่างเช่น สหรัฐอเมริกา และอเมริกากลาง สิ่งที่ผมกำลังจะทำก็คือ ผมจะพาคุณไปทัวร์ครั้งแรก กับภาพที่มีความละเอียดสูง ของภูมิทัศน์ของคาร์บอน ของเปรู และปานามา สีนั้นมีตั้งแต่สีแดง ไปจนถึงสีนํ้าเงิน สีแดงเป็นแหล่งที่มีคาร์บอนสูงยิ่ง หรือป่าที่มีต้นไม้ใหญ่ที่กว้างที่สุด ที่คุณจะสามารถ จินตนาการได้ และสีนํ้าเงิน เป็นแหล่งที่มีคาร์บอนตํ่ามาก และผมขอบอกคุณว่า เปรูประเทศเดียว เป็นที่ๆ น่าอัศจรรย์แห่งหนึ่ง ที่ไม่มีใครรู้อะไรเลย เกี่ยวกับภูมิศาสตร์ของคาร์บอน จนถึงทุกวันนี้ เราสามารถบินไปยังพื้นที่นี้ ในตอนเหนือของเปรู และเห็นแหล่งคาร์บอนที่สูงสุดยอด ซึ่งเป็นสีแดง และแม่นํ้าอเมซอน และที่ราบที่นํ้าท่วมถึง ตัดตรงผ่านเข้าไป เราสามารถไปยังพื้นที่หนึ่ง ที่เสียหายอย่างสิ้นเชิง สาเหตุเกิดจากการทำลายป่า ที่เห็นเป็นสีนํ้าเงิน และการทำลายป่าก็ยังลุกลายขยายออกไป ในบริเวณที่เห็นเป็นสีส้ม เรายังสามารถบินไปที่เทือกเขาแอนดีสตอนใต้ เพื่อดูแนวต้นไม้ และดูให้แน่ๆว่า ภูมิศาสตร์ของคาร์บอนนั้นจบลงอย่างไร เมื่อเราขึ้นไปในเทือกเขา และเราจะไปได้จนถึงบึงที่ใหญ่ที่สุด ในอเมซอนตะวันตก เป็นโลกที่ชุ่มชื้นในฝัน คล้ายกับภาพยนต์ของ เจมส์ คาร์เมรอน เรื่อง "อวาตาร" เราสามารถไปที่ประเทศเล็กที่สุด ในเขตร้อนทั้งหลาย เช่นปานามา และเห็นรูปแบบอันหลากหลาย ของคาร์บอนได้อีกด้วย ตั้งแต่ระดับสูง ที่เป็นสีแดง ถึงระดับตํ่า ที่เป็นสีนํ้าเงิน แต่โชคไม่ดี คาร์บอนส่วนใหญ่ในพื้นที่ลุ่ม ได้สูญเสียไปแล้ว แต่ที่คุณเห็น ซึ่งหลงเหลืออยู่นั้น แหล่งคาร์บอนสูง ที่เป็นสีเขียวและสีแดง นั้นอยู่สูงขึ้นไปบนภูเขา ข้อยกเว้นที่น่าสนใจอย่างหนึ่ง สำหรับเรื่องนี้ ก็คือ ตรงกลางจอของคุณพอดี คุณจะเห็นโซนกันชน รอบๆ คลองปานามา ตรงที่เป็นสีแดงและสีเหลือง เจ้าหน้าที่ของคลอง ใช้กำลัง เพื่อปกป้องการพาณิชย์โลก และแหล่งนํ้าของพวกเขา การทำแผนที่คาร์บอนแบบนี้ ได้เปลี่ยนรูปของการพัฒนา นโยบายทรัพยากรและการอนุรักษ์ไปแล้ว เป็นความก้าวหน้า ในด้านความสามารถของเรา ที่จะรักษาป่าไว้ได้อย่างแท้จริง และเพื่อชะลอการเปลี่ยนแปลงของภูมิอากาศ
My second question: How do we prepare for climate change in a place like the Amazon rainforest? Let me tell you, I spend a lot of time in these places, and we're seeing the climate changing already. Temperatures are increasing, and what's really happening is we're getting a lot of droughts, recurring droughts. The 2010 mega-drought is shown here with red showing an area about the size of Western Europe. The Amazon was so dry in 2010 that even the main stem of the Amazon river itself dried up partially, as you see in the photo in the lower portion of the slide. What we found is that in very remote areas, these droughts are having a big negative impact on tropical forests. For example, these are all of the dead trees in red that suffered mortality following the 2010 drought. This area happens to be on the border of Peru and Brazil, totally unexplored, almost totally unknown scientifically.
คำถามข้อที่สองของผมคือ เราจะเตรียมตัวสำหรับ การเปลี่ยนแปลงภูมิอากาศได้อย่างไร ในพื้นที่อย่างเช่น ป่าฝนอเมซอน ผมขอบอกคุณว่า ผมใช้เวลาไปมาก ในที่ต่างๆ เหล่านี้ และเราก็เริ่มเห็นภูมิอากาศ เปลี่ยนแปลงไปแล้ว อุณหภูมิสูงขึ้น และสิ่งที่กำลังเกิดขึ้นจริงๆ ก็คือ เกิดความแห้งแล้งขึ้นมากมาย เป็นความแห้งแล้งที่เกิดขึ้นซํ้าแล้วซํ้าเล่า ความแห้งแล้งครั้งยิ่งใหญ่ในปี 2010 ที่แสดงตรงนี้ ด้วยสีแดง แสดงพื้นที่เทียบเท่ายุโรปตะวันตก แม่นํ้าอเมซอน แห้งมากในปี 2010 จนกระทั่งแม้เส้นนํ้าหลักของอเมซอนเอง ก็ยังเหือดแห้งไปเป็นบางส่วน ดังที่เห็นอยู่ในภาพ ในส่วนล่างของสไลด์ สิ่งที่เราพบก็คือ ในพื้นที่ห่างไกลมากๆ ก็คือ ความแห้งแล้งเหล่านี้ มีผลกระทบเชิงลบอย่างมาก ต่อป่าเขตร้อน ตัวอย่างเช่น ต้นไม้เหล่านี้ตายไปแล้วทั้งหมด ที่เป็นสีแดง เป็นผลจากความแห้งแล้งในปี 2010 พื้นที่นี้บังเอิญเป็นชายแดน ของเปรู และบราซิล ซึ่งไม่มีการสำรวจเลย เกือบไม่เป็นที่รู้จักกันเลย ในเชิงวิทยาศาสตร์
So what we think, as Earth scientists, is species are going to have to migrate with climate change from the east in Brazil all the way west into the Andes and up into the mountains in order to minimize their exposure to climate change. One of the problems with this is that humans are taking apart the western Amazon as we speak. Look at this 100-square-kilometer gash in the forest created by gold miners. You see the forest in green in 3D, and you see the effects of gold mining down below the soil surface. Species have nowhere to migrate in a system like this, obviously.
ดังนั้น สิ่งที่เราคิด ในฐานะเป็นนักวิทยาศาสตร์โลก ก็คือ สัตว์ต่างๆ จะต้องอพยพออกไป จากการเปลี่ยนแปลงภูมิอากาศ จากทิศตะวันออกในบราซิล ไปยังฝั่งตะวันตก เข้าไปสู่เทือกเขาแอนดีส และขึ้นไปบนภูเขา เพื่อลดผลกระทบจากการเปลี่ยนแปลงสภาพภูมิอากาศ ปัญหาหนึ่งเกี่ยวกับเรื่องนี้ ก็คือ มนุษย์เรา กำลังทำให้อเมซอนตะวันตกแยกออกจากกัน มาดูรอยแผลลึก ขนาด 100 ตารางกิโลเมตร ในป่าซึ่งเกิดจากคนทำเหมืองทองคำ คุณเห็นป่า เป็นสีเขียว ในแบบสามมิติ และคุณเห็นผล ของการทำเหมืองทองคำ ลงไปลึกใต้ผิวดิน ชัดเจนว่า สัตว์สายพันธุ์ต่างๆ ไม่มีทางจะอพยพได้ในสภาพเช่นนี้
If you haven't been to the Amazon, you should go. It's an amazing experience every time, no matter where you go. You're going to probably see it this way, on a river. But what happens is a lot of times the rivers hide what's really going on back in the forest itself. We flew over this same river, imaged the system in 3D. The forest is on the left. And then we can digitally remove the forest and see what's going on below the canopy. And in this case, we found gold mining activity, all of it illegal, set back away from the river's edge, as you'll see in those strange pockmarks coming up on your screen on the right. Don't worry, we're working with the authorities to deal with this and many, many other problems in the region.
ถ้าคุณไม่เคยไปอเมซอน คุณก็ควรจะไป มันเป็นประสบการณ์ที่น่าอัศจรรย์ ทุกครั้งไป ไม่ว่าคุณจะไปตรงไหน บางทีคุณอาจจะเห็นมันในรูปแบบนี้ ในแม่นํ้า แต่สิ่งที่เกิดขึ้น คือ หลายต่อหลายครั้ง แม่นํ้าซ่อนสิ่งที่กำลังเกิดขึ้นจริงๆ ไว้ด้านหลังในป่า เราบินอยู่เหนือแม่นํ้าเดียวกันนี้ ถ่ายภาพระบบนี้ไว้ในแบบสามมิติ ป่าอยู่ทางด้านซ้ายมือ แล้วเราก็สามารถแยกป่าออกไปได้ โดยวิธีดิจิตอล และเห็นสิ่งที่กำลังเกิดขึ้น ข้างใต้แมกไม้นั้น และในกรณีนี้ เราพบว่าการทำเหมืองทองคำ ซึ่งทั้งหมดนั้นผิดกฎหมาย ลึกเข้าไปในป่าจากฝั่งแม่นํ้า ตามที่คุณเห็นในรอยหลุมของแผลเป็นแปลกๆเหล่านั้น ขึ้นมาบนจอทางด้านขวามือ ไม่ต้องกังวลหรอกครับ เราทำงานกับเจ้าหน้าที่ เพื่อจัดการกับเรื่องนี้ และกับปัญหาอื่นๆ อีกหลายๆ เรื่อง ในภูมิภาคนั้น
So in order to put together a conservation plan for these unique, important corridors like the western Amazon and the Andes Amazon corridor, we have to start making geographically explicit plans now. How do we do that if we don't know the geography of biodiversity in the region, if it's so unknown to science? So what we've been doing is using the laser-guided spectroscopy from the CAO to map for the first time the biodiversity of the Amazon rainforest. Here you see actual data showing different species in different colors. Reds are one type of species, blues are another, and greens are yet another. And when we take this together and scale up to the regional level, we get a completely new geography of biodiversity unknown prior to this work. This tells us where the big biodiversity changes occur from habitat to habitat, and that's really important because it tells us a lot about where species may migrate to and migrate from as the climate shifts. And this is the pivotal information that's needed by decision makers to develop protected areas in the context of their regional development plans.
ดังนั้นเพื่อที่จะทำแผนการอนุรักษ์ สำหรับพื้นที่กันชนที่สำคัญ และมีเอกลักษณ์เฉพาะเหล่านี้ อย่างเช่น อเมซอนตะวันตก และพื้นที่กันชนอเมซอน เทือกเขาแอนดีส เราต้องเริ่มต้นทำ การวางแผนที่ชัดเจนด้านภูมิศาสตร์ เสียแต่เดี๋ยวนี้ เราจะทำเรื่องนั้นได้อย่างไร ถ้าเราไม่รู้ภูมิศาสตร์ ของความหลากหลายทางชีวภาพในภูมิภาคนั้น ถ้ามันไม่เป็นรู้จักกันเลย ทางวิทยาศาสตร์ ดังนั้น สิ่งที่เรากำลังทำอยู่ก็คือ การใชั กล้องสเปกโตรมีเตอร์นำทางด้วยเลเซอร์ จาก CAO เพื่อทำแผนที่แสดงความหลากหลายทางชีวภาพ ขึ้นเป็นครั้งแรก ของป่าฝนอเมซอน ตรงนี้ คุณจะเห็นข้อมูลจริง ที่แสดงสายพันธุ์ต่างๆ ในสีต่างๆ กัน สีแดงเป็นสายพันธุ์หนึ่งชนิด สีนํ้าเงินอีกชนิดหนึ่ง สีเขียวเป็นอีกชนิดหนึ่ง และเมื่อเราเอามารวมกันเข้า และมาจัดมาตราส่วน ในระดับภูมิภาคนั้น เราก็จะได้ภูมิศาสตร์ใหม่ทั้งหมด ของความหลากหลายทางชีวภาพ ที่เราไม่เคยรู้ ก่อนหน้างานชิ้นนี้ สิ่งนี้บอกเราว่า การเปลี่ยนแปลงความหลากหลาย ทางชีวภาพครั้งใหญ่ๆนั้น เกิดขึ้นที่ใด จากแหล่งหนึ่ง ไปอีกแหล่งหนึ่ง และเรื่องนั้นสำคัญอย่างแท้จริง เพราะว่ามันบอกเรา อย่างมากมายว่า สัตว์แต่ละสายพันธุ์จะย้ายถิ่นไปที่ใด และอพยพจากที่ใด เมื่อภูมิอากาศเปลี่ยนแปลง และนี่เป็นข้อมูลสำคัญที่จำเป็น สำหรับผู้มีอำนาจตัดสินใจ เพื่อจะพัฒนาพื้นที่คุ้มครอง ในบริบทของแผนพัฒนาภูมิภาคของเขา
And third and final question is, how do we manage biodiversity on a planet of protected ecosystems? The example I started out with about lions hunting, that was a study we did behind the fence line of a protected area in South Africa. And the truth is, much of Africa's nature is going to persist into the future in protected areas like I show in blue on the screen. This puts incredible pressure and responsibility on park management. They need to do and make decisions that will benefit all of the species that they're protecting. Some of their decisions have really big impacts. For example, how much and where to use fire as a management tool? Or, how to deal with a large species like elephants, which may, if their populations get too large, have a negative impact on the ecosystem and on other species. And let me tell you, these types of dynamics really play out on the landscape. In the foreground is an area with lots of fire and lots of elephants: wide open savanna in blue, and just a few trees. As we cross this fence line, now we're getting into an area that has had protection from fire and zero elephants: dense vegetation, a radically different ecosystem. And in a place like Kruger, the soaring elephant densities are a real problem. I know it's a sensitive issue for many of you, and there are no easy answers with this. But what's good is that the technology we've developed and we're working with in South Africa, for example, is allowing us to map every single tree in the savanna, and then through repeat flights we're able to see which trees are being pushed over by elephants, in the red as you see on the screen, and how much that's happening in different types of landscapes in the savanna. That's giving park managers a very first opportunity to use tactical management strategies that are more nuanced and don't lead to those extremes that I just showed you. So really, the way we're looking at protected areas nowadays is to think of it as tending to a circle of life, where we have fire management, elephant management, those impacts on the structure of the ecosystem, and then those impacts affecting everything from insects up to apex predators like lions.
และคำถามที่สามและสุดท้าย ก็คือ เราจะจัดการกับความหลากหลายทางชีวภาพบนโลก ของระบบนิเวศน์ที่ได้รับการคุ้มครองนี้ อย่างไร ตัวอย่างที่ผมเริ่มต้นไว้นั้น เรื่องการล่าเหยื่อของสิงห์โต ซึ่งเป็นงานวิจัยที่เราทำ ในแนวเขตพื้นที่คุ้มครอง ในแอฟริกาใต้ และความจริงก็คือ ธรรมชาติของแอฟริกาส่วนใหญ่ จะยังคงยืนหยัดไปในอนาคต ในพื้นที่คุ้มครอง เช่น ที่ผมแสดงเป็นสีนํ้าเงินบนจอ สิ่งนี้ก่อให้เกิดความกดดันและ ความรับผิดชอบขึ้นมาอย่างไม่น่าเชื่อ กับการจัดการอุทยาน พวกเขาจำเป็นต้องทำและต้องตัดสินใจ ซึ่งจะเป็นประโยชน์ต่อสัตว์ทั้งหมด ที่พวกเขาปกป้องอยู่ การตัดสินใจบางอย่างของพวกเขา ส่งผลกระทบที่ใหญ่ยิ่งจริงๆ ยกตัวอย่าง จะมากน้อยแค่ไหน และที่ใดบ้าง ที่จะใช้ไฟ เป็นเครื่องมือการจัดการ หรือจะจัดการกับสัตว์ใหญ่ เช่น ช้างได้อย่างไร ซึ่งบางที ถ้าประชากรช้าง มีมากเกินไป ก็จะมีผลทางลบกับระบบนิเวศน์ และกับสิ่งมีชีวิตสายพันธุ์อื่นๆ ผมขอบอกว่า ประเภทของกลไกเหล่านี้ เอาไปใช้ได้จริงๆในภูมิทัศน์ ทิวทัศน์ด้านหน้า เป็นพื้นที่ๆมีไฟเกิดขึ้นมาก และก็มีช้างเป็นจำนวนมาก ป่าเปิดกว้างสะวันนา ที่เป็นสีนํ้าเงิน และต้นไม้ไม่กี่ต้น เมื่อเราข้ามแนวเส้นรั้วไป เราก็เข้าไป ในพื้นที่ๆได้รับการปกป้องจากไฟ และไม่มีช้างอยู่เลย พืชขึ้นหนาทึบ ซึ่งเป็นระบบนิเวศน์ที่ต่างไปอย่างมาก และในพื้นที่อย่างเช่น อุทยาน ครูเกอร์ ซึ่งความหนาแน่นของช้างเพิ่มสูงขึ้น เป็นปัญหาที่แท้จริง ผมทราบว่า มันเป็นปัญหาที่อ่อนไหว สำหรับหลายๆท่าน และไม่มีคำตอบง่ายๆ เกี่ยวกับเรื่องนี้ แต่สิ่งที่ดีก็คือ เทคโนโลยี ที่เราได้พัฒนาขึ้นมา และที่เรากำลังใช้งานอยู่ในพื้นที่ เช่น แอฟริกาใต้ นั้น ทำให้เราทำแผนที่ต้นไม้ทุกๆต้น ในป่าสะวันนา และแล้วด้วยการบินซํ้าอีกครั้ง เราก็สามารถเห็นว่าต้นไม้ต้นไหน โค่นลงเพราะถูกช้าง ที่เป็นสีแดง ตามที่เห็นบนจอ และนั่นกำลังเกิดขึ้น มากน้อยเท่าใด ในชนิดต่างๆของภูมิทัศน์ ในป่าสะวันนา นั่นคือ ถ้าให้ผู้จัดการอุทยาน โอกาสแรกสุด ที่จะใช้ยุทธวิธีการจัดการ ที่เป็นการปรับเปลี่ยนเล็กน้อย และไม่ใช่วิธีสุดโต่ง อย่างที่ผมเพิ่งแสดงให้ดู จริงๆแล้ว มุมมองที่เรามี ต่อพื้นที่คุ้มครอง ในปัจจุบันนี้ ก็คือ การคิดถึงมัน เหมือนการจัดการวงจรชีวิต ที่ซึ่ง เรามีการจัดการไฟ การจัดการช้าง ปัจจัยที่กระทบ ต่อโครงสร้างระบบนิเวศน์ ปัจจัยที่กระทบต่อ ทุกสิ่ง ตั้งแต่แมลง ขึ้นไปจนถึงผู้ล่าชั้นบนสุด เช่น สิงห์โต
Going forward, I plan to greatly expand the airborne observatory. I'm hoping to actually put the technology into orbit so we can manage the entire planet with technologies like this. Until then, you're going to find me flying in some remote place that you've never heard of. I just want to end by saying that technology is absolutely critical to managing our planet, but even more important is the understanding and wisdom to apply it.
ต่อไปข้างหน้า ผมวางแผนจะขยาย การสังเกตการณ์ทางอากาศให้มากขึ้น ผมหวังว่า จะเอาเทคโนโลยีนี้ขึ้นไปบนวงโคจรโลก เพื่อที่เราจะสามารถใช้เทคโนโลยีนี้ จัดการทั่วทั้งโลก จนกว่าจะถึงวันนั้น คุณจะพบผมบินอยู่ ในพื้นที่ห่างไกลบางแห่ง ซึ่งคุณไม่เคยได้ยินชื่อมาก่อน ผมต้องการจบ ด้วยการกล่าวว่า เทคโนโลยีนั้น สำคัญอย่างยิ่งยวด ต่อการจัดการโลกของเรา แต่ที่สำคัญยิ่งกว่านั้นก็คือ ความเข้าใจ และความฉลาดที่จะนำมันไปประยุกต์ใช้
Thank you.
ขอบคุณครับ
(Applause)
(เสียงปรบมือ)