Technology can change our understanding of nature.
Technologie kan ons leren de natuur beter te begrijpen.
Take for example the case of lions. For centuries, it's been said that female lions do all of the hunting out in the open savanna, and male lions do nothing until it's time for dinner. You've heard this too, I can tell. Well recently, I led an airborne mapping campaign in the Kruger National Park in South Africa. Our colleagues put GPS tracking collars on male and female lions, and we mapped their hunting behavior from the air. The lower left shows a lion sizing up a herd of impala for a kill, and the right shows what I call the lion viewshed. That's how far the lion can see in all directions until his or her view is obstructed by vegetation. And what we found is that male lions are not the lazy hunters we thought them to be. They just use a different strategy. Whereas the female lions hunt out in the open savanna over long distances, usually during the day, male lions use an ambush strategy in dense vegetation, and often at night. This video shows the actual hunting viewsheds of male lions on the left and females on the right. Red and darker colors show more dense vegetation, and the white are wide open spaces. And this is the viewshed right literally at the eye level of hunting male and female lions. All of a sudden, you get a very clear understanding of the very spooky conditions under which male lions do their hunting.
Neem bijvoorbeeld leeuwen. Al eeuwenlang zegt men dat het jagen op de savanne door leeuwinnen wordt gedaan. Mannetjesleeuwen doen niets tot het etenstijd is. Dat heb je vast wel eens gehoord. Ik heb onlangs een campagne geleid in het Kruger Nationaal Park in Zuid-Afrika. Mijn collega's deden de leeuwen een halsband met GPS om. We brachten hun jachtgedrag in kaart vanuit de lucht. Linksonder komt een leeuw te voorschijn om op een kudde impala's te jagen. Rechts zie je wat ik noem: het zichtvenster. Dat is hoe ver de leeuw kan zien in alle richtingen, totdat vegetatie in de weg staat. We ontdekten dat mannetjesleeuwen geen luie jagers zijn zoals we dachten. Hun strategie is alleen anders. Terwijl de leeuwinnen op de open savanne jagen over grote afstanden, meestal overdag, gebruiken mannetjesleeuwen een overvaltechniek in dichte vegetatie, vaak 's nachts. Deze video laat het zichtvenster zien van mannetjesleeuwen links en leeuwinnen rechts. Rode en donkerdere kleuren zijn dichte vegetatie, witte zijn de open plekken. Dit is het zichtvenster van jagende leeuwen op ooghoogte. Je gaat ineens goed begrijpen onder welke spookachtige omstandigheden mannetjesleeuwen jagen.
I bring up this example to begin, because it emphasizes how little we know about nature. There's been a huge amount of work done so far to try to slow down our losses of tropical forests, and we are losing our forests at a rapid rate, as shown in red on the slide. I find it ironic that we're doing so much, yet these areas are fairly unknown to science. So how can we save what we don't understand?
Het laat zien hoe weinig we van de natuur weten. Er is al veel werk gedaan om de snelle vernietiging van onze tropische bossen te vertragen. Want die verdwijnen in hoog tempo, zoals hier te zien is in het rood. Het is ironisch dat we zoveel doen terwijl deze gebieden nog vrijwel onbekend zijn bij de wetenschap. Hoe kunnen we dan beschermen wat we niet begrijpen?
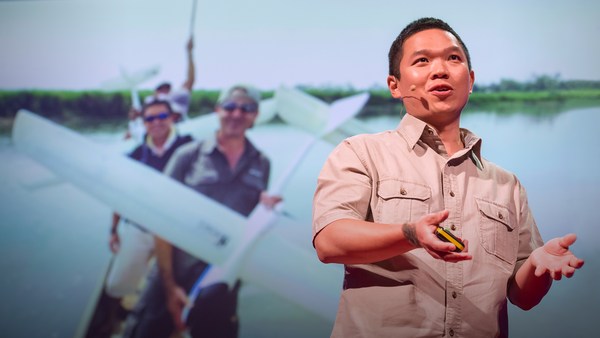
Now I'm a global ecologist and an Earth explorer with a background in physics and chemistry and biology and a lot of other boring subjects, but above all, I'm obsessed with what we don't know about our planet. So I created this, the Carnegie Airborne Observatory, or CAO. It may look like a plane with a fancy paint job, but I packed it with over 1,000 kilos of high-tech sensors, computers, and a very motivated staff of Earth scientists and pilots. Two of our instruments are very unique: one is called an imaging spectrometer that can actually measure the chemical composition of plants as we fly over them. Another one is a set of lasers, very high-powered lasers, that fire out of the bottom of the plane, sweeping across the ecosystem and measuring it at nearly 500,000 times per second in high-resolution 3D. Here's an image of the Golden Gate Bridge in San Francisco, not far from where I live. Although we flew straight over this bridge, we imaged it in 3D, captured its color in just a few seconds. But the real power of the CAO is its ability to capture the actual building blocks of ecosystems. This is a small town in the Amazon, imaged with the CAO. We can slice through our data and see, for example, the 3D structure of the vegetation and the buildings, or we can use the chemical information to actually figure out how fast the plants are growing as we fly over them. The hottest pinks are the fastest-growing plants. And we can see biodiversity in ways that you never could have imagined. This is what a rainforest might look like as you fly over it in a hot air balloon. This is how we see a rainforest, in kaleidoscopic color that tells us that there are many species living with one another. But you have to remember that these trees are literally bigger than whales, and what that means is that they're impossible to understand just by walking on the ground below them. So our imagery is 3D, it's chemical, it's biological, and this tells us not only the species that are living in the canopy, but it tells us a lot of information about the rest of the species that occupy the rainforest.
Ik ben ecoloog en aardwetenschapper, met natuur- en scheikundeachtergrond, en nog meer saaie onderwerpen, maar bovendien ben ik bezeten van wat we niet weten van onze planeet. Ik heb dit bedacht: het Carnegie Airborne Observatory, of CAO. Het lijkt op een mooi geverfd vliegtuig, maar ik heb het volgestopt met 1000 kilo aan hightech-sensoren, computers en een zeer gemotiveerd team van aardwetenschappers en piloten. Twee instrumenten zijn uniek: Een wordt spectrometer genoemd en kan de chemische samenstelling meten van planten waar we overheen vliegen. Dan hebben we nog een paar lasers, erg sterke lasers, die vanuit de bodem van het vliegtuig over het ecosysteem stralen en dat bijna 500.000 keer per seconde meten in hoge resolutie en 3D. Dit is de Golden Gate Brug in San Francisco, vlakbij mijn huis. We vlogen recht over de brug heen, en maakten een scan in 3D, in kleur binnen een paar seconden. De echte kracht van de CAO is dat hij de echte bouwstenen van het ecosysteem kan vastleggen. Dit is een dorpje in de Amazone, vastgelegd met de CAO. Je kunt door de gegevens heen snijden en de 3D-structuur zien van de begroeiing en de gebouwen. Of we gebruiken de chemische informatie om te zien hoe snel de planten groeien, terwijl we er overheen vliegen. De rose gebieden zijn de snelst groeiende planten. We kunnen de biodiversiteit zien zoals je nog nooit hebt gezien. Zo ziet een regenwoud eruit vanuit een heteluchtballon. En zo zien wij het. In caleidoscopische kleuren zodat je ziet dat er verschillende soorten samenleven. Bedenk dat deze bomen groter zijn dan een walvis. Je kunt ze niet begrijpen vanaf de grond. Onze beelden zijn dus in 3D, chemisch en biologisch, en zegt niet alleen welke soorten er in de boomkruinen leven, maar ook over de andere soorten in het tropisch regenwoud. Ik heb het CAO opgericht om antwoord te geven
Now I created the CAO in order to answer questions that have proven extremely challenging to answer from any other vantage point, such as from the ground, or from satellite sensors. I want to share three of those questions with you today. The first questions is, how do we manage our carbon reserves in tropical forests? Tropical forests contain a huge amount of carbon in the trees, and we need to keep that carbon in those forests if we're going to avoid any further global warming. Unfortunately, global carbon emissions from deforestation now equals the global transportation sector. That's all ships, airplanes, trains and automobiles combined. So it's understandable that policy negotiators have been working hard to reduce deforestation, but they're doing it on landscapes that are hardly known to science. If you don't know where the carbon is exactly, in detail, how can you know what you're losing? Basically, we need a high-tech accounting system. With our system, we're able to see the carbon stocks of tropical forests in utter detail. The red shows, obviously, closed-canopy tropical forest, and then you see the cookie cutting, or the cutting of the forest in yellows and greens. It's like cutting a cake except this cake is about whale deep. And yet, we can zoom in and see the forest and the trees at the same time. And what's amazing is, even though we flew very high above this forest, later on in analysis, we can go in and actually experience the treetrops, leaf by leaf, branch by branch, just as the other species that live in this forest experience it along with the trees themselves.
op vragen die moeilijk te beantwoorden zijn, zowel vanaf de grond of via satellieten. Ik wil drie zulke vragen met jullie delen. De eerste is: Hoe kunnen we onze koolstofreserves in tropische bossen beheren? Tropische bossen bevatten enorm veel koolstof in de bomen. We moeten dat daar houden als we verdere opwarming van de aarde willen voorkomen. Helaas is de CO2-uitstoot door ontbossing al evenveel als die door transport. Dat zijn alle schepen, vliegtuigen, treinen en auto's samen. Het is dus logisch dat beleid onderhandelaars alles doen om ontbossing te verminderen. Maar ze doen het bij nog onbekende landschappen Als je niet precies weer waar de koolstof zit, hoe weet je dan wat je verliest? We hebben eigenlijk een hightech-rekensysteem nodig. Met ons systeem zien we tot in detail de koolstofvoorraden in tropisch bos. Rood is dicht tropisch regenwoud. Je ziet de houtkap in geel en groen. Het lijkt op het snijden van taart, alleen is deze zo dik als een walvis. We kunnen ook inzoomen en tegelijk het bos en de bomen zien. Het is geweldig dat we heel hoog boven dit bos vlogen, en toch alles konden zien. Blad voor blad, tak voor tak. Blad voor blad, tak voor tak. Maar ook andere soorten die in het bos leven worden meegenomen.
We've been using the technology to explore and to actually put out the first carbon geographies in high resolution in faraway places like the Amazon Basin and not-so-faraway places like the United States and Central America. What I'm going to do is I'm going to take you on a high-resolution, first-time tour of the carbon landscapes of Peru and then Panama. The colors are going to be going from red to blue. Red is extremely high carbon stocks, your largest cathedral forests you can imagine, and blue are very low carbon stocks. And let me tell you, Peru alone is an amazing place, totally unknown in terms of its carbon geography until today. We can fly to this area in northern Peru and see super high carbon stocks in red, and the Amazon River and floodplain cutting right through it. We can go to an area of utter devastation caused by deforestation in blue, and the virus of deforestation spreading out in orange. We can also fly to the southern Andes to see the tree line and see exactly how the carbon geography ends as we go up into the mountain system. And we can go to the biggest swamp in the western Amazon. It's a watery dreamworld akin to Jim Cameron's "Avatar." We can go to one of the smallest tropical countries, Panama, and see also a huge range of carbon variation, from high in red to low in blue. Unfortunately, most of the carbon is lost in the lowlands, but what you see that's left, in terms of high carbon stocks in greens and reds, is the stuff that's up in the mountains. One interesting exception to this is right in the middle of your screen. You're seeing the buffer zone around the Panama Canal. That's in the reds and yellows. The canal authorities are using force to protect their watershed and global commerce. This kind of carbon mapping has transformed conservation and resource policy development. It's really advancing our ability to save forests and to curb climate change.
We gebruiken deze techniek om de eerste koolstofkaarten te maken in hoge resolutie van afgelegen gebieden als het Amazonebekken en plekken dichtbij, zoals de VS en Midden-Amerika. Ik neem je mee op een hoge-resolutie-tocht naar de koolstoflandschappen in Peru en Panama. De kleuren gaan van rood naar blauw. Rood zijn de extreem grote koolstofvoorraden van de grootste bossen die er zijn, en blauw is een kleine koolstofvoorraad. Alleen al Peru is een geweldige plek, tot nu toe onbekend op gebied van koolstofgeografie, In noordelijk Peru zien we grote voorraden koolstof in het rood, en de Amazone en uiterwaarden die er dwars doorheen snijden. Dit blauwe gebied is door ontbossing volledig verwoest. Het ontbossingsvirus waaiert uit in oranje. In de zuidelijke Andes zien we precies waar de koolstof stopt als we het berggebied ingaan. Het grootste moeras van de westelijke Amazone, is een droomwereld van water zoals in 'Avatar' van Jim Cameron. We gaan nu naar een van de kleinste tropische landen, Panama, en dan zien we een enorme variatie aan koolstof. Rood is veel en blauw is weinig. Het verlies aan koolstof is het grootst in het laagland. Maar wat overblijft, zijn hoge koolstof voorraden, in rood en groen, in de bergen. Eén interessante uitzondering, midden in beeld, is het buffergebied rond het Panamakanaal, hier in rood en geel. De kanaalautoriteiten gebruiken geweld om hun waterscheiding en de wereldwijde handel te beschermen Dit soort koolstofcartografie heeft de natuurbescherming en de ontwikkeling van onderzoeksbeleid veranderd. Het maakt het beschermen van bossen makkelijker en ook het ombuigen van de klimaatsverandering.
My second question: How do we prepare for climate change in a place like the Amazon rainforest? Let me tell you, I spend a lot of time in these places, and we're seeing the climate changing already. Temperatures are increasing, and what's really happening is we're getting a lot of droughts, recurring droughts. The 2010 mega-drought is shown here with red showing an area about the size of Western Europe. The Amazon was so dry in 2010 that even the main stem of the Amazon river itself dried up partially, as you see in the photo in the lower portion of the slide. What we found is that in very remote areas, these droughts are having a big negative impact on tropical forests. For example, these are all of the dead trees in red that suffered mortality following the 2010 drought. This area happens to be on the border of Peru and Brazil, totally unexplored, almost totally unknown scientifically.
Mijn tweede vraag: hoe bereiden we ons voor op klimaatsverandering in het regenwoud van de Amazone? Ik ben daar vaak geweest en we zien al een verandering. Het wordt warmer en we krijgen ook meer droogtes, terugkerende droogtes. Hier zie je de grote droogte van 2010. Dit rode gebied is zo groot als West-Europa. De Amazone was in 2010 zo droog dat zelfs de hoofdstroom van de rivier zelf gedeeltelijk droogviel, zoals op deze foto onderaan. We zagen dat op ver afgelegen plekken deze droogtes grote negatieve invloed hebben op tropische bossen. Hier in het rood zijn bijvoorbeeld de bomen die door de droogte van 2010 zijn doodgegaan Dit gebied ligt toevallig op de grens van Peru en Brazilië, niet onderzocht, wetenschappelijk onbekend. Onze visie als aardwetenschappers is
So what we think, as Earth scientists, is species are going to have to migrate with climate change from the east in Brazil all the way west into the Andes and up into the mountains in order to minimize their exposure to climate change. One of the problems with this is that humans are taking apart the western Amazon as we speak. Look at this 100-square-kilometer gash in the forest created by gold miners. You see the forest in green in 3D, and you see the effects of gold mining down below the soil surface. Species have nowhere to migrate in a system like this, obviously.
dat de soorten moeten gaan migreren met klimaatverandering in Oost-Brazilië naar het westen in de Andes en dan de bergen in om zo weinig mogelijk last te hebben van klimaatverandering. Het probleem is dat mensen de westelijke Amazone vernietigen. Kijk eens naar deze wond die door gouddelvers in het bos is gemaakt. Je ziet in groen het bos in 3D, en je ziet het effect van gouddelven diep onder het oppervlak. Soorten kunnen nergens heen in dit soort systemen Ga naar de Amazone als je er nog niet bent geweest.
If you haven't been to the Amazon, you should go. It's an amazing experience every time, no matter where you go. You're going to probably see it this way, on a river. But what happens is a lot of times the rivers hide what's really going on back in the forest itself. We flew over this same river, imaged the system in 3D. The forest is on the left. And then we can digitally remove the forest and see what's going on below the canopy. And in this case, we found gold mining activity, all of it illegal, set back away from the river's edge, as you'll see in those strange pockmarks coming up on your screen on the right. Don't worry, we're working with the authorities to deal with this and many, many other problems in the region.
Het is elke keer een geweldige ervaring, waar je ook gaat. Je zult het waarschijnlijk zo zien: op een rivier. Maar vaak gebeurt verbergt de rivier wat er echt gebeurt diep in het woud. We zijn over deze rivier gevlogen, en hebben het in 3D opgenomen. Het bos is links. Dan kunnen we digitaal het bos weghalen en zien wat onder het bladerdak gebeurt. Hier vonden we goudwinningsactiviteiten, allemaal illegaal, ver weg van de rivieroever, zoals je ziet in die vreemde putten rechts in beeld. Maak je geen zorgen, we werken met de autoriteiten om dit soort problemen aan te pakken in dit gebied.
So in order to put together a conservation plan for these unique, important corridors like the western Amazon and the Andes Amazon corridor, we have to start making geographically explicit plans now. How do we do that if we don't know the geography of biodiversity in the region, if it's so unknown to science? So what we've been doing is using the laser-guided spectroscopy from the CAO to map for the first time the biodiversity of the Amazon rainforest. Here you see actual data showing different species in different colors. Reds are one type of species, blues are another, and greens are yet another. And when we take this together and scale up to the regional level, we get a completely new geography of biodiversity unknown prior to this work. This tells us where the big biodiversity changes occur from habitat to habitat, and that's really important because it tells us a lot about where species may migrate to and migrate from as the climate shifts. And this is the pivotal information that's needed by decision makers to develop protected areas in the context of their regional development plans.
Om nu een beschermingsplan in elkaar te zetten voor deze unieke, belangrijke gebieden zoals de West-Amazone en het Andes-Amazonegebied, moeten we concrete plannen gaan maken. Maar hoe kan dat als je niets weet van de geografie en biodiversiteit in het gebied? We gebruiken de lasergeleide spectroscoop van de CAO om voor het eerst de biodiversiteit in kaart te brengen van het regenwoud in het Amazonegebied. Dit zijn daadwerkelijke gegevens met verschillende soorten in verschillende kleuren. Rood is één soort, blauw een andere, en groen weer een andere. Als we dit opschalen naar regionaal niveau, krijgen we een geheel nieuwe kaart met een biodiversiteit die tot nu toe onbekend was. Het zegt ons waar de biodiversiteit verandert tussen de leefgebieden, en dat is erg belangrijk want dat zegt veel over waar de soorten naartoe gaan als het klimaat verandert. Dat is juist de centrale informatie die nodig is om beschermde gebieden te ontwikkelen binnen de regionale ontwikkelingsplannen. De derde en laatste vraag is:
And third and final question is, how do we manage biodiversity on a planet of protected ecosystems? The example I started out with about lions hunting, that was a study we did behind the fence line of a protected area in South Africa. And the truth is, much of Africa's nature is going to persist into the future in protected areas like I show in blue on the screen. This puts incredible pressure and responsibility on park management. They need to do and make decisions that will benefit all of the species that they're protecting. Some of their decisions have really big impacts. For example, how much and where to use fire as a management tool? Or, how to deal with a large species like elephants, which may, if their populations get too large, have a negative impact on the ecosystem and on other species. And let me tell you, these types of dynamics really play out on the landscape. In the foreground is an area with lots of fire and lots of elephants: wide open savanna in blue, and just a few trees. As we cross this fence line, now we're getting into an area that has had protection from fire and zero elephants: dense vegetation, a radically different ecosystem. And in a place like Kruger, the soaring elephant densities are a real problem. I know it's a sensitive issue for many of you, and there are no easy answers with this. But what's good is that the technology we've developed and we're working with in South Africa, for example, is allowing us to map every single tree in the savanna, and then through repeat flights we're able to see which trees are being pushed over by elephants, in the red as you see on the screen, and how much that's happening in different types of landscapes in the savanna. That's giving park managers a very first opportunity to use tactical management strategies that are more nuanced and don't lead to those extremes that I just showed you. So really, the way we're looking at protected areas nowadays is to think of it as tending to a circle of life, where we have fire management, elephant management, those impacts on the structure of the ecosystem, and then those impacts affecting everything from insects up to apex predators like lions.
hoe gaan we om met de biodiversiteit op onze planeet met beschermde ecosystemen? Het voorbeeld waar ik mee ben begonnen over de leeuwen was een onderzoek dat we deden in een beschermd omheind gebied in Zuid-Afrika. De waarheid is dat veel van de natuur in Afrika beschermd gebied zal zijn zoals te zien in blauw op het scherm. Dat legt grote druk en verantwoordelijkheid op het management van het park. Zij moeten beslissingen nemen die voor alle soorten goed zijn. Sommige beslissingen hebben grote gevolgen. Waar, en hoeveel, moet bijvoorbeeld vuur worden ingezet? Of hoe gaan we om met grote dieren als olifanten die negatief kunnen werken op het ecosysteem, als de populatie te groot wordt? Dit soort bewegingen zijn goed in het landschap te merken. Op de voorgrond is een gebied met veel vuur en veel olifanten. Grote open savanne in het blauw, met maar een paar bomen. Als we het hek over gaan, dan komen we in een gebied dat werd beschermd tegen vuur, zonder olifanten: dichte vegetatie en een heel ander ecosysteem. Op een plek als het Krugerpark, is de hoeveelheid olifanten echt een probleem. Ik weet dat het een gevoelig onderwerp is, en dat er geen gemakkelijke antwoorden zijn. Maar het is goed dat we met onze technologie, waarmee we bijvoorbeeld in Zuid-Afrika werken, elke boom op de savanne in kaart brengt. Door herhaalde vluchten kunnen we zien welke bomen worden omgebogen door olifanten, rood op het scherm, en hoe vaak dat gebeurt in de verschillende type landschappen. Daarmee kan de parkbeheerder voor de eerste keer nauwkeuriger tactische strategieën bedenken, die niet leiden tot die extreme gevolgen. Tegenwoordig kijken we naar de beschermde gebieden als een soort levenscirkel, waar we vuur en olifanten managen, de gevolgen ervan op het ecosysteem, en op alle andere soorten, van insecten tot topjagers als leeuwen.
Going forward, I plan to greatly expand the airborne observatory. I'm hoping to actually put the technology into orbit so we can manage the entire planet with technologies like this. Until then, you're going to find me flying in some remote place that you've never heard of. I just want to end by saying that technology is absolutely critical to managing our planet, but even more important is the understanding and wisdom to apply it.
Ik ben van plan om de vluchten met de CAO uit te breiden. Ik hoop de technologie in een baan om de aarde te krijgen zodat we de hele planeet kunnen beheren met dit soort technologieën. Tot die tijd zul je me vinden boven gebieden waar je nog nooit van hoorde. Tot slot wil ik zeggen dat technologie van levensbelang is om de aarde in stand te houden maar nog belangrijker is de wijsheid om ze toe te passen.
Thank you.
Dank je wel.
(Applause)
(Applaus)