Technology can change our understanding of nature.
La tecnologia può cambiare la nostra comprensione della natura.
Take for example the case of lions. For centuries, it's been said that female lions do all of the hunting out in the open savanna, and male lions do nothing until it's time for dinner. You've heard this too, I can tell. Well recently, I led an airborne mapping campaign in the Kruger National Park in South Africa. Our colleagues put GPS tracking collars on male and female lions, and we mapped their hunting behavior from the air. The lower left shows a lion sizing up a herd of impala for a kill, and the right shows what I call the lion viewshed. That's how far the lion can see in all directions until his or her view is obstructed by vegetation. And what we found is that male lions are not the lazy hunters we thought them to be. They just use a different strategy. Whereas the female lions hunt out in the open savanna over long distances, usually during the day, male lions use an ambush strategy in dense vegetation, and often at night. This video shows the actual hunting viewsheds of male lions on the left and females on the right. Red and darker colors show more dense vegetation, and the white are wide open spaces. And this is the viewshed right literally at the eye level of hunting male and female lions. All of a sudden, you get a very clear understanding of the very spooky conditions under which male lions do their hunting.
Prendete ad esempio i leoni. Per secoli si è detto che le leonesse si occupano interamente della caccia nella savana e che i leoni non fanno nulla fino all'ora di cena. Sono sicuro che ne avete sentito parlare anche voi. Beh, recentemente ho condotto una campagna di mappatura aerea nel parco nazionale Kruger in Sudafrica. I nostri colleghi hanno messo dei collari GPS a leoni e leonesse e abbiamo mappato il loro comportamento di caccia dall'alto. In basso a sinistra si vede un leone che tiene d'occhio un branco di impala per cacciarli e a destra si può vedere quello che io chiamo la visuale del leone. E cioè quanto lontano può vedere il leone in tutte le direzioni finché la vista non viene ostruita dalla vegetazione. E quello che abbiamo scoperto è che i leoni non sono i cacciatori pigri che pensavamo fossero. Usano semplicemente una strategia diversa. Mentre le leonesse cacciano in aperta savana su lunghe distanze, di solito durante il giorno, i leoni usano la strategia dell'agguato nella vegetazione più fitta e spesso di notte. Questo video mostra la vera visuale di caccia dei leoni a sinistra e delle leonesse a destra. Il rosso e i colori più scuri mostrano la vegetazione fitta, e il bianco gli spazi aperti. E questa è la visuale proprio a livello degli occhi dei leoni e delle leonesse durante la caccia. Improvvisamente si ha un'idea molto chiara delle condizioni terribili nelle quali cacciano i leoni.
I bring up this example to begin, because it emphasizes how little we know about nature. There's been a huge amount of work done so far to try to slow down our losses of tropical forests, and we are losing our forests at a rapid rate, as shown in red on the slide. I find it ironic that we're doing so much, yet these areas are fairly unknown to science. So how can we save what we don't understand?
Faccio quest'esempio per iniziare, perché enfatizza quanto poco sappiamo della natura. Finora è stata fatta una enorme quantità di lavoro per cercare di contenere la perdita delle foreste tropicali, e stiamo perdendo le nostre foreste velocemente, come mostrato in rosso nella diapositiva. Trovo ironico che stiamo facendo così tanto, e malgrado tutto queste aree restano quasi sconosciute alla scienza. Come possiamo dunque salvare ciò che non capiamo?
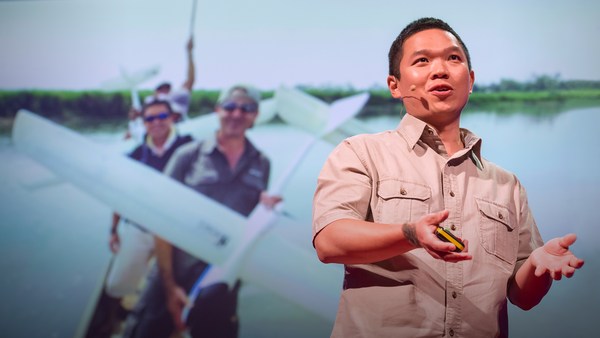
Now I'm a global ecologist and an Earth explorer with a background in physics and chemistry and biology and a lot of other boring subjects, but above all, I'm obsessed with what we don't know about our planet. So I created this, the Carnegie Airborne Observatory, or CAO. It may look like a plane with a fancy paint job, but I packed it with over 1,000 kilos of high-tech sensors, computers, and a very motivated staff of Earth scientists and pilots. Two of our instruments are very unique: one is called an imaging spectrometer that can actually measure the chemical composition of plants as we fly over them. Another one is a set of lasers, very high-powered lasers, that fire out of the bottom of the plane, sweeping across the ecosystem and measuring it at nearly 500,000 times per second in high-resolution 3D. Here's an image of the Golden Gate Bridge in San Francisco, not far from where I live. Although we flew straight over this bridge, we imaged it in 3D, captured its color in just a few seconds. But the real power of the CAO is its ability to capture the actual building blocks of ecosystems. This is a small town in the Amazon, imaged with the CAO. We can slice through our data and see, for example, the 3D structure of the vegetation and the buildings, or we can use the chemical information to actually figure out how fast the plants are growing as we fly over them. The hottest pinks are the fastest-growing plants. And we can see biodiversity in ways that you never could have imagined. This is what a rainforest might look like as you fly over it in a hot air balloon. This is how we see a rainforest, in kaleidoscopic color that tells us that there are many species living with one another. But you have to remember that these trees are literally bigger than whales, and what that means is that they're impossible to understand just by walking on the ground below them. So our imagery is 3D, it's chemical, it's biological, and this tells us not only the species that are living in the canopy, but it tells us a lot of information about the rest of the species that occupy the rainforest.
Sono un ecologista globale ed un esploratore della Terra con conoscenze in fisica, in chimica in biologia ed in molte altre noiose materie, ma sono soprattutto ossessionato da quello che non conosciamo del nostro pianeta. Quindi ho creato questo: Il CAO, Osservatorio Aereo Carnegie. Può sembrare un aereo dipinto molto bene ma l'ho riempito con oltre 1000 kg di sensori ad alta tecnologia, computer, ed uno staff molto motivato di scienziati della Terra e piloti. Due dei nostri strumenti sono davvero unici: uno si chiama spettrometro ad immagini che può misurare la composizione chimica delle piante mentre le sorvoliamo. L'altro è un insieme di laser laser ad alta potenza, che vengono sparati dalla coda dell'aereo, estendendosi sull'ecosistema e misurandolo quasi 500 000 volte al secondo in 3D ad alta risoluzione. Ecco un'immagine del Golden Gate Bridge a San Francisco, non lontano da dove vivo. Sebbene abbiamo sorvolato il ponte, l'abbiamo fotografato in 3D, catturandone i colori in solo pochi secondi. Ma la vera potenza del CAO è la sua abilità di catturare veri e propri blocchi di ecosistemi. Questo è un piccolo paese in Amazzonia, fotografato con il CAO. Possiamo dividere i dati in porzioni e osservare, ad esempio, la struttura in 3D della vegetazione e degli edifici, oppure possiamo usare le informazioni chimiche per capire davvero quanto velocemente crescano le piante mentre le sorvoliamo. In rosa più scuro abbiamo le piante che crescono più velocemente Possiamo osservare la biodiversità in modi che non avreste potuto mai immaginare. Ecco come potrebbe apparire una foresta pluviale mentre la si sorvola in mongolfiera. Questo è come vediamo una foresta pluviale, con colori caleidoscopici che ci dicono che ci sono molte specie che vivono l'una con l'altra. Ma bisogna ricordare che questi alberi sono letteralmente più grandi di una balena, e ciò vuol dire che sono impossibili da studiare semplicemente camminando sul terreno sotto di loro. Le nostre immagini sono in 3D, sono chimiche, sono biologiche, e questo ci dice non solo quali specie vivono all'interno dell'albero, ma ci dà anche molte informazioni riguardanti le altre specie che occupano la foresta pluviale.
Now I created the CAO in order to answer questions that have proven extremely challenging to answer from any other vantage point, such as from the ground, or from satellite sensors. I want to share three of those questions with you today. The first questions is, how do we manage our carbon reserves in tropical forests? Tropical forests contain a huge amount of carbon in the trees, and we need to keep that carbon in those forests if we're going to avoid any further global warming. Unfortunately, global carbon emissions from deforestation now equals the global transportation sector. That's all ships, airplanes, trains and automobiles combined. So it's understandable that policy negotiators have been working hard to reduce deforestation, but they're doing it on landscapes that are hardly known to science. If you don't know where the carbon is exactly, in detail, how can you know what you're losing? Basically, we need a high-tech accounting system. With our system, we're able to see the carbon stocks of tropical forests in utter detail. The red shows, obviously, closed-canopy tropical forest, and then you see the cookie cutting, or the cutting of the forest in yellows and greens. It's like cutting a cake except this cake is about whale deep. And yet, we can zoom in and see the forest and the trees at the same time. And what's amazing is, even though we flew very high above this forest, later on in analysis, we can go in and actually experience the treetrops, leaf by leaf, branch by branch, just as the other species that live in this forest experience it along with the trees themselves.
Ho creato il CAO per provare a rispondere a domande che si sono rivelate estremamente difficili a cui rispondere, da ogni altro punto di vista, come ad esempio da terra o attraverso sensori satellitari. Oggi voglio condividere con voi tre di quelle domande. La prima domanda è: "Come gestiamo le riserve di carbonio nelle foreste tropicali?" Gli alberi nelle foreste tropicali contengono una quantità enorme di carbonio ed è necessario che quel carbonio resti dov'è se vogliamo evitare un ulteriore riscaldamento globale. Sfortunatamente, le emissioni globali di carbonio derivanti dalla deforestazione eguagliano oggi quelle del settore dei trasporti. E cioè di tutte le navi, gli aerei, i treni e le automobili messi insieme. È quindi comprensibile che le autorità abbiano lavorato duramente per ridurre la deforestazione, ma lo stanno facendo in zone che sono quasi sconosciute alla scienza. Se non si sa dove si trova esattamente il carbonio come si può sapere nel dettaglio cosa stiamo perdendo? Sostanzialmente, c'è bisogno di un sistema di verifica ad alta tecnologia. Con il nostro sistema, possiamo osservare dettagliatamente le riserve di carbonio delle foreste tropicali. Il rosso mostra, ovviamente, le foreste tropicali a volta chiusa, e poi si vede il lavoro industriale, della deforestazione, nelle parti gialle e verdi. È come tagliare una torta, solo che quest'ultima ha uno spessore notevole. Tuttavia, riusciamo ad ingrandire e vedere allo stesso tempo la foresta e gli alberi. La cosa formidabile è che, anche se abbiamo sorvolato la foresta da molto in alto successivamente possiamo addentrarci in fase di analisi e vedere realmente le cime degli alberi, foglia per foglia, ramo per ramo, proprio come le altre specie che vivono nella foresta lo fanno insieme agli stessi alberi.
We've been using the technology to explore and to actually put out the first carbon geographies in high resolution in faraway places like the Amazon Basin and not-so-faraway places like the United States and Central America. What I'm going to do is I'm going to take you on a high-resolution, first-time tour of the carbon landscapes of Peru and then Panama. The colors are going to be going from red to blue. Red is extremely high carbon stocks, your largest cathedral forests you can imagine, and blue are very low carbon stocks. And let me tell you, Peru alone is an amazing place, totally unknown in terms of its carbon geography until today. We can fly to this area in northern Peru and see super high carbon stocks in red, and the Amazon River and floodplain cutting right through it. We can go to an area of utter devastation caused by deforestation in blue, and the virus of deforestation spreading out in orange. We can also fly to the southern Andes to see the tree line and see exactly how the carbon geography ends as we go up into the mountain system. And we can go to the biggest swamp in the western Amazon. It's a watery dreamworld akin to Jim Cameron's "Avatar." We can go to one of the smallest tropical countries, Panama, and see also a huge range of carbon variation, from high in red to low in blue. Unfortunately, most of the carbon is lost in the lowlands, but what you see that's left, in terms of high carbon stocks in greens and reds, is the stuff that's up in the mountains. One interesting exception to this is right in the middle of your screen. You're seeing the buffer zone around the Panama Canal. That's in the reds and yellows. The canal authorities are using force to protect their watershed and global commerce. This kind of carbon mapping has transformed conservation and resource policy development. It's really advancing our ability to save forests and to curb climate change.
Abbiamo usato questa tecnologia per esplorare e per pubblicare le prime mappe del carbonio ad alta risoluzione in posti lontani come il Bacino Amazzonico e meno lontani come gli Stati Uniti e l'America Centrale. Adesso vi farò fare, per la prima volta, un giro ad alta risoluzione delle riserve di carbonio del Perù e poi di Panama. I colori andranno dal rosso al blu. Il rosso rappresenta concentrazioni di carbonio estremamente alte, le più alte ed estese foreste che possiate immaginare, mentre il blu indica riserve di carbonio molto basse. Lasciatemelo dire, il Perù è un posto meraviglioso completamente sconosciuto in termini di geografia del carbonio fino a oggi. Possiamo spostarci su quest'area nel nord del Perù ed osservare riserve di carbonio altissime in rosso, il Rio delle Amazzoni e la piana alluvionale che la attraversano. Possiamo andare in un'area di totale devastazione causata dalla deforestazione in blu, e vedere in arancione la deforestazione che si propaga. Possiamo anche andare nel sud delle Ande ad osservare il limite della vegetazione e vedere esattamente come termina la geografia del carbonio man mano che ci addentriamo nella parte montuosa. Possiamo andare verso la più grande palude nell'Amazzonia occidentale. È un paradiso acquatico simile ad "Avatar" di Jim Cameron. Possiamo andare in uno dei paesi tropicali più piccoli, come Panama, e notare un'enorme gamma di variazioni del carbonio, da alto in rosso a basso in blu. Sfortunatamente, la maggior parte del carbonio si perde nelle pianure, ma ciò che resta, come vedete, in termini di alte riserve di carbonio in verde e rosso, è quello che si trova sulle montagne. Un'eccezione interessante si trova proprio al centro del vostro schermo. State vedendo la zona cuscinetto attorno al Canale di Panama. È quella in rosso ed in giallo. La autorità del Canale stanno usando la forza per proteggere il loro spartiacque ed il commercio globale. Questo tipo di mappatura del carbonio ha trasformato la conservazione e lo sviluppo delle politiche di gestione delle risorse. Sta facendo progredire la nostra abilità di salvare le foreste e di limitare i cambi climatici.
My second question: How do we prepare for climate change in a place like the Amazon rainforest? Let me tell you, I spend a lot of time in these places, and we're seeing the climate changing already. Temperatures are increasing, and what's really happening is we're getting a lot of droughts, recurring droughts. The 2010 mega-drought is shown here with red showing an area about the size of Western Europe. The Amazon was so dry in 2010 that even the main stem of the Amazon river itself dried up partially, as you see in the photo in the lower portion of the slide. What we found is that in very remote areas, these droughts are having a big negative impact on tropical forests. For example, these are all of the dead trees in red that suffered mortality following the 2010 drought. This area happens to be on the border of Peru and Brazil, totally unexplored, almost totally unknown scientifically.
La mia seconda domanda è: "Come ci si prepara ai cambiamenti climatici in un luogo come la foresta pluviale dell'Amazzonia?" Vi posso dire che passo molto tempo in questi posti e stiamo già notando dei cambiamenti nel clima. Le temperature aumentano, e ciò che ne deriva sono abbondanti periodi di siccità, siccità ricorrenti. Qui vi viene mostrata la mega-siccità del 2010 in rosso è evidenziata un'area grande quanto l'Europa occidentale L'Amazzonia era talmente arida nel 2010 che anche il braccio principale dello stesso Rio delle Amazzoni si è prosciugato parzialmente, come vedete nella foto nella parte bassa della diapositiva. Abbiamo scoperto che in aree molto remote, queste siccità stanno avendo un forte impatto negativo sulle foreste tropicali. Ad esempio, questi in rosso sono tutti gli alberi che sono morti dopo la siccità del 2010. Quest'area è al confine tra Perù e Brasile, totalmente inesplorata, quasi del tutto scientificamente sconosciuta.
So what we think, as Earth scientists, is species are going to have to migrate with climate change from the east in Brazil all the way west into the Andes and up into the mountains in order to minimize their exposure to climate change. One of the problems with this is that humans are taking apart the western Amazon as we speak. Look at this 100-square-kilometer gash in the forest created by gold miners. You see the forest in green in 3D, and you see the effects of gold mining down below the soil surface. Species have nowhere to migrate in a system like this, obviously.
Quindi, la nostra opinione in quanto scienziati della Terra, è che le specie dovranno migrare col cambiamento climatico da est in Brasile verso ovest fino alle Ande e su per le montagne così da minimizzare la propria esposizione ai cambiamenti climatici. Uno dei problemi causati da tutto ciò è che gli uomini stanno smembrando l'Amazzonia occidentale mentre stiamo parlando. Guardate questa ferita di 100 km quadrati creata nella foresta da minatori d'oro. Vedete la foresta in verde in 3D, e vedete gli effetti dell'estrazione dell'oro in basso sotto la superficie. Chiaramente, le specie non hanno posti dove migrare in un sistema simile.
If you haven't been to the Amazon, you should go. It's an amazing experience every time, no matter where you go. You're going to probably see it this way, on a river. But what happens is a lot of times the rivers hide what's really going on back in the forest itself. We flew over this same river, imaged the system in 3D. The forest is on the left. And then we can digitally remove the forest and see what's going on below the canopy. And in this case, we found gold mining activity, all of it illegal, set back away from the river's edge, as you'll see in those strange pockmarks coming up on your screen on the right. Don't worry, we're working with the authorities to deal with this and many, many other problems in the region.
Se non siete stati in Amazzonia, dovreste andarci. Ogni volta è un'esperienza incredibile, ovunque andiate. Probabilmente la vedrete così, da un fiume. Ma come accade molte volte il fiume nasconde quello che succede veramente all'interno nella foresta. Abbiamo volato sullo stesso fiume, fotografandolo in 3D. La foresta è a sinistra. Quindi possiamo rimuovere digitalmente la foresta e vedere cosa succede sotto la volta. Ed in questo caso abbiamo trovato attività estrattiva dell'oro, completamente illegale, lontana dalla riva del fiume, come vedete in quelle strane macchie che appaiono sulla destra dello schermo. Non vi preoccupate, stiamo lavorando con le autorità per risolvere questo e molti, molti altri problemi nella regione.
So in order to put together a conservation plan for these unique, important corridors like the western Amazon and the Andes Amazon corridor, we have to start making geographically explicit plans now. How do we do that if we don't know the geography of biodiversity in the region, if it's so unknown to science? So what we've been doing is using the laser-guided spectroscopy from the CAO to map for the first time the biodiversity of the Amazon rainforest. Here you see actual data showing different species in different colors. Reds are one type of species, blues are another, and greens are yet another. And when we take this together and scale up to the regional level, we get a completely new geography of biodiversity unknown prior to this work. This tells us where the big biodiversity changes occur from habitat to habitat, and that's really important because it tells us a lot about where species may migrate to and migrate from as the climate shifts. And this is the pivotal information that's needed by decision makers to develop protected areas in the context of their regional development plans.
Per mettere insieme un progetto di conservazione per questi importanti ed unici corridoi come l'Amazzonia occidentale ed il corridoio tra Ande ed Amazzonia, dobbiamo iniziare a creare ora progetti geograficamente dettagliati. Come possiamo farlo se non conosciamo la geografia della biodiversità nella regione, se è sconosciuta alla scienza? Quello che abbiamo fatto è usare la spettroscopia a guida laser del CAO per mappare per la prima volta la biodiversità della foresta pluviale amazzonica. Qui vedete i dati che mostrano differenti specie in diversi colori. I rossi sono una specie, i blu un'altra, ed i verdi un'altra ancora. E quando mettiamo tutto insieme e lo portiamo ad una scala regionale, otteniamo una geografia totalmente nuova della biodiversità, che prima era sconosciuta. Questo ci dice dove i grandi mutamenti della biodiversità avvengono da habitat ad habitat, e questo è davvero importante perché ci dice molto verso dove le specie possono migrare e da dove possono migrare quando cambia il clima. E questa è l'informazione fondamentale che serve ai politici per sviluppare le aree protette nel contesto dei loro progetti di sviluppo regionali.
And third and final question is, how do we manage biodiversity on a planet of protected ecosystems? The example I started out with about lions hunting, that was a study we did behind the fence line of a protected area in South Africa. And the truth is, much of Africa's nature is going to persist into the future in protected areas like I show in blue on the screen. This puts incredible pressure and responsibility on park management. They need to do and make decisions that will benefit all of the species that they're protecting. Some of their decisions have really big impacts. For example, how much and where to use fire as a management tool? Or, how to deal with a large species like elephants, which may, if their populations get too large, have a negative impact on the ecosystem and on other species. And let me tell you, these types of dynamics really play out on the landscape. In the foreground is an area with lots of fire and lots of elephants: wide open savanna in blue, and just a few trees. As we cross this fence line, now we're getting into an area that has had protection from fire and zero elephants: dense vegetation, a radically different ecosystem. And in a place like Kruger, the soaring elephant densities are a real problem. I know it's a sensitive issue for many of you, and there are no easy answers with this. But what's good is that the technology we've developed and we're working with in South Africa, for example, is allowing us to map every single tree in the savanna, and then through repeat flights we're able to see which trees are being pushed over by elephants, in the red as you see on the screen, and how much that's happening in different types of landscapes in the savanna. That's giving park managers a very first opportunity to use tactical management strategies that are more nuanced and don't lead to those extremes that I just showed you. So really, the way we're looking at protected areas nowadays is to think of it as tending to a circle of life, where we have fire management, elephant management, those impacts on the structure of the ecosystem, and then those impacts affecting everything from insects up to apex predators like lions.
La terza ed ultima domanda è: "Come gestiamo la biodiversità su un pianeta di ecosistemi protetti?" L'esempio con cui ho iniziato sulla caccia dei leoni era uno studio che avevamo effettuato dietro la recinzione di un'area protetta in Sudafrica. La verità è che gran parte della natura dell'Africa persisterà nel futuro in aree protette come quella in blu sullo schermo. Questo pone un'incredibile pressione e responsabilità su chi gestisce i parchi. Devono fare e prendere decisioni da cui beneficeranno tutte le specie che stanno proteggendo. Alcune delle loro decisioni hanno davvero un grande impatto. Ad esempio, quanto e dove usare il fuoco come strumento di gestione? Oppure, come approcciare grandi specie come gli elefanti che possono avere un impatto negativo sull'ecosistema diventa troppo grande, e su altre specie se la popolazione è troppo grande. E, lasciatemelo dire, questo tipo di dinamiche davvero si sviluppano sul territorio. In primo piano c'è un'area con molti fuochi e molti elefanti: la savana aperta in blu, e solo qualche albero. Attraversando la recinzione, si entra in un'area che è stata protetta dal fuoco e zero elefanti: vegetazione densa, un ecosistema radicalmente diverso. In un posto come il Parco Kruger, la densità crescente degli elefanti è un problema reale. Lo so che è un argomento sensibile per molti di voi, e che non ci sono facili risposte per questo. Ma il lato positivo è che la tecnologia che abbiamo sviluppato e con cui stiamo lavorando in Sudafrica, per esempio, ci permette di mappare ogni singolo albero nella savana, e quindi attraverso voli ripetuti possiamo vedere quali alberi stanno per essere spazzati via dagli elefanti. nel rosso come vedete sullo schermo, e quanto sta avvenendo in diversi tipi di paesaggio nella savana. Questo sta dando ai gestori dei parchi una prima opportunità per usare strategie di gestione a breve termine più morbide che non portano agli estremi che vi ho mostrato. Davvero, il modo in cui guardiamo alle aree protette oggigiorno è di pensarle come ad un cerchio della vita dove c'è la gestione degli incendi, la gestione degli elefanti, gli impatti sulla struttura dell'ecosistema e poi quegli impatti che influiscono su tutto, dagli insetti fino all'apice dei predatori, come i leoni.
Going forward, I plan to greatly expand the airborne observatory. I'm hoping to actually put the technology into orbit so we can manage the entire planet with technologies like this. Until then, you're going to find me flying in some remote place that you've never heard of. I just want to end by saying that technology is absolutely critical to managing our planet, but even more important is the understanding and wisdom to apply it.
Guardando avanti, sto pianificando di espandere molto l'osservatorio areo. Spero di riuscire a mettere la tecnologia in orbita così da gestire l'intero pianeta con tecnologie come questa. Fino ad allora, mi troverete a volare in qualche posto sperduto di cui non avete mai sentito parlare. Voglio solo finire dicendo che la tecnologia è assolutamente critica per gestire il nostro pianeta, ma ancora più importante è la capacità e la saggezza per applicarla.
Thank you.
Grazie.
(Applause)
(Applausi)