Technology can change our understanding of nature.
טכנולוגיה יכולה לשנות את הדרך בה אנחנו מבינים את הטבע.
Take for example the case of lions. For centuries, it's been said that female lions do all of the hunting out in the open savanna, and male lions do nothing until it's time for dinner. You've heard this too, I can tell. Well recently, I led an airborne mapping campaign in the Kruger National Park in South Africa. Our colleagues put GPS tracking collars on male and female lions, and we mapped their hunting behavior from the air. The lower left shows a lion sizing up a herd of impala for a kill, and the right shows what I call the lion viewshed. That's how far the lion can see in all directions until his or her view is obstructed by vegetation. And what we found is that male lions are not the lazy hunters we thought them to be. They just use a different strategy. Whereas the female lions hunt out in the open savanna over long distances, usually during the day, male lions use an ambush strategy in dense vegetation, and often at night. This video shows the actual hunting viewsheds of male lions on the left and females on the right. Red and darker colors show more dense vegetation, and the white are wide open spaces. And this is the viewshed right literally at the eye level of hunting male and female lions. All of a sudden, you get a very clear understanding of the very spooky conditions under which male lions do their hunting.
בואו נדבר לדוגמה על האריות. במשך מאות שנים, האמנו שלביאות מבצעות את כל הציד בסוואנה, בעוד האריות הזכרים עצלנים, ומשתתפים רק בארוחות. גם אתם שמעתם על זה, אני בטוח. אבל לאחרונה, הובלתי תהליך של מיפוי שטח מוטס בפרק הלאומי קרוגר בדרום אפריקה. השותפים שלנו התקינו קולרים עם GPS על אריות ולביאות, ועקבנו אחרי הרגלי הציד שלהם מהאוויר. משמאל למטה ניתן לראות אריה מנסה להעריך את הגודל של עדר אימפלות לקראת הציד. מימין רואים את מה שאני מכנה מסתור התצפית של האריות. תראו לאיזה מרחק האריה יכול לראות מכל כיוון עד שהצמחייה מסתירה את הפרטים. אנחנו גילינו שהאריות הזכרים אינם הציידים העצלנים שחשבנו שהם. הם פשוט משתמשים באסטרטגיה שונה. בזמן שהלביאות צדות בשטחי הסוואנה הפתוחים על פני מרחקים עצומים, בד"כ בשעות האור, האריות בד"כ אורבים לטרף בתוך צמחיה עבותה, לרוב בשעות החשיכה. בסרטון הבא נראה את מסתור התצפית האמיתי של אריה זכר משמאל ושל לביאה מימין. האזורים המסומנים באדום ובצבעים כהים מסמלים צמחיה עבותה, והאזורים המסומנים בלבן מסמלים שטחים פתוחים. וזו תמונה מתוך מסתור התצפית בגובה העיניים של אריות ולביאות. פתאום, ניתן להבין בצורה ברורה את התנאים המפחידים בהם האריות הזכרים צדים.
I bring up this example to begin, because it emphasizes how little we know about nature. There's been a huge amount of work done so far to try to slow down our losses of tropical forests, and we are losing our forests at a rapid rate, as shown in red on the slide. I find it ironic that we're doing so much, yet these areas are fairly unknown to science. So how can we save what we don't understand?
הדוגמה הראשונה של האריות, ממחישה כמה מעט אנחנו באמת יודעים על הטבע. עד כה נעשתה כמות עצומה של עבודה שמטרתה להאט את הרס היערות הטרופיים, וקצב האובדן כיום מהיר מאד, כפי שמראה לנו הסימון האדום בשקופית. אני מוצא אירוניה בעובדה שאנחנו משקיעים כל כך הרבה מאמץ, בנושאים בהם המדע מבין מעט מאד. אז איך נוכל להציל את מה שאיננו מבינים?
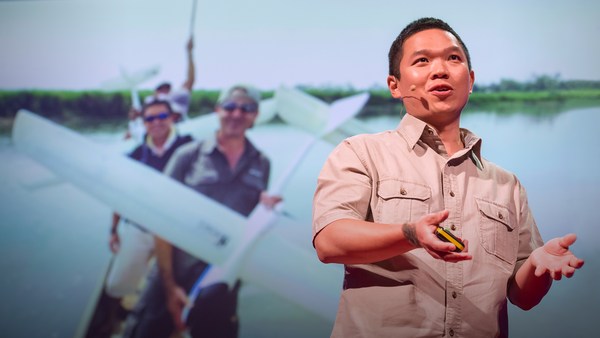
Now I'm a global ecologist and an Earth explorer with a background in physics and chemistry and biology and a lot of other boring subjects, but above all, I'm obsessed with what we don't know about our planet. So I created this, the Carnegie Airborne Observatory, or CAO. It may look like a plane with a fancy paint job, but I packed it with over 1,000 kilos of high-tech sensors, computers, and a very motivated staff of Earth scientists and pilots. Two of our instruments are very unique: one is called an imaging spectrometer that can actually measure the chemical composition of plants as we fly over them. Another one is a set of lasers, very high-powered lasers, that fire out of the bottom of the plane, sweeping across the ecosystem and measuring it at nearly 500,000 times per second in high-resolution 3D. Here's an image of the Golden Gate Bridge in San Francisco, not far from where I live. Although we flew straight over this bridge, we imaged it in 3D, captured its color in just a few seconds. But the real power of the CAO is its ability to capture the actual building blocks of ecosystems. This is a small town in the Amazon, imaged with the CAO. We can slice through our data and see, for example, the 3D structure of the vegetation and the buildings, or we can use the chemical information to actually figure out how fast the plants are growing as we fly over them. The hottest pinks are the fastest-growing plants. And we can see biodiversity in ways that you never could have imagined. This is what a rainforest might look like as you fly over it in a hot air balloon. This is how we see a rainforest, in kaleidoscopic color that tells us that there are many species living with one another. But you have to remember that these trees are literally bigger than whales, and what that means is that they're impossible to understand just by walking on the ground below them. So our imagery is 3D, it's chemical, it's biological, and this tells us not only the species that are living in the canopy, but it tells us a lot of information about the rest of the species that occupy the rainforest.
אני עוסק באקולוגיה עולמית ובחקר כדור הארץ ויש לי רקע של כימיה ופיזיקה וביולוגיה והרבה נושאים משעממים אחרים, אבל יותר מכל, אני מתעניין באופן אובססיבי בדברים שאיננו יודעים לגבי כדור הארץ. לכן הקמתי את הפרויקט הבא, המצפה האווירי של קרנגי, או CAO. נכון שהוא נראה כמו סתם מטוס עם צביעה יוקרתית, התקנו עליו יותר מ- 1,000 קילו של ציוד מתוחכם, חיישנים, מחשבים וצוות בעל מוטיבציה אדירה שמורכב מחוקרי כדור הארץ ומטייסים. אנחנו משתמשים בשני כלים מיוחדים: הראשון נקרא ספקטרומטר הדמיה והוא מודד את המבנה הכימי של הצמחייה מעליה אנחנו טסים. השני הוא מכשור לייזר, עם לייזרים בעצמה גבוהה, שמוקרנים מתחתית המטוס, וסורקים את המערכת האקולוגית על הקרקע בקצב של חצי מליון מדידות בשניה בתלת ממד ובאיכות HD. הנה תמונה של גשר שער הזהב בסאן-פרנסיסקו, ליד מקום מגורי. למרות שטסנו ישר מעל הגשר, קיבלנו תמונה תלת ממדית, בצבע מלא תוך שניות. אבל כוחו האמתי של מטוס ה- CAO טמון ביכולתו לתעד את אבני הבניין של המערכת האקולוגית. זו עיר קטנה באמזונס, כפי שהיא תועדה במערכת ה- CAO. ניתן לחתוך את המידע ולראות, לדוגמה, את המבנה התלת ממדי של צמחייה ובתים, ניתן גם להשתמש בנתונים הכימיים על מנת לחשב כמה מהר גדלה הצמחייה ממש תוך כדי הטיסה. האזורים הוורודים מראים צמחיה שגדלה מהר. וניתן לראות את המגוון הביולוגי בצורה טובה בהרבה מכל מה שיכולנו לדמיין בעבר. כך נראה יער גשם כאר טסים מעליו בכדור פורח. כך אנחנו רואים יער גשם, בצבעים רבגוניים שמראים לנו את מגוון המינים העצום שמתקיים ביער. אבל חייבים לזכור שהעצים האלו גדולים יותר מלווייתנים, והמשמעות היא שלא ניתן להבין אותם רק מכיוון הקרקע שמתחתם. לכן אנחנו משתמשים בהדמיות תלת ממד, עם ניתוח כימי וביולוגי, שמראה לנו לא רק אילו מינים חיים בצמרות העצים, אלא מספק גם מידע על שאר המינים שחיים ביער הגשם.
Now I created the CAO in order to answer questions that have proven extremely challenging to answer from any other vantage point, such as from the ground, or from satellite sensors. I want to share three of those questions with you today. The first questions is, how do we manage our carbon reserves in tropical forests? Tropical forests contain a huge amount of carbon in the trees, and we need to keep that carbon in those forests if we're going to avoid any further global warming. Unfortunately, global carbon emissions from deforestation now equals the global transportation sector. That's all ships, airplanes, trains and automobiles combined. So it's understandable that policy negotiators have been working hard to reduce deforestation, but they're doing it on landscapes that are hardly known to science. If you don't know where the carbon is exactly, in detail, how can you know what you're losing? Basically, we need a high-tech accounting system. With our system, we're able to see the carbon stocks of tropical forests in utter detail. The red shows, obviously, closed-canopy tropical forest, and then you see the cookie cutting, or the cutting of the forest in yellows and greens. It's like cutting a cake except this cake is about whale deep. And yet, we can zoom in and see the forest and the trees at the same time. And what's amazing is, even though we flew very high above this forest, later on in analysis, we can go in and actually experience the treetrops, leaf by leaf, branch by branch, just as the other species that live in this forest experience it along with the trees themselves.
עכשיו יצרתי את מערכת ה- CAO כדי לענות על שאלות שלא ניתן היה לענות עליהן מנקודות מבט אחרות, כמו מהקרקע, או מתמונות לוויין. ורציתי לדון אתכם בשלוש שאלות כאלה היום. השאלה הראשונה היא, איך צריך לנהל את עתודות הפחמן ביערות הגשם? יערות הגשם מכילים כמות עצומה של פחמן בעצים, וחשוב שנשמור על הפחמן ביערות על מנת להימנע מהמשך ההתחממות כדור הארץ. לרוע המזל, פליטות הפחמן העולמיות הנובעת מכריתת ושריפת יערות שוות כיום לפליטת הפחמן של כל מגזר התחבורה. של כל האניות, המטוסים, הרכבות והמכוניות יחד. לכן מובן שקובעי המדיניות העולמית ניסו לצמצם את כריתת היערות בכל כוחם, אבל הם פועלים בתחום שאינו מוכר כמעט למדע. אם איננו יודעים היכן בדיוק נמצא הפחמן, בפרוט רב, איך ניתן לדעת מה קצב האובדן? בעצם, אנחנו צריכים מערכת חשבונאית משוכללת. עם המערכת שלנו ניתן לראות את מאגרי הפחמן המצויים ביערות הטרופיים בפרוט רב. באדום רואים את היערות הטרופיים צפופי הצמרת, ואז ניתן לראות חורים, שמסמלים את כריתת היערות ומופיעים בצהוב וירוק. זה כמו לפרוס עוגה, אלא שעומק העוגה הזו הוא כגובה לוויתן. ובכל זאת, ניתן להתמקד ולראות גם את היער וגם את העצים בו זמנית. ומה שמדהים, זה שלמרות שטסנו גבוה מאד מעל היער, בהמשך הסקירה נוכל להיכנס ולחוות את צמרות העצים, כל עלה בנפרד, כל ענף בנפרד, ממש כמו שבעלי החיים החיים ביער חווים אותם, ממש כמו העצים עצמם.
We've been using the technology to explore and to actually put out the first carbon geographies in high resolution in faraway places like the Amazon Basin and not-so-faraway places like the United States and Central America. What I'm going to do is I'm going to take you on a high-resolution, first-time tour of the carbon landscapes of Peru and then Panama. The colors are going to be going from red to blue. Red is extremely high carbon stocks, your largest cathedral forests you can imagine, and blue are very low carbon stocks. And let me tell you, Peru alone is an amazing place, totally unknown in terms of its carbon geography until today. We can fly to this area in northern Peru and see super high carbon stocks in red, and the Amazon River and floodplain cutting right through it. We can go to an area of utter devastation caused by deforestation in blue, and the virus of deforestation spreading out in orange. We can also fly to the southern Andes to see the tree line and see exactly how the carbon geography ends as we go up into the mountain system. And we can go to the biggest swamp in the western Amazon. It's a watery dreamworld akin to Jim Cameron's "Avatar." We can go to one of the smallest tropical countries, Panama, and see also a huge range of carbon variation, from high in red to low in blue. Unfortunately, most of the carbon is lost in the lowlands, but what you see that's left, in terms of high carbon stocks in greens and reds, is the stuff that's up in the mountains. One interesting exception to this is right in the middle of your screen. You're seeing the buffer zone around the Panama Canal. That's in the reds and yellows. The canal authorities are using force to protect their watershed and global commerce. This kind of carbon mapping has transformed conservation and resource policy development. It's really advancing our ability to save forests and to curb climate change.
אנחנו משתמשים בטכנולוגיה על מנת לחקור ולתעד את המיקום הגאוגרפי של הפחמן ברזולוציה גבוהה באזורים מרוחקים כמו אגן האמזונס ובאזורים קרובים יותר כמו ארצות הברית ומרכז אמריקה. ועכשיו אני אקח אתכם לסיור ברזולוציה גבוהה, סיור ראשון בנופי הפחמן של פרו ופנמה. הצבעים ינועו בין אדום לכחול. אדום מייצג מאגרי פחמן גדולים, היער הגדול והמרשים ביותר שתוכלו לדמיין, וכחול מייצג מאגרי פחמן מדוללים. וכפי שתראו מיד, פרו היא מקום מדהים, שפיזור הפחמן בו לא מוכר כלל עד היום. אנחנו נטוס אל אזור בצפון פרו ונראה מאגרי פחמן עצומים באדום, ואת נהר האמזונס והאזורים סביבו שחותכים את האזור. ונמשיך לאזורי הרס מוחלט שגרמה כריתת יערות ומופיעים בכחול, ונראה איך הכריתה מתקדמת כמו מחלה ויראלית בכתום. נוכל גם לטוס מעל הרי האנדים הדרומיים לראות את קו היער ולראות בדיוק כיצד מאגרי הפחמן מסתיימים כאשר גובה ההרים עולה. ונוכל לטוס לביצות העצומות במערב האמזונס. זה עולם חלומות מיימי כמו בסרט אווטר של ג'ים קמרון. אנחנו יכולים לטוס אל אחת מהמדינות הטרופיות הקטנות, פנמה, ולראות את הטווח העצום של מאגרי הפחמן, מאדום גבוה, לכחול נמוך. לרוע המזל, רוב הפחמן אובד באזורי השפלה, אבל המאגרים שראינו שנשארו, שסומנו בירוק ואדום, מרוכזים במעלה ההרים. חריג אחד שראינו מופיע במרכז המסך. ניתן לראות את אזור החיץ סביב תעלת פנמה. הוא מופיע באדום וצהוב. שלטונות התעלה משתמשים בכוח על מנת להגן על התעלה ועל המסחר הבינ"ל. מיפוי פחמן כמו שביצענו משנה את אופי שימור היערות ואת תכנון פיתוח המשאבים. זה באמת מקדם את יכולתנו להציל את היערות ולמנוע את שינויי האקלים.
My second question: How do we prepare for climate change in a place like the Amazon rainforest? Let me tell you, I spend a lot of time in these places, and we're seeing the climate changing already. Temperatures are increasing, and what's really happening is we're getting a lot of droughts, recurring droughts. The 2010 mega-drought is shown here with red showing an area about the size of Western Europe. The Amazon was so dry in 2010 that even the main stem of the Amazon river itself dried up partially, as you see in the photo in the lower portion of the slide. What we found is that in very remote areas, these droughts are having a big negative impact on tropical forests. For example, these are all of the dead trees in red that suffered mortality following the 2010 drought. This area happens to be on the border of Peru and Brazil, totally unexplored, almost totally unknown scientifically.
השאלה השנייה שלי: איך נתכונן לשינויי האקלים במקומות כמו יער הגשם באמזונס? תאמינו לי, ביליתי המון זמן ביערות הללו, וניתן לראות כיום בברור את שינויי האקלים. הטמפרטורות עולות, והביטוי העיקרי הוא בהופעת בצורת, בצורת שחוזרת שוב ושוב. בצורת הענק שארעה ב- 2010 מופיעה כאן בצבע אדום ומכסה אזור ששטחו דומה לשטח מערב אירופה. האמזונס היה יבש כל כך ב- 2010 שאפילו היוּבל העיקרי של נהר האמזונס התייבש בחלקו, כפי שתראו בצילום בחלקה התחתון של השקופית. גילינו שבאזורים מבודדים מאד, יש לבצורת השפעה שלילית ביותר על היערות הטרופיים. לדוגמה, הצבע האדום מייצג עצים מתים שהתייבשו בעקבות הבצורת של 2010. האזור הזה נמצא בגבול בין פרו וברזיל, אזור שטרם נחקר, ממש לא מוכר למדע.
So what we think, as Earth scientists, is species are going to have to migrate with climate change from the east in Brazil all the way west into the Andes and up into the mountains in order to minimize their exposure to climate change. One of the problems with this is that humans are taking apart the western Amazon as we speak. Look at this 100-square-kilometer gash in the forest created by gold miners. You see the forest in green in 3D, and you see the effects of gold mining down below the soil surface. Species have nowhere to migrate in a system like this, obviously.
אז חשבנו, חוקרי כדור הארץ, שמיני בעלי חיים שונים ינדדו יחד עם שינויי האקלים, ממזרח ברזיל מערבה לכיוון הרי האנדים ואל ההרים הגבוהים על מנת לצמצם את החשיפה שלהם לשינויי האקלים. הבעיה היא שבני האדם הורסים את מערב האמזונס ממש ברגעים אלה. תראו את החור ששטחו 100 ק"מ מרובע שנוצר ביער עקב כריית זהב. אתם רואים את היער מופיע בירוק בתמונת תלת ממד, וניתן לראות את השפעת כריית הזהב מתחת לפני הקרקע. לבעלי החיים אין לאן לנדוד במערכת כזו.
If you haven't been to the Amazon, you should go. It's an amazing experience every time, no matter where you go. You're going to probably see it this way, on a river. But what happens is a lot of times the rivers hide what's really going on back in the forest itself. We flew over this same river, imaged the system in 3D. The forest is on the left. And then we can digitally remove the forest and see what's going on below the canopy. And in this case, we found gold mining activity, all of it illegal, set back away from the river's edge, as you'll see in those strange pockmarks coming up on your screen on the right. Don't worry, we're working with the authorities to deal with this and many, many other problems in the region.
אם לא ביקרתם עדיין באמזונס, כדאי לכם לנסוע לשם. זו חוויה מדהימה בכל פעם, לא משנה לאן תגיעו. סביר שתטיילו כך, בסירות נהר. אבל במקרים רבים סביבת הנהר מסתירה את מה שקורה בשאר שטחי היער. טסנו מעל אותו נהר, וצילמנו בתלת ממד. היער מופיע משמאל. וניתן להסיר את תמונת היער באופן ממוחשב, ולראות מה קורה מתחת לצמרות. במקרה שלנו ראינו פעילות של כורי זהב, כולה בלתי חוקית, שממוקמת הרחק מגדות הנהר, ומופיעים כחורים המוזרים בצד ימין של התמונה. אל תדאגו, אנחנו משתפים פעולה עם השלטונות על מנת לטפל בהמון בעיות שמתגלות באזור.
So in order to put together a conservation plan for these unique, important corridors like the western Amazon and the Andes Amazon corridor, we have to start making geographically explicit plans now. How do we do that if we don't know the geography of biodiversity in the region, if it's so unknown to science? So what we've been doing is using the laser-guided spectroscopy from the CAO to map for the first time the biodiversity of the Amazon rainforest. Here you see actual data showing different species in different colors. Reds are one type of species, blues are another, and greens are yet another. And when we take this together and scale up to the regional level, we get a completely new geography of biodiversity unknown prior to this work. This tells us where the big biodiversity changes occur from habitat to habitat, and that's really important because it tells us a lot about where species may migrate to and migrate from as the climate shifts. And this is the pivotal information that's needed by decision makers to develop protected areas in the context of their regional development plans.
על מנת לבנות תכנית שימור למסדרון האקולוגי החשוב והייחודי שנמצא במערב האמזונס, ובמסדרון המקשר בין הרי האנדים לאמזונס, חשוב שנתחיל לבנות תכניות על בסיס גאוגרפי כבר היום. אבל איך נוכל לעשות זאת בלי להכיר את הפיזור הגאוגרפי של המינים הביולוגיים השונים באזור, אם המדע לא מכיר אותם? כיום אנחנו משתמשים בספקטרוגרפיית הלייזר של ה- CAO על מנת למפות את המגוון הביולוגי של יערות הגשם באמזונס. כאן ניתן לראות מידע אמתי לגבי המינים השונים בצבעים שונים. אדום מסמל מין אחד, כחול מין אחר, וירוק הוא מין נוסף. וכאשר מביטים בנתונים מגבוה, ברמת האזור, מקבלים מיפוי חדש לגמרי של מגוון המינים, שלא תועד מעולם. המפה מראה לנו את היכן מגוון המינים משתנה במעבר מאזור אחד לאחר, וזה נתון חשוב ביותר מכיוון שהוא מראה לאן המינים מהגרים ומאיפה הם בורחים בעקבות שינויי האקלים. וזה המידע הראשוני שנחוץ לקובעי המדיניות על מנת לפתח אזורים מוגנים בהם לא יבוצע פיתוח ברמה המקומית.
And third and final question is, how do we manage biodiversity on a planet of protected ecosystems? The example I started out with about lions hunting, that was a study we did behind the fence line of a protected area in South Africa. And the truth is, much of Africa's nature is going to persist into the future in protected areas like I show in blue on the screen. This puts incredible pressure and responsibility on park management. They need to do and make decisions that will benefit all of the species that they're protecting. Some of their decisions have really big impacts. For example, how much and where to use fire as a management tool? Or, how to deal with a large species like elephants, which may, if their populations get too large, have a negative impact on the ecosystem and on other species. And let me tell you, these types of dynamics really play out on the landscape. In the foreground is an area with lots of fire and lots of elephants: wide open savanna in blue, and just a few trees. As we cross this fence line, now we're getting into an area that has had protection from fire and zero elephants: dense vegetation, a radically different ecosystem. And in a place like Kruger, the soaring elephant densities are a real problem. I know it's a sensitive issue for many of you, and there are no easy answers with this. But what's good is that the technology we've developed and we're working with in South Africa, for example, is allowing us to map every single tree in the savanna, and then through repeat flights we're able to see which trees are being pushed over by elephants, in the red as you see on the screen, and how much that's happening in different types of landscapes in the savanna. That's giving park managers a very first opportunity to use tactical management strategies that are more nuanced and don't lead to those extremes that I just showed you. So really, the way we're looking at protected areas nowadays is to think of it as tending to a circle of life, where we have fire management, elephant management, those impacts on the structure of the ecosystem, and then those impacts affecting everything from insects up to apex predators like lions.
והשאלה השלישית והאחרונה היא, איך מנהלים את המגוון הביולוגי באזור שבו יש מערכות אקולוגית מוגנת? נחזור לדוגמה בה פתחנו לגבי מנהגי הציד של האריות, היא מבוססת על מחקר שערכנו באזורים מוגנים ומגודרים בדרום אפריקה. והאמת היא, שחלק גדול מהטבע באפריקה ישתמר גם בעתיד באזורים מוגנים כמו האזור הכחול בתמונה. זה שם אחריות ולחץ עצומים על הנהלות הפרקים הלאומיים. הם חייבים לבצע ולהוציא לפועל החלטות שיועילו לכל המינים עליהם הם מגנים. ולחלק מההחלטות שלהם יש השפעה עצומה. לדוגמה, עד כמה ואיפה להשתמש בשרפות ככלי לניהול הצמחייה? או, איך לנהל את המינים הגדולים, כמו פילים, שעשויים, אם מספרם יגדל יותר מדי, לגרום להרס הסביבה הטבעית סביבם ולפגוע במינים אחרים. ותאמינו לי, לשינויים כאלה יש השפעה עצומה בשטח. מלפנים רואים אזור שחוה הרבה שרפות ועדרי פילים: סוואנה פתוחה מסומנת בכחול, ומעט מאד עצים. ומעבר לגדר, רואים אזור שהוגן מפני שרפות ונחסם לפילים: הצמחייה עבותה, סביבה שונה לחלוטין. ובאזור כמו הפרק הלאומי קרוגר, העלייה באוכלוסיית הפילים היא בעיה אמתית. אני מבין שעבור רובכם מדובר בנושא רגיש, ואין לי תשובות פשוטות. אבל הבשורה טמונה בטכנולוגיה שפיתחנו ואנחנו משתפים פעולה עם דרום אפריקה, לדוגמה, שמאפשרת לנו למפות כל עץ בסוואנה, ואז לחזור ולטוס מעל אותם אזורים ולראות אילו עצים מופלים על ידי הפילים, הם מוצגים באדום במסך, וכמה זה קורה באזורים שונים בסוואנה. אנחנו נותנים למנהלי הפרק הזדמנות ראשונה להשתמש באסטרטגיית ניהול מבוססות ורגישות שלא מובילות למצבים הקיצוניים שהצגתי קודם. בפועל, הדרך בה אנחנו מסתכלים על שטחים מוגנים כיום מתבססת על מעגל החיים, אנחנו מנהלים את השרפות, את גודל אוכלוסיית הפילים, גורמים המשפיעים על בסיס המבנה האקולוגי, וגורמים אלה משפיעים על כל היצורים סביבם, מחרקים ועד לטורפי על כמו אריות.
Going forward, I plan to greatly expand the airborne observatory. I'm hoping to actually put the technology into orbit so we can manage the entire planet with technologies like this. Until then, you're going to find me flying in some remote place that you've never heard of. I just want to end by saying that technology is absolutely critical to managing our planet, but even more important is the understanding and wisdom to apply it.
בעתיד, אני מתכוון להרחיב את התצפיות מהאוויר. אני מקווה לשגר לוויין לחלל כך שנוכל לנהל את כל שטחי כדור הארץ בעזרת כלים טכנולוגיים כמו שתיארנו. ועד אז, אני מתכוון לטוס מעל כמה מהאזורים הנידחים ביותר בעולם. אסיים ואגיד שהטכנולוגיה היא קריטית לניהול משאבי הטבע בכדור הארץ, אבל חשוב מאד שנבין את הדרך החכמה לבצע זאת.
Thank you.
תודה.
(Applause)
(מחיאות כפיים)