When the Industrial Revolution started, the amount of carbon sitting underneath Britain in the form of coal was as big as the amount of carbon sitting under Saudi Arabia in the form of oil. This carbon powered the Industrial Revolution, it put the "Great" in Great Britain, and led to Britain's temporary world domination. And then, in 1918, coal production in Britain peaked, and has declined ever since. In due course, Britain started using oil and gas from the North Sea, and in the year 2000, oil and gas production from the North Sea also peaked, and they're now on the decline.
כשהחלה המהפכה התעשייתית, כמות הפחמן שהיתה טמונה מתחת לבריטניה בצורת פחם היתה זהה לכמות הפחם שהיתה טמונה מתחת לערב הסעודית בצורת נפט, ופחם זה הוא שהניע את המהפכה התעשייתית, הוא הביא את המילה "גדולה" לתואר "בריטניה הגדולה", והוביל לשליטה הזמנית של בריטניה בעולם. ואז, ב-1818, תפוקת הפחם בבריטניה הגיעה לשיא, ומאז היא נמצאת בירידה. עם הזמן החלה בריטניה להשתמש בנפט ובגז מהים הצפוני, ובשנת 2000, תפוקת הנפט והגז מהים הצפוני הגיעה גם היא לשיא, וכעת היא בירידה.
These observations about the finiteness of easily accessible, local, secure fossil fuels, is a motivation for saying, "Well, what's next? What is life after fossil fuels going to be like? Shouldn't we be thinking hard about how to get off fossil fuels?" Another motivation, of course, is climate change.
ההכרה הזו בסופיותם של דלקי מאובנים קלים-לגישה, מקומיים ובטוחים, היא המניע לשאלה, "מה הלאה? איך ייראו החיים אחרי דלקי המאובנים? האין כולנו צריכים לחשוב היטב איך לנטוש את דלקי המאובנים?" מניע נוסף הוא כמובן שינויי האקלים.
And when people talk about life after fossil fuels and climate change action, I think there's a lot of fluff, a lot of greenwash, a lot of misleading advertising, and I feel a duty as a physicist to try to guide people around the claptrap and help people understand the actions that really make a difference, and to focus on ideas that do add up.
וכשמדברים על החיים אחרי דלקי המאובנים ועל עשייה בנוגע לשינויי האקלים, לדעתי יש הרבה טעויות, המון 'טיוח ירוק', המון פרסום מטעה, ואני חש חובה, כפיזיקאי, לנסות לעזור לאנשים להימנע מההבלים, לעזור להם להבין מהן הפעולות שבאמת יחוללו שינוי ולהתמקד ברעיונות שאכן ישפיעו.
Let me illustrate this with what physicists call a back-of-envelope calculation. We love back-of-envelope calculations. You ask a question, write down some numbers, and get an answer. It may not be very accurate, but it may make you say, "Hmm." So here's a question: Imagine if we said, "Oh yes, we can get off fossil fuels. We'll use biofuels. Problem solved. Transport ... We don't need oil anymore." Well, what if we grew the biofuels for a road on the grass verge at the edge of the road? How wide would the verge have to be for that to work out?
אמחיש זאת בעזרת מה שהפיזיקאים מכנים "חישוב על גב מעטפה". אנו אוהבים חישובים כאלה. אתה מציג שאלה, משרבט כמה מספרים, ויש לך תשובה: אולי לא מאד מדויקת, אבל היא אולי תגרום לך לומר: "הממ." אולי לא מאד מדויקת, אבל היא אולי תגרום לך לומר: "הממ." אז הנה השאלה: תארו לעצמכם שאנו אומרים: "כן. אנו יכולים להפסיק עם דלקי המאובנים. נשתמש בביו-דלקים, והבעיה נפתרה. אנו כבר לא זקוקים לנפט לתעבורה." אז מה אם נגדל את הביו-דלקים שנחוצים לכביש כלשהו על שולי אותו כביש? כמה רחבים צריכים להיות אותם שוליים כדי שזה יצליח?
OK, so let's put in some numbers. Let's have our cars go at 60 miles per hour. Let's say they do 30 miles per gallon. That's the European average for new cars. Let's say the productivity of biofuel plantations is 1,200 liters of biofuel per hectare per year. That's true of European biofuels. And let's imagine the cars are spaced 80 meters apart from each other, and they're perpetually going along this road. The length of the road doesn't matter, because the longer the road, the more biofuel plantation. What do we do with these numbers? Take the first number, divide by the other three, and get eight kilometers. And that's the answer. That's how wide the plantation would have to be, given these assumptions. And maybe that makes you say, "Hmm. Maybe this isn't going to be quite so easy."
בסדר. בואו נרשום כמה מספרים. נניח שכלי הרכב שלנו יסעו ב-100 קמ"ש. נניח שהם יעשו 12 ק"מ לליטר. זה הממוצע האירופי למכוניות חדשות. נניח שהתפוקה של מפעלי הביו-דלקים היא 1,200 ליטר ביו-דלק לדונם לשנה. וזה המצב בביו-דלק האירופי. ונניח שהמרחק בין כלי הרכב הוא 80 מטרים, ושהם נוסעים הלוך ושוב על אותו כביש. אורך הכביש לא משנה, כי ככל שהכביש ארוך, כך יש לנו יותר מטעי ביו-דלק. מה עושים עם המספרים האלה? לוקחים את המספר הראשון, מחלקים אותו בשלושת האחרים, ומקבלים 8 קילומטרים. וזו התשובה. זה צריך להיות רוחב המטע, על סמך ההנחות האלה. וזה אולי גורם לכם לומר, "הממ, אולי זה לא יהיה כל-כך פשוט."
And it might make you think, perhaps there's an issue to do with areas. And in this talk, I'd like to talk about land areas, and ask: Is there an issue about areas? The answer is going to be yes, but it depends which country you are in.
ואולי יעלה בדעתכם שייתכן שיש בעיה של שטח, ובהרצאה הזאת אני רוצה לדבר על מקומות שיש בהם שטח ולשאול, האם יש בעיה כזו? והתשובה תלויה באיזו ארץ מדובר.
So let's start in the United Kingdom, since that's where we are today. The energy consumption of the United Kingdom, the total energy consumption -- not just transport, but everything -- I like to quantify it in lightbulbs. It's as if we've all got 125 lightbulbs on all the time, 125 kilowatt-hours per day per person is the energy consumption of the UK. So there's 40 lightbulbs' worth for transport, 40 lightbulbs' worth for heating, and 40 lightbulbs' worth for making electricity, and other things are relatively small, compared to those three big fish. It's actually a bigger footprint if we take into account the embodied energy in the stuff we import into our country as well. And 90 percent of this energy, today, still comes from fossil fuels, and 10 percent, only, from other, greener -- possibly greener -- sources, like nuclear power and renewables.
נתחיל עם הממלכה המאוחדת, משום שכאן אנו נמצאים היום. צריכת האנרגיה של הממלכה המאוחדת, סך כל צריכת האנרגיה, לא רק תעבורה, אלא הכל, אני אכמת זאת בנורות חשמל, היא כאילו שאצל כל אחד מאיתנו יש 125 נורות שדולקות כל הזמן, 125 קילוואט-שעה ליום לכל אדם ואדם וזו צריכת האנרגיה של בריטניה. זה שווה-ערך ל-40 נורות לתעבורה, 40 נורות לחימום, ושווה-ערך של 40 נורות לייצור חשמל, ויתר הדברים הם קטנים בהשוואה לשלושת הענקים האלה. ההשפעה על הסביבה גדולה עוד יותר אם לוקחים בחשבון את האנרגיה הגלומה גם בדברים שאנו מייבאים וכיום, 90 אחוזים מהאנרגיה הזו עדיין באה מדלקי מאובנים, ורק 10 אחוזים ממקורות ירוקים יותר - - אולי ירוקים יותר - כמו כוח גרעיני ומקורות אנרגיה מתחדשים.
So. That's the UK. The population density of the UK is 250 people per square kilometer. I'm now going to show you other countries by these same two measures. On the vertical axis, I'm going to show you how many lightbulbs -- what our energy consumption per person is. We're at 125 lightbulbs per person, and that little blue dot there is showing you the land area of the United Kingdom. The population density is on the horizontal axis, and we're 250 people per square kilometer. Let's add European countries in blue, and you can see there's quite a variety. I should emphasize, both of these axes are logarithmic; as you go from one gray bar to the next gray bar, you're going up a factor of 10. Next, let's add Asia in red, the Middle East and North Africa in green, sub-Saharan Africa in blue, black is South America, purple is Central America, and then in pukey-yellow, we have North America, Australia and New Zealand. You can see the great diversity of population densities and of per capita consumptions. Countries are different from each other.
אם כן, כך זה בבריטניה, וצפיפות האוכלוסיה בבריטניה היא 250 נפש לקילומטר מרובע, כעת אראה לכם ארצות אחרות לפי שני המדדים האלה. בציר האנכי אראה לכם כמה נורות חשמל -- מהי צריכת האנרגיה שלנו לנפש, ואנו עומדים על 125 נורות לנפש, והנקודה הכחולה הקטנה כאן מראה את שטח האדמות של הממלכה המאוחדת, וצפיפות האוכלוסיה מוצגת בציר האופקי, ואנו 250 נפש לקמ"ר. נוסיף מדינות אירופיות, בכחול, ואתם רואים שהמגוון גדול. עלי להדגיש ששני הצירים האלה הם לוגריתמיים. כשעוברים מקטע אפור אחד לקטע האפור הבא, עולים במקדם 10. כעת נוסיף את אסיה, באדום, המזרח התיכון וצפון-אפריקה הם בירוק, אפריקה של תת הסהרה היא בכחול, דרום-אמריקה - בשחור, סגול מייצג את אמריקה המרכזית, וצהוב מגעיל - צפון-אמריקה, אוסטרליה וניו-זילנד. אתם רואים את ההבדלים הגדולים בצפיפות האוכלוסין ובצריכה לנפש. המדינות שונות זו מזו.
Top left, we have Canada and Australia, with enormous land areas, very high per capita consumption -- 200 or 300 lightbulbs per person -- and very low population densities. Top right: Bahrain has the same energy consumption per person, roughly, as Canada -- over 300 lightbulbs per person, but their population density is a factor of 300 times greater, 1,000 people per square kilometer. Bottom right: Bangladesh has the same population density as Bahrain, but consumes 100 times less per person.
למעלה משמאל אלו קנדה ואוסטרליה עם שטחי קרקע עצומים וצריכה גבוהה מאד לנפש, 200 או 300 נורות לנפש, וצפיפויות אוכלוסין נמוכות ביותר. למעלה מימין, בבחריין יש אותה צריכת אנרגיה לנפש בערך כמו בקנדה, מעל 300 נורות לנפש, אבל צפיפות האוכלוסיה שלה גדולה פי 300, 1,000 בני-אדם לקמ"ר. למטה מימין, בבנגלדש יש אותה צפיפות אוכלוסיה כמו בחריין, אך היא צורכת פי 100 פחות לאדם.
Bottom left: well, there's no one. But there used to be a whole load of people. Here's another message from this diagram. I've added on little blue tails behind Sudan, Libya, China, India, Bangladesh. That's 15 years of progress. Where were they 15 years ago, and where are they now? And the message is, most countries are going to the right, and they're going up. Up and to the right: bigger population density and higher per capita consumption. So, we may be off in the top right-hand corner, slightly unusual, the United Kingdom accompanied by Germany, Japan, South Korea, the Netherlands, and a bunch of other slightly odd countries, but many other countries are coming up and to the right to join us. So we're a picture, if you like, of what the future energy consumption might be looking like in other countries, too.
למטה משמאל, ובכן, אין שם אף אחד. אבל פעם היו שם המון אנשים. הנה עוד מסר שעולה מהתרשים הזה. הוספתי זנבות כחולים קטנים מאחורי סעודיה, לוב, סין, הודו, בנגלה-דש. אלה 15 שנות קידמה. היכן הן היו לפני 15 שנים, והיכן הן היום. והמסר הוא שרוב הארצות עוברות ימינה, וגם עולות, למעלה וימינה -- צפיפות האוכלוסין עולה וגם הצריכה לנפש. אז אנחנו אי-שם בפינה הימנית העליונה, קצת משונה, אבל יחד עם גרמניה, יפן, דרום-קוריאה, הולנד, ועוד כמה מדינות מוזרות, אבל מדינות רבות מתקדמות ימינה ולמעלה כדי להצטרף אלינו, וזו התמונה, אם תרצו, של עתיד צריכת האנרגיה כפי שאולי ייראה במדינות נוספות.
I've also added in this diagram now some pink lines that go down and to the right. Those are lines of equal power consumption per unit area, which I measure in watts per square meter. So, for example, the middle line there, 0.1 watts per square meter, is the energy consumption per unit area of Saudi Arabia, Norway, Mexico in purple, and Bangladesh 15 years ago. Half of the world's population lives in countries that are already above that line. The United Kingdom is consuming 1.25 watts per square meter. So is Germany, and Japan is consuming a bit more.
והוספתי גם בתרשים הזה כמה קווים ורודים שיורדים למטה וימינה. אלו קוים של צריכת חשמל שווה ליחידת אזור, שמדדתי בוואטים למטר מרובע. לדוגמה, הקו הזה באמצע, 0.1 וואט למ"ר, הוא צריכת האנרגיה ליחידת אזור בסעודיה, נורווגיה, מקסיקו בסגול, ובנגלדש לפני 15 שנה, וחצי מהעולם חי בארצות שכבר נמצאות מעל לקו הזה. בריטניה צורכת 1.25 וואט למ"ר. גרמניה ויפן צורכות מעט יותר.
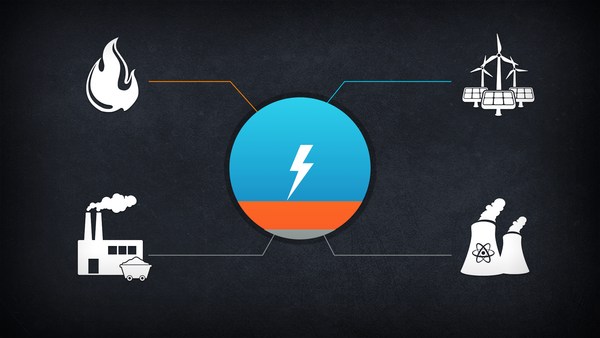
So, let's now say why this is relevant. Why is it relevant? Well, we can measure renewables in the same units and other forms of power production in the same units. Renewables is one of the leading ideas for how we could get off our 90 percent fossil-fuel habit. So here come some renewables. Energy crops deliver half a watt per square meter in European climates. What does that mean? You might have anticipated that result, given what I told you about the biofuel plantation a moment ago. Well, we consume 1.25 watts per square meter. What this means is, even if you covered the whole of the United Kingdom with energy crops, you couldn't match today's energy consumption. Wind power produces a bit more -- 2.5 watts per square meter. But that's only twice as big as 1.25 watts per square meter. So that means if you wanted, literally, to produce total energy consumption in all forms, on average, from wind farms, you need wind farms half the area of the UK. I've got data to back up all these assertions, by the way.
וכעת אומר איך זה רלוונטי. אנו יכולים למדוד מקורות מתחדשים באותן היחידות וגם צורות אחרות של הפקת כוח באותן היחידות, והמקורות המתחדשים הם אחד הרעיונות המובילים כיצד נוכל להיפטר מההתמכרות שלנו ל-90% דלקי מאובנים. אז הנה כמה מקורות מתחדשים תבואות אנרגיה מספקות חצי וואט למטר מרובע באקלימים אירופיים. ומה זה אומר? ואתם ודאי יודעים מה התוצאה, בהינתן מה שאמרתי על מטעי הביו-דלקים לפני רגע. ובכן, אנו צורכים 1.25 וואט למ"ר. וזה אומר שאפילו אם תכסו את כל הממלכה המאוחדת במטעי אנרגיה, לא תוכלו לעמוד בצריכת האנרגיה של היום. תחנות רוח מפיקות קצת יותר, 2.5 וואט למ"ר, אבל זה רק פי 2 מ-1.25 וואט למ"ר, כלומר שאם באמת רוצים להפיק את כל צריכת האנרגיה בכל הצורות בממוצע מחוות רוח, יש צורך בחוות רוח על חצי משטח בריטניה. יש לי נתונים שמגבים את כל הטענות האלה, אגב.
Next, let's look at solar power. Solar panels, when you put them on a roof, deliver about 20 watts per square meter in England. If you really want to get a lot from solar panels, you need to adopt the traditional Bavarian farming method, where you leap off the roof, and coat the countryside with solar panels, too. Solar parks, because of the gaps between the panels, deliver less. They deliver about 5 watts per square meter of land area. And here's a solar park in Vermont, with real data, delivering 4.2 watts per square meter. Remember where we are, 1.25 watts per square meter, wind farms 2.5, solar parks about five. So whichever of those renewables you pick, the message is, whatever mix of those renewables you're using, if you want to power the UK on them, you're going to need to cover something like 20 percent or 25 percent of the country with those renewables. I'm not saying that's a bad idea; we just need to understand the numbers. I'm absolutely not anti-renewables. I love renewables. But I'm also pro-arithmetic.
הלאה. בואו נבחן את האנרגיה הסולרית. קולטי שמש שמונחים על גגות, מספקים כ-20 וואט למ"ר בבריטניה. אם רוצים להפיק הרבה מקולטי שמש צריכים לאמץ את שיטת החוואות הבווארית המסורתית שלפיה יורדים מהגגות ומכסים גם את כל הארץ בקולטי שמש. פארקים סולאריים, בגלל המרווחים בין הקולטים, מפיקים פחות. בערך 5 וואט למטר מרובע של קרקע. הנה הפארק הסולארי של וורמונט ולפי נתוני אמת הוא מפיק 4.2 וואט למ"ר. זיכרו שאנו עומדים על 1.25 וואט למ"ר. חוות רוח 2.5, פארקים סולאריים בערך 5. כך שלא משנה באילו מקורות מתחדשים תבחרו, המסר הוא שכל תערובת של מקורות מתחדשים שתנצלו, אם ברצונכם שבריטניה תפעל עליהם, תצטרכו לכסות שטח כמו 20 או 25 אחוז מהארץ במקורות מתחדשים אלה. ואני לא אומר שזה רעיון גרוע: צריך פשוט להבין את המספרים. אני בכלל לא "אנטי מקורות מתחדשים", אני אוהב מקורות מתחדשים. אבל אני גם "פרו-חשבון". [צחוק]
(Laughter)
Concentrating solar power in deserts delivers larger powers per unit area, because you don't have the problem of clouds. So, this facility delivers 14 watts per square meter; this one 10 watts per square meter; and this one in Spain, 5 watts per square meter. Being generous to concentrating solar power, I think it's perfectly credible it could deliver 20 watts per square meter. So that's nice. Of course, Britain doesn't have any deserts. Yet.
ריכוז הקליטה הסולרית במדבריות מספק יותר חשמל ליחידת אזור, מפני שאין בעיית עננים, ולכן המתקן הזה מפיק 14 וואט למ"ר, זה - 10 וואט למ"ר, וזה, בספרד, 5 וואט למ"ר. עם כל האמון בחשמל הסולארי, לדעתי סביר לגמרי שזה ייתן 20 וואט למטר מרובע. זה נחמד. כמובן שלבריטניה אין מדבריות. בינתיים. [צחוק]
(Laughter)
אז הנה הסיכום עד כאן:
So here's a summary so far: All renewables, much as I love them, are diffuse. They all have a small power per unit area, and we have to live with that fact. And that means, if you do want renewables to make a substantial difference for a country like the United Kingdom on the scale of today's consumption, you need to be imagining renewable facilities that are country-sized. Not the entire country, but a fraction of the country, a substantial fraction.
כל המקורות המתחדשים, ככל שאני אוהב אותם, מפוזרים מדי. כולם נותנים מעט חשמל ליחידת אזור, ועלינו להכיר בעובדה זו. זה אומר שמי שרוצה שהמקורות המתחדשים יחוללו שינוי משמעותי במדינה כמו בריטניה בהיקף הצריכה של ימינו, צריך לדמיין מתקני הפקה ממקורות מתחדשים בסדר-גודל ארצי, לא כל הארץ, אבל חלק ממנה. חלק רציני.
There are other options for generating power as well, which don't involve fossil fuels. So there's nuclear power, and on this ordinance survey map, you can see there's a Sizewell B inside a blue square kilometer. That's one gigawatt in a square kilometer, which works out to 1,000 watts per square meter. So by this particular metric, nuclear power isn't as intrusive as renewables.
ישנן אפשרויות נוספות להפקת חשמל שאינן קשורות בדלקי מאובנים. למשל, כוח גרעיני. במפת אתרי הנשק הזו אתם רואים את תחנת הכוח "סייזוול בי" בתחומי הקילומטר המרובע הכחול הזה. זה ג'יגה-וואט אחד לקילומטר מרובע, כלומר 1,000 וואט למטר מרובע. ולפחות מההיבט הזה, הכוח הגרעיני אינו כה פולשני כמו המקורות המתחדשים.
Of course, other metrics matter, too, and nuclear power has all sorts of popularity problems. But the same goes for renewables as well. Here's a photograph of a consultation exercise in full swing in the little town of Penicuik just outside Edinburgh, and you can see the children of Penicuik celebrating the burning of the effigy of the windmill. So --
כמובן שיש היבטים נוספים, ולכוח הגרעיני יש כל מיני בעיות של פופולריות. אבל זה נכון גם לגבי המקורות המתחדשים. הנה צילום של תרגיל ייעוץ שנמצא בעיצומו בעיירה פניקוק שמחוץ לאדינבורו, אתם רואים את ילדי פניקוק חוגגים את שריפת הבובה של תחנת הרוח. אז אנשים הם אנטי-הכל, ועלינו לשמור
(Laughter)
People are anti-everything, and we've got to keep all the options on the table.
את כל האפשרויות פתוחות.
What can a country like the UK do on the supply side? Well, the options are, I'd say, these three: power renewables, and recognizing that they need to be close to country-sized; other people's renewables, so we could go back and talk very politely to the people in the top left-hand side of the diagram and say, "Uh, we don't want renewables in our backyard, but, um, please could we put them in yours instead?" And that's a serious option. It's a way for the world to handle this issue. So countries like Australia, Russia, Libya, Kazakhstan, could be our best friends for renewable production. And a third option is nuclear power. So that's some supply-side options.
מה יכולה לעשות מדינה כמו בריטניה מבחינת האספקה? הייתי אומר שיש 3 אפשרויות: מקורות מתחדשים, מתוך הכרה בכך שעליהם להיות בסדר-גודל ארצי; מקורות מתחדשים של אחרים, כדי שנוכל לפנות שוב בנימוס רב לאנשים שבצד שמאל למעלה של התרשים, ולומר, "אנו לא רוצים את המקורות המתחדשים בחצר האחורית שלנו, אולי תוכלו להציב אותם במקום זה אצלכם?" וזו אפשרות רצינית. זו דרך אפשרית שבה העולם יכול לטפל בנושא הזה. מדינות כמו אוסטרליה, רוסיה, לוב, קזחסטן, תוכלנה להיות ידידותינו הטובות ביותר מבחינת חשמל ממקורות מתחדשים. ואפשרות שלישית היא כוח גרעיני. אז אלו כמה אפשרויות אספקה צדדיות.
In addition to the supply levers that we can push -- and remember, we need large amounts, because at the moment, we get 90 percent of our energy from fossil fuels -- in addition to those levers, we could talk about other ways of solving this issue. Namely, we could reduce demand, and that means reducing population -- I'm not sure how to do that -- or reducing per capita consumption.
נוסף על מנופי האספקה שעליהם אנו יכולים ללחוץ, וזיכרו שאנו זקוקים לכמויות גדולות, כי לפי שעה, אנו מקבלים 90% מהאנרגיה שלנו מדלקי מאובנים. נוסף על המנופים האלה אנו יכולים לדבר על דרכים נוספות לפתרון הבעיה, למשל, להוריד את הביקוש, וזה אומר לצמצם את האוכלוסיה - אני לא יודע בדיוק איך - או להפחית את הצריכה לנפש.
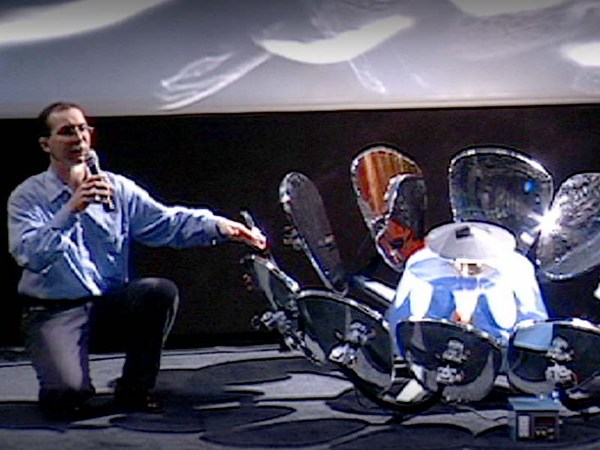
So let's talk about three more big levers that could really help on the consumption side. First, transport. Here are the physics principles that tell you how to reduce the energy consumption of transport. People often say, "Technology can answer everything. We can make vehicles that are 100 times more efficient." And that's almost true. Let me show you.
הבה נדבר על 3 המנופים הגדולים שבאמת יכולים לעזור לנו בהיבט של הצריכה. ראשית, התעבורה. הנה כמה עקרונות פיזיקליים שמראים איך להפחית את צריכת האנרגיה בתעבורה, אנשים מרבים לומר, "אה, כן, הטכנולוגיה תפתור הכל. אנו יכולים לייצר כלי-רכב פי 100 יותר יעילים" וזה כמעט נכון. הבה ואראה לכם. צריכת האנרגיה של הטנק הטיפוסי הזה
The energy consumption of this typical tank here is 80 kilowatt hours per hundred person kilometers. That's the average European car. Eighty kilowatt hours. Can we make something 100 times better by applying the physics principles I just listed? Yes. Here it is. It's the bicycle. It's 80 times better in energy consumption, and it's powered by biofuel, by Weetabix.
היא 80 קילוואט-שעה ל-100 בני-אדם/ק"מ. זו המכונית האירופית הממוצעת. 80 קילוואט-שעה. האם נוכל ליצור משהו טוב פי 100 בעזרת העקרונות הפיזיקליים שהצגתי? כן. הנה זה. אלו אופניים. הם פי 80 חסכוניים באנרגיה ומונעים בביו-דלק, בדגני-בוקר.
(Laughter)
[צחוק]
And there are other options in between, because maybe the lady in the tank would say, "No, that's a lifestyle change. Don't change my lifestyle, please." We could persuade her to take a train, still a lot more efficient than a car, but that might be a lifestyle change. Or there's the EcoCAR, top-left. It comfortably accommodates one teenager and it's shorter than a traffic cone, and it's almost as efficient as a bicycle, as long as you drive it at 15 miles per hour. In between, perhaps some more realistic options on the transport lever are electric vehicles, so electric bikes and electric cars in the middle, perhaps four times as energy efficient as the standard petrol-powered tank.
ויש עוד אפשרויות ביניים, כי אולי הגברת שבטנק תאמר, "לא, לא, לא, "זה כבר שינוי בסגנון החיים. בבקשה, אל תשנו את סגנון החיים שלי." אז אולי נוכל לשכנע אותה להיכנס לרכבת, שהיא עדיין יעילה בהרבה ממכונית, אבל זה עשוי להיות שינוי בסגנון החיים, או המכונית האקולוגית, למעלה משמאל. היא מתאימה בנוחות לצעיר אחד, היא קצרה יותר מקונוס תנועה אחד, והיא יעילה כמעט כמו אופניים כל עוד נוהגים בה ב-24 קמ"ש. בין שני אלה, אפשרויות אולי מציאותיות יותר במנוף הזה, מנוף התעבורה, יש כלי-רכב חשמליים, אז האופניים החשמליות והמכוניות החשמליות באמצע, יעילים אולי פי 4 מבחינת האנרגיה לעומת הטמק המונע בנפט.
Next, there's the heating lever. Heating is a third of our energy consumption in Britain, and quite a lot of that is going into homes and other buildings, doing space heating and water heating. So here's a typical crappy British house. It's my house, with a Ferrari out front.
הלאה: מנוף החימום. החימום הוא שליש מצריכת האנרגיה שלנו בבריטניה, ודי הרבה ממנו הולך לבתים פרטיים ומבנים אחרים שבהם יש חימום של החלל ושל המים. זהו בית בריטי מחורבן אופייני. זה הבית שלי, עם ה"פרארי" שבחזית.
(Laughter)
What can we do to it? Well, the laws of physics are written up there, which describe how the power consumption for heating is driven by the things you can control. The things you can control are the temperature difference between the inside and the outside. There's this remarkable technology called a thermostat: you grasp it, rotate it to the left, and your energy consumption in the home will decrease. I've tried it. It works. Some people call it a lifestyle change.
מה אפשר לעשות עם זה? ובכן, חוקי הפיזיקה כתובים כאן למעלה, והם מתארים -- איך צריכת החשמל לחימום נובעת מדברים שבהם אפשר לשלוט. והדברים בהם ניתן לשלוט הם הפרשי טמפרטורה בין פנים וחוץ, וקיימת טכנולוגיה מופלאה בשם "תרמוסטט". תופסים אותה, מסובבים שמאלה, וצריכת האנרגיה בבית יורדת. ניסיתי את זה. זה עובד. יש שמכנים זאת "שינוי בסגנון החיים".
(Laughter)
אפשר להפחית את דליפות החום
You can also get the fluff men in to reduce the leakiness of your building -- put fluff in the walls, fluff in the roof, a new front door, and so forth. The sad truth is, this will save you money. That's not sad, that's good. But the sad truth is, it'll only get about 25 percent of the leakiness of your building if you do these things, which are good ideas. If you really want to get a bit closer to Swedish building standards with a crappy house like this, you need to be putting external insulation on the building, as shown by this block of flats in London. You can also deliver heat more efficiently using heat pumps, which use a smaller bit of high-grade energy like electricity to move heat from your garden into your house.
בבניין -- להכניס בידוד לקירות, לתקרה, להתקין דלת חדשה וכו'. והמצער הוא שזה יחסוך כסף. זה לא רע, זה טוב. מה שמצער הוא שזה יחסום רק 25% מדליפת החום בבניין, אם עושים את הדברים האלה, שהם רעיונות טובים. אם באמת רוצים להתקרב לשוודים מבחינת תקני הבניה בבית מחורבן כזה, צריך לשים בידוד חיצוני על המבנה כמו השיכון הזה בלונדון. אפשר גם להעביר חום בצורה יעילה יותר ע"י משאבות חום שמנצלות פחות אנרגיה טובה כמו חשמל להעברת חום מהגינה לבית.
The third demand-side option I want to talk about, the third way to reduce energy consumption is: read your meters. People talk a lot about smart meters, but you can do it yourself. Use your own eyes and be smart. Read your meter, and if you're anything like me, it'll change your life. Here's a graph I made. I was writing a book about sustainable energy, and a friend asked me, "How much energy do you use at home?" I was embarrassed; I didn't actually know. And so I started reading the meter every week. The old meter readings are shown in the top half of the graph, and then 2007 is shown in green at the bottom. That was when I was reading the meter every week. And my life changed, because I started doing experiments and seeing what made a difference. My gas consumption plummeted, because I started tinkering with the thermostat and the timing on the heating system, and I knocked more than half off my gas bills.
האפשרות השלישית מבחינת הביקוש עליה אני רוצה לדבר, הדרך השלישית לצמצם את צריכת האנרגיה היא לקרוא את מדי החשמל. אנשים מדברים הרבה על מכשירי מדידה חכמים, אבל אתם יכולים לעשות את זה בעצמכם. תשתמשו בעיניים שלכם בחוכמה, תקראו את מדי החשמל, ואם אתם קצת כמוני, זה ישנה את חייכם. הנה גרף שהכנתי. כתבתי ספר על אנרגיה מקיימת, וידיד אחד שאל אותי, "אז בכמה אנרגיה אתה משתמש בבית?" וזה הביך אותי. כי לא ידעתי. אז התחלתי לקרוא את מד החשמל מידי שבוע, והקריאות הקודמות שלו מוצגות בחצי העליון של הגרף, ואחר, שנת 2007 מוצגת בירוק למטה, ואז כבר קראתי את מד החשמל מידי שבוע, וחיי השתנו, כי התחלתי לערוך ניסויים ולגלות מה משפיע, וצריכת הגז שלי ירדה פלאים כי התחלתי להתעסק עם התרמוסטט ועם התזמון של מערכת החימום, והפחתתי יותר ממחצית מחשבונות הגז שלי. הסיפור דומה עם צריכת החשמל שלי,
There's a similar story for my electricity consumption, where switching off the DVD players, the stereos, the computer peripherals that were on all the time, and just switching them on when I needed them, knocked another third off my electricity bills, too.
ניתקתי את נגני הדי-וי-די, את מכשירי הסטריאו, את ההתקנים ההיקפיים של המחשב שדלקו כל הזמן, ופשוט הדלקתי אותם כשהייתי צריך, וגם זה הפחית שליש מחשבונות החשמל שלי.
So we need a plan that adds up. I've described for you six big levers. We need big action, because we get 90 percent of our energy from fossil fuels, and so you need to push hard on most, if not all, of these levers. Most of these levers have popularity problems, and if there is a lever you don't like the use of, well, please do bear in mind that means you need even stronger effort on the other levers.
אנו זקוקים לתכנית משמעותית, וזה עתה תיארתי לפניכם את 6 המנופים הגדולים, ועלינו לעשות מעשה כי אנו משיגים 90% מהאנרגיה שלנו מדלקי מאובנים, לכן יש ללחוץ חזק על רוב, אם לא כל, המנופים האלה. לרובם יש בעיות של פופולריות, ואם יש מנוף שלא נעים לכם ללחוץ עליו, זיכרו בבקשה שזה דורש מכם ללחוץ עוד יותר חזק על המנופים האחרים.
So I'm a strong advocate of having grown-up conversations that are based on numbers and facts. And I want to close with this map that just visualizes for you the requirement of land and so forth in order to get just 16 lightbulbs per person from four of the big possible sources. So, if you wanted to get 16 lightbulbs -- remember, today our total energy consumption is 125 lightbulbs' worth -- if you wanted 16 from wind, this map visualizes a solution for the UK. It's got 160 wind farms, each 100 square kilometers in size, and that would be a twentyfold increase over today's amount of wind.
אז אני ממליץ בחום לנהל שיח בוגר המבוסס על מספרים ועובדות, וברצוני לסיים במפה שתמחיש לכם את הדרישות מבחינת שטח וכו', כדי להגיע רק ל-16 נורות חשמל לנפש ע"י שימוש ב-4 מהמקורות הגדולים האפשריים. אז אם רוצים להגיע ל-16 נורות לנפש, זיכרו, שהיום סך כל צריכת האנרגיה שלנו שווה ל-125 נורות חשמל. אם רוצים להשיג 16 מהרוח, המפה הזו מראה את הפתרון עבור בריטניה. יש בה 160 חוות רוח, כל אחת בגודל 100 קמ"ר, וזה יהיה גידול של פי 20
Nuclear power: to get 16 lightbulbs per person, you'd need two gigawatts at each of the purple dots on the map. That's a fourfold increase over today's levels of nuclear power.
בכמות אנרגיית הרוח של היום. כוח גרעיני, כדי להגיע ל-16 נורות לנפש, דרושים 2 ג'יגה-וואט מכל אחת מהנקודות הסגולות האלה. זה גידול של פי 4 לעומת רמות הכוח הגרעיני של היום.
Biomass: to get 16 lightbulbs per person, you'd need a land area something like three and a half Wales' worth, either in our country, or in someone else's country, possibly Ireland, possibly somewhere else.
ביו-מסה: כדי להגיע ל-16 נורות לנפש תזדקקו לשטח אדמה כמו וויילס פי 3.5, בארץ שלנו או בארץ אחרת, אולי באירלנד, או במקום אחר. [צחוק]
(Laughter)
ומקור משני רביעי , כוח סולארי מרוכז
And a fourth supply-side option: concentrating solar power in other people's deserts. If you wanted to get 16 lightbulbs' worth, then we're talking about these eight hexagons down at the bottom right. The total area of those hexagons is two Greater London's worth of someone else's Sahara, and you'll need power lines all the way across Spain and France to bring the power from the Sahara to Surrey.
במדבריות של אנשים אחרים, אם רוצים לקבל שווה ערך של 16 נורות, אז אנו מדברים על שמונת המשושים האלה כאן, מימין למטה. השטח הכולל של המשושים האלה הוא פעמיים לונדון רבתי בסהרה של מישהו, ויהיה צורך בקווי חשמל לאורך כל ספרד וצרפת כדי להעביר את החשמל ממדבר סהרה לסארי.
(Laughter)
אנו זקוקים לתכנית מעשית.
We need a plan that adds up. We need to stop shouting and start talking. And if we can have a grown-up conversation, make a plan that adds up and get building, maybe this low-carbon revolution will actually be fun.
עלינו להפסיק לצעוק ולהתחיל לדבר, ואם נוכל לנהל שיח בוגר, לנסח תכנית מעשית ולהתחיל לבנות, אולי מהפכת צמצום הפחמן הזו
Thank you very much for listening.
תוכל להיות כיפית. תודה רבה על הקשבתכם.
(Applause)
[מחיאות כפיים]