I'd like you to imagine the world anew. I'd like to show you some maps, which have been drawn by Ben Hennig, of the planet in a way that most of you will never have seen the planet depicted before.
Я хочу, чтобы вы взглянули на мир по-новому. Я хочу показать вам карты нашей планеты, нарисованные Беном Хеннигом. Такой планету большинство из вас ещё не видело.
Here's an image that you're very familiar with. I'm old enough that I was actually born before we saw this image. Apparently some of my first words were "moona, moona," but I think that's my mom having a particular fantasy about what her baby boy could see on the flickering black and white TV screen. It's only been a few centuries since we've actually, most of us, thought of our planet as spherical. When we first saw these images in the 1960s, the world was changing at an incredible rate. In my own little discipline of human geography, a cartographer called Waldo Tobler was drawing new maps of the planet, and these maps have now spread, and I'm going to show you one of them now. This map is a map of the world, but it's a map which looks to you a little bit strange. It's a map in which we stretched places, so that those areas which contain many people are drawn larger, and those areas, like the Sahara and the Himalayas, in which there are few people, have been shrunk away. Everybody on the planet is given an equal amount of space. The cities are shown shining bright. The lines are showing you submarine cables and trade routes. And there's one particular line that goes from the Chinese port of Dalian through past Singapore, through the Suez Canal, through the Mediterranean and round to Rotterdam. And it's showing you the route of what was the world's largest ship just a year ago, a ship which was taking so many containers of goods that when they were unloaded, if the lorries had all gone in convoy, they would have been 100 kilometers long. This is how our world is now connected. This is the quantity of stuff we are now moving around the world, just on one ship, on one voyage, in five weeks.
Вот всем известный снимок. Я так стар, что родился, когда этот кадр ещё не был сделан. Судя по всему, моим первым словом была «люна», хотя, думаю, у моей мамы разыгралось воображение, когда её малютка-сын смотрел в мерцающий экран чёрно-белого телевизора. Ещё несколько столетий назад большинство не считало нашу планету круглой. Когда в 1960-х мы впервые увидели эти кадры, мир менялся с невероятной скоростью. В моей небольшой области, социальной географии, картограф Вальдо Тоблер рисовал новые карты планеты, сейчас они широко известны, и я вам сейчас одну из них покажу. Это карта мира, но она может показаться немного странной. В ней мы растянули некоторые густонаселённые области, чтобы они были изображены крупнее, а малолюдные места вроде Сахары или Гималаев — хорошенько сжали. Каждому на планете дано одинаковое пространство. Ярко светятся города. Линиями изображены подводные кабели и торговые пути. Есть особенная линия, которая идёт от китайского порта Далянь мимо Сингапура через Суэцкий канал и Средиземное море в Роттердам. Этой линией показан путь корабля, который ещё год назад был самым большим в мире и перевозил за раз столько контейнеров, что если бы их перевозили грузовиками, то вереница машин растянулась бы на 100 километров. Вот как тесно взаимосвязан наш мир. Вот какой объём грузов мы перевозим через весь мир всего на одном корабле за один пятинедельный рейс.
We've lived in cities for a very long time, but most of us didn't live in cities. This is Çatalhöyük, one of the world's first cities. At its peak 9,000 years ago, people had to walk over the roofs of others' houses to get to their home. If you look carefully at the map of the city, you'll see it has no streets, because streets are something we invented. The world changes. It changes by trial and error. We work out slowly and gradually how to live in better ways. And the world has changed incredibly quickly most recently. It's only within the last six, seven, or eight generations that we have actually realized that we are a species. It's only within the last few decades that a map like this could be drawn. Again, the underlying map is the map of world population, but over it, you're seeing arrows showing how we spread out of Africa with dates showing you where we think we arrived at particular times. I have to redraw this map every few months, because somebody makes a discovery that a particular date was wrong. We are learning about ourselves at an incredible speed. And we're changing. A lot of change is gradual. It's accretion. We don't notice the change because we only have short lives, 70, 80, if you're lucky 90 years. This graph is showing you the annual rate of population growth in the world. It was very low until around about 1850, and then the rate of population growth began to rise so that around the time I was born, when we first saw those images from the moon of our planet, our global population was growing at two percent a year. If it had carried on growing at two percent a year for just another couple of centuries, the entire planet would be covered with a seething mass of human bodies all touching each other. And people were scared. They were scared of population growth and what they called "the population bomb" in 1968. But then, if you look at the end of the graph, the growth began to slow. The decade -- the '70s, the '80s, the '90s, the noughties, and in this decade, even faster -- our population growth is slowing. Our planet is stabilizing. We are heading towards nine, 10, or 11 billion people by the end of the century. Within that change, you can see tumult. You can see the Second World War. You can see the pandemic in 1918 from influenza. You can see the great Chinese famine. These are the events we tend to concentrate on. We tend to concentrate on the terrible events in the news. We don't tend to concentrate on the gradual change and the good news stories.
Мы уже очень долго живём в городах, но большинство из нас живут не в городе. Это Чатал-Хююк, один из древнейших городов. В период его расцвета 9 000 лет назад, чтобы дойти до своего дома, люди шли по чужим крышам. Если внимательно посмотреть на карту города, видно, что в нём нет улиц, улицы были изобретены позже. Мир меняется. Он меняется путём проб и ошибок. Мы медленно, но верно ищем способы жить лучше. В последнее время мир менялся невероятно быстро. Только 6–8 поколений назад мы осознали себя как отдельный вид. Такая карта была невозможна ещё несколько десятилетий назад. И опять за основу взята карта населения земли, и на ней стрелками показано, как мы расселились из Африки, также указаны предполагаемые даты миграции в те или иные регионы. Каждые несколько месяцев эту карту приходится перерисовывать, потому что то и дело совершаются открытия, говорящие, что какая-то дата неверна. Мы с невероятной скоростью узнаём о себе что-то новое. Мы меняемся. Многие изменения постепенны. Это приращение. Мы не замечаем изменений, потому что наш век так недолог, 70–80, если повезёт — 90 лет. График иллюстрирует ежегодный прирост мирового населения. В середине XIX века, около 1850 года, он относительно невысок, затем темпы прироста населения стали ускоряться, так что к моменту моего рождения, когда мы впервые увидели те самые снимки нашей планеты с Луны, мировое население ежегодно увеличивалось на 2%. Если бы такой темп сохранился хотя бы на пару столетий, вся планета покрылась бы бурлящей массой человеческих тел, прижатых друг к другу. Людям было страшно. Они боялись роста населения и, как это называли в 1968 году, «популяционной бомбы». Но если посмотреть в конец графика, видно, что темпы роста замедлились. Начиная с 1970-х годов и вплоть до настоящего времени, в текущем десятилетии особенно быстро, темпы роста населения замедлялись. Планета успокаивается. К концу века на планете будет 10 или 11 миллиардов человек. На графике видны провалы: вот Вторая мировая война, вот эпидемия «испанки» 1918 года, а вот Великий китайский голод. На этих событиях мы заостряем внимание. Слушая новости, мы особенно замечаем катастрофы. Мы не склонны замечать постепенные перемены и благоприятные известия.
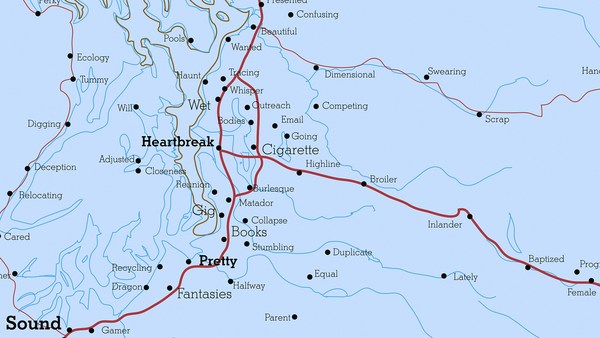
We worry about people. We worry about how many people there are. We worry about how you can get away from people. But this is the map of the world changed again to make area large, the further away people are from each area. So if you want to know where to go to get away from everybody, here's the best places to go. And every year, these areas get bigger, because every year, we are coming off the land globally. We are moving into the cities. We are packing in more densely. There are wolves again in Europe, and the wolves are moving west across the continent. Our world is changing.
Мы переживаем за людей. Переживаем, сколько их. Нас волнует, как найти уединение. На этой карте мира расширены территории, где люди находятся далеко друг от друга. Если думаете, куда податься, чтобы никого не видеть, вот эти чудесные места. С каждым годом эти территории растут, потому что мы ежегодно перемещаемся. Мы переселяемся в города, мы группируемся плотнее. В Европе снова появились волки, и они движутся на запад континента. Наш мир меняется.
You have worries. This is a map showing where the water falls on our planet. We now know that. And you can look at where Çatalhöyük was, where three continents meet, Africa, Asia, and Europe, and you can see there are a large number of people living there in areas with very little water. And you can see areas in which there is a great deal of rainfall as well. And we can get a bit more sophisticated. Instead of making the map be shaped by people, we can shape the map by water, and then we can change it every month to show the amount of water falling on every small part of the globe. And you see the monsoons moving around the planet, and the planet almost appears to have a heartbeat. And all of this only became possible within my lifetime to see this is where we are living. We have enough water.
Вас это беспокоит. На этой карте показан уровень осадков. Это не секрет. Если посмотреть на место, где раньше был Чатал-Хююк, где встречаются три континента, Африка, Азия и Европа, видно, что огромное число людей живёт там, где очень мало воды. С другой стороны, видны территории, где выпадает большое количество осадков. Можно усложнить задачу: построить карту в зависимости не от людей, а от воды, и менять её ежемесячно, чтобы показать, сколько воды выпадает на каждом отдельном участке планеты. Видно, как муссоны движутся по планете, это движение похоже на биение сердца планеты. И всё это стало возможным на моей памяти: мы можем увидеть, где живём. У нас достаточно воды.
This is a map of where we grow our food in the world. This is the areas that we will rely on most for rice and maize and corn. People worry that there won't be enough food, but we know, if we just ate less meat and fed less of the crops to animals, there is enough food for everybody as long as we think of ourselves as one group of people.
Это карта сельскохозяйственных угодий. Это территории, от которых зависит, будет ли у нас рис, кукуруза и зерно. Некоторые беспокоятся, хватит ли нам еды, но известно, что если бы мы ели меньше мяса и меньше зерна отдавали на корм животным, то еды бы хватило всем, если рассматривать всё население земли как единое целое.
And we also know about what we do so terribly badly nowadays. You will have seen this map of the world before. This is the map produced by taking satellite images, if you remember those satellites around the planet in the very first slide I showed, and producing an image of what the Earth looks like at night. When you normally see that map, on a normal map, the kind of map that most of you will be used to, you think you are seeing a map of where people live. Where the lights are shining up is where people live. But here, on this image of the world, remember we've stretched the map again. Everywhere has the same density of people on this map. If an area doesn't have people, we've shrunk it away to make it disappear. So we're showing everybody with equal prominence. Now, the lights no longer show you where people are, because people are everywhere. Now the lights on the map, the lights in London, the lights in Cairo, the lights in Tokyo, the lights on the Eastern Seaboard of the United States, the lights show you where people live who are so profligate with energy that they can afford to spend money powering lights to shine up into the sky, so satellites can draw an image like this. And the areas that are dark on the map are either areas where people do not have access to that much energy, or areas where people do, but they have learned to stop shining the light up into the sky. And if I could show you this map animated over time, you would see that Tokyo has actually become darker, because ever since the tsunami in Japan, Japan has had to rely on a quarter less electricity because it turned the nuclear power stations off. And the world didn't end. You just shone less light up into the sky.
Нам также известно, что мы делаем сегодня категорически неправильно. Вы уже видели эту карту мира. Эта карта создана на основании снимков со спутников, которые окружают нашу планету — я их показывал на первом слайде — и делают снимки ночной Земли. Когда вы смотрите на «ночную» карту в её привычном виде, то думаете, что видите, где живут люди. Где горит свет — там живут люди. Но на этой карте мы вновь растянули некоторые территории. Теперь по всей карте плотность населения одинакова. Если территория безлюдна, на карте она сжимается, исчезает. Все люди получили равное место на карте. Теперь огни уже не говорят о том, где живут люди, поскольку люди повсюду. Теперь же огни городов, огни Лондона, Каира и Токио, восточного побережья США и другие, показывают не то, где люди живут, а где они так расточительны, что не экономят на электричестве и освещают свои города так, что их видно даже со снимков спутников. Тёмные зоны на карте отображают места, где у людей либо нет таких запасов электричества, либо они есть, но люди решили не тратить их на то, чтобы подсвечивать небо. Если бы я мог показать вам, как эта карта менялась со временем, вы бы увидели, как потемнел на ней Токио, поскольку после цунами Япония на четверть сократила расход электроэнергии, так как отказалась от атомных станций. От этого ничего ужасного не произошло. Просто меньше света уходит в никуда.
There are a huge number of good news stories in the world. Infant mortality is falling and has been falling at an incredible rate. A few years ago, the number of babies dying in their first year of life in the world fell by five percent in just one year. More children are going to school and learning to read and write and getting connected to the Internet and going on to go to university than ever before at an incredible rate, and the highest number of young people going to university in the world are women, not men. I can give you good news story after good news story about what is getting better in the planet, but we tend to concentrate on the bad news that is immediate. Rebecca Solnit, I think, put it brilliantly, when she explained: "The accretion of incremental, imperceptible changes which can constitute progress and which render our era dramatically different from the past" -- the past was much more stable -- "a contrast obscured by the undramatic nature of gradual transformation, punctuated by occasional tumult." Occasionally, terrible things happen. You are shown those terrible things on the news every night of the week. You are not told about the population slowing down. You are not told about the world becoming more connected. You are not told about the incredible improvements in understanding. You are not told about how we are learning to begin to waste less and consume less.
В мире очень много хороших новостей. С поразительной скоростью падает младенческая смертность. Несколько лет назад число детей, умерших на первом году жизни, сократилось на 5% всего за год. Всё больше детей ходят в школы, учатся читать и писать, получают доступ в интернет и поступают в университеты, и эти цифры очень быстро растут, при этом в университетах по всему миру учится больше женщин, чем мужчин. Я могу одну за другой озвучивать хорошие новости о происходящем на нашей планете, но мы склонны обращать больше внимания на текущие плохие события. Ребекка Солнит блестяще сформулировала эту мысль: «постепенное приращение незаметных изменений, которые и создают прогресс и делают нашу эпоху настолько отличной от прошлого,» — прошлое было намного стабильнее, — «контраст, скрытый из-за незначительности постепенной трансформации, перемежающейся периодическими всплесками». Время от времени случаются катастрофы. Каждый вечер вам о них говорят с телеэкранов. По ТВ не говорят о снижении темпов роста населения, о растущей взаимосвязи всего в мире, о поразительных прорывах в понимании, о том, что мы учимся меньше потреблять и тратить попусту.
This is my last map. On this map, we have taken the seas and the oceans out. Now you are just looking at about 7.4 billion people with the map drawn in proportion to those people. You're looking at over a billion in China, and you can see the largest city in the world in China, but you do not know its name. You can see that India is in the center of this world. You can see that Europe is on the edge. And we in Exeter today are on the far edge of the planet. We are on a tiny scrap of rock off Europe which contains less than one percent of the world's adults, and less than half a percent of the world's children. We are living in a stabilizing world, an urbanizing world, an aging world, a connecting world. There are many, many things to be frightened about, but there is no need for us to fear each other as much as we do, and we need to see that we are now living in a new world.
Вот заключительная карта. На ней исключены моря и океаны. Перед вами просто 7,4 миллиарда человек, пропорционально отображённых на карте. Вы видите более миллиарда в Китае, видите в Китае крупнейший в мире город, но не знаете его название. Вы видите, что в центре такого мира расположена Индия, а Европа — где-то на периферии. А мы здесь, в Эксетере, на самом краю мира, на малюсенькой скале, оторванной от Европы, на которой проживает меньше одного процента взрослого населения Земли и меньше 0,5% детей. Мы живём в мире, который становится всё более стабильным, урбанизированным, взрослым и взаимосвязанным. Нам есть чего бояться, но не нужно бояться друг друга, как мы делаем это сейчас, необходимо понять, что мы живём в новом мире.
Thank you very much.
Большое спасибо.
(Applause)
(Аплодисменты)