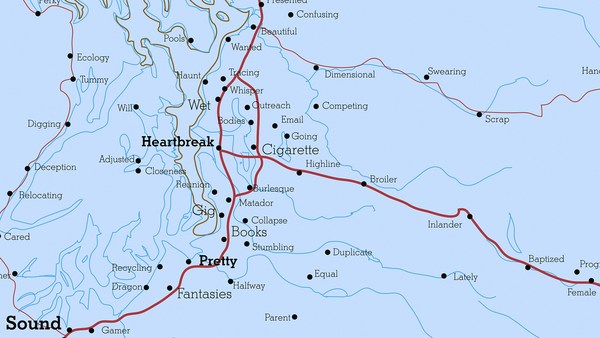
I'd like you to imagine the world anew. I'd like to show you some maps, which have been drawn by Ben Hennig, of the planet in a way that most of you will never have seen the planet depicted before.
Mi piacerebbe immaginaste il mondo in modo nuovo. Mi piacerebbe mostrarvi alcune mappe, che sono state elaborate da Ben Hennig, del pianeta in un modo che molti di voi non avranno mai visto prima.
Here's an image that you're very familiar with. I'm old enough that I was actually born before we saw this image. Apparently some of my first words were "moona, moona," but I think that's my mom having a particular fantasy about what her baby boy could see on the flickering black and white TV screen. It's only been a few centuries since we've actually, most of us, thought of our planet as spherical. When we first saw these images in the 1960s, the world was changing at an incredible rate. In my own little discipline of human geography, a cartographer called Waldo Tobler was drawing new maps of the planet, and these maps have now spread, and I'm going to show you one of them now. This map is a map of the world, but it's a map which looks to you a little bit strange. It's a map in which we stretched places, so that those areas which contain many people are drawn larger, and those areas, like the Sahara and the Himalayas, in which there are few people, have been shrunk away. Everybody on the planet is given an equal amount of space. The cities are shown shining bright. The lines are showing you submarine cables and trade routes. And there's one particular line that goes from the Chinese port of Dalian through past Singapore, through the Suez Canal, through the Mediterranean and round to Rotterdam. And it's showing you the route of what was the world's largest ship just a year ago, a ship which was taking so many containers of goods that when they were unloaded, if the lorries had all gone in convoy, they would have been 100 kilometers long. This is how our world is now connected. This is the quantity of stuff we are now moving around the world, just on one ship, on one voyage, in five weeks.
Questa è un'immagine che conoscete bene. Sono abbastanza vecchio da essere nato prima che vedessimo questa immagine. Pare che una delle mie prime parole sia stata "moona", ma credo mia mamma avesse una particolare fantasia su cosa il suo bimbo potesse vedere sul tremolante schermo della TV in bianco e nero. Sono passati solo alcuni secoli da quando, molti di noi, pensiamo che il nostro pianeta sia sferico. Quando abbiamo visto quelle immagini negli anni 1960, il mondo stava cambiando a un ritmo incredibile. Nella mia piccola disciplina della geografia umana, un cartografo di nome Waldo Tobler stava disegnando nuove mappe del pianeta, e quelle mappe sono ora diffuse, e sto per mostrarvene una. Questa è una mappa del mondo, ma è ua mappa che vi sembra un po' insolita. È una mappa dove allunghiamo i luoghi in modo che le aree che contengono molte persone sono disegnate più grandi, e quelle aree, come il Sahara e l'Himalaya, dove vi è meno gente, sono state ristrette. A ciascuno sul pianeta è data la stessa quantità di spazio. Le città sono zone scintillanti. Le linee vi mostrano i cavi sottomarini e le rotte del commercio. E vi è una linea particolare che va dal porto Cinese di Dalian, passa Singapore, attraversa il Canale di Suez, attraversa il Mediterraneo e sale fino a Rotterdam. Vi mostra la rotta di quella che fu la più grande nave appena un anno fa, una nave che portava così tanti container di beni che quando fu scaricata, se i camion si fossero mossi in convoglio, sarebbe stato lungo 100 km. Il nostro mondo è connesso in questo modo. Questa è la quantità di merce che stiamo muovendo intorno al mondo, solo una nave, in un viaggio, in 5 settimane.
We've lived in cities for a very long time, but most of us didn't live in cities. This is Çatalhöyük, one of the world's first cities. At its peak 9,000 years ago, people had to walk over the roofs of others' houses to get to their home. If you look carefully at the map of the city, you'll see it has no streets, because streets are something we invented. The world changes. It changes by trial and error. We work out slowly and gradually how to live in better ways. And the world has changed incredibly quickly most recently. It's only within the last six, seven, or eight generations that we have actually realized that we are a species. It's only within the last few decades that a map like this could be drawn. Again, the underlying map is the map of world population, but over it, you're seeing arrows showing how we spread out of Africa with dates showing you where we think we arrived at particular times. I have to redraw this map every few months, because somebody makes a discovery that a particular date was wrong. We are learning about ourselves at an incredible speed. And we're changing. A lot of change is gradual. It's accretion. We don't notice the change because we only have short lives, 70, 80, if you're lucky 90 years. This graph is showing you the annual rate of population growth in the world. It was very low until around about 1850, and then the rate of population growth began to rise so that around the time I was born, when we first saw those images from the moon of our planet, our global population was growing at two percent a year. If it had carried on growing at two percent a year for just another couple of centuries, the entire planet would be covered with a seething mass of human bodies all touching each other. And people were scared. They were scared of population growth and what they called "the population bomb" in 1968. But then, if you look at the end of the graph, the growth began to slow. The decade -- the '70s, the '80s, the '90s, the noughties, and in this decade, even faster -- our population growth is slowing. Our planet is stabilizing. We are heading towards nine, 10, or 11 billion people by the end of the century. Within that change, you can see tumult. You can see the Second World War. You can see the pandemic in 1918 from influenza. You can see the great Chinese famine. These are the events we tend to concentrate on. We tend to concentrate on the terrible events in the news. We don't tend to concentrate on the gradual change and the good news stories.
Abbiamo vissuto nelle città per un tempo molto lungo, ma molti non hanno vissuto in città. Questa è Çatalhöyük, una delle prime città al mondo. Al suo massimo, 9.000 anni fa, la gente doveva camminare sopra i tetti delle case altrui per arrivare a casa. Se guardate con attenzione la mappa della città, vedrete che non ci sono strade, poichè le strade le abbiamo inventate noi. Il mondo cambia. Cambia per tentativi ed errori. Risolviamo lentamente e gradualmente come vivere meglio. Il mondo di recente è cambiato in modo incredibilmente veloce. È solo entro le ultime sei, sette, od otto generazioni che abbiamo in realtà capito di essere una specie. Solo nelle ultime poche decadi che si è potuta disegnare una mappa così. Di nuovo, la mappa che vi presento è la mappa della popolazione mondiale, ma le frecce sovrapposte mostrano come ci siamo diffusi dall'Africa con le date che vi mostrano dove pensiamo di essere arrivati in determinati momenti. Devo ridisegnare questa mappa ogni pochi mesi, poiché qualcuno scopre che quella particolare data era sbagliata. Stiamo imparando su noi stessi a una velocità incredibile. E stiamo cambiando. Molto del cambiamento è graduale. È la concrescenza. Non avvertiamo il cambiamento perché abbiamo vite brevi, 70, 80, 90 anni se siete fortunati. Questo grafico vi mostra il tasso di crescita della popolazione nel mondo. Era molto lento fino a circa il 1850, e poi il tasso di crecita iniziò a salire così che intorno al periodo in cui sono nato, quando per primi vedemmo quelle immagini del nostro pianeta dalla luna, la popolazione globale cresceva del 2% l'anno. Se avesse continuato la crescita al 2% l'anno per un altro paio di secoli, l'intero pianeta sarebbe coperto di una massa ribollente di corpi umani uno vicino all'altro. La gente era spaventata dalla crescita della popolazione che chiamarono "l'esplosione demografica" nel 1968. Ma poi, se guardate, alla fine del grafico, la crescita iniziò a rallentare. I decenni -- gli anni '70, '80, '90, il primo decennio del secolo e in questo decennio, ancora più velocemente -- la crescita sta rallentando. Ci stiamo stabilizzando. Ci stiamo avvicinando a 9, 10 o 11 miliardi di persone entro la fine del secolo. Entro questo cambiamento, potete vedere i tumulti. Potete vedere la II Guerra Mondiale; la pandemia nel 1918 causata dall'influenza; la grande carestia cinese. Quelli sono gli eventi su cui cerchiamo di concentrarci. Ci concentriamo sui terribili eventi dati dai notiziari. Non ci concentriamo sul cambiamento graduale e sulle buone notizie.
We worry about people. We worry about how many people there are. We worry about how you can get away from people. But this is the map of the world changed again to make area large, the further away people are from each area. So if you want to know where to go to get away from everybody, here's the best places to go. And every year, these areas get bigger, because every year, we are coming off the land globally. We are moving into the cities. We are packing in more densely. There are wolves again in Europe, and the wolves are moving west across the continent. Our world is changing.
Ci preoccupiamo delle persone. Ci preoccupiamo di quanta gente c'è. Ci preoccupiamo di come ci si può allontanare dalla gente. Questa è la mappa del mondo modificata di nuovo per rendere più grande l'area, quanto più lontana è la gente da ciascuna area. Se volete sapere dove andare per stare lontano dagli altri, qui ci sono i posti migliori dove andare. Ogni anno, queste aree diventano più grandi, poiché ogni anno, ci allontaniamo dalla terra a livello globale. Ci spostiamo nelle città. Ci impacchettiamo più densamente. Ci sono di nuovo i lupi in Europa, e i lupi si stanno spostando verso ovest attraverso il continente. Il nostro mondo cambia.
You have worries. This is a map showing where the water falls on our planet. We now know that. And you can look at where Çatalhöyük was, where three continents meet, Africa, Asia, and Europe, and you can see there are a large number of people living there in areas with very little water. And you can see areas in which there is a great deal of rainfall as well. And we can get a bit more sophisticated. Instead of making the map be shaped by people, we can shape the map by water, and then we can change it every month to show the amount of water falling on every small part of the globe. And you see the monsoons moving around the planet, and the planet almost appears to have a heartbeat. And all of this only became possible within my lifetime to see this is where we are living. We have enough water.
Avete delle preoccupazioni. Questa mappa mostra dove cade la pioggia sul nostro pianeta. Ora lo sappiamo. Potete vedere dove stava Çatalhöyük, dove si incontrano Africa, Asia e Europa, e potete vedere che un gran numero di persone vivono in aree con molta poca acqua. Potete vedere anche aree dove c'è una grande quantità di pioggia. E possiamo diventare un po' più raffinati. Invece di costruire mappe configurate dalla gente, si può far configurare la mappa dall'acqua, e poi la si può cambiare ogni mese per mostrare la quantità d'acqua che cade in ogni piccola parte del globo. E si vedono i monsoni che si spostano sul pianeta, e il pianeta sembra quasi avere un battito cardiaco. Tutto ciò è diventato possibile nell'arco della mia vita per vedere dove viviamo. C'è abbastanza acqua.
This is a map of where we grow our food in the world. This is the areas that we will rely on most for rice and maize and corn. People worry that there won't be enough food, but we know, if we just ate less meat and fed less of the crops to animals, there is enough food for everybody as long as we think of ourselves as one group of people.
Questa è una mappa di dove coltiviamo il cibo nel mondo. Queste sono le aree su cui contiamo di più per riso, mais e grano. La gente si preoccupa che non ci sarà abbastanza cibo, ma si sa, se solo mangiassimo meno carne e dessimo meno mangime agli animali, ci sarebbe abbastanza cibo per tutti fintanto che si pensa a noi come a un gruppo di persone.
And we also know about what we do so terribly badly nowadays. You will have seen this map of the world before. This is the map produced by taking satellite images, if you remember those satellites around the planet in the very first slide I showed, and producing an image of what the Earth looks like at night. When you normally see that map, on a normal map, the kind of map that most of you will be used to, you think you are seeing a map of where people live. Where the lights are shining up is where people live. But here, on this image of the world, remember we've stretched the map again. Everywhere has the same density of people on this map. If an area doesn't have people, we've shrunk it away to make it disappear. So we're showing everybody with equal prominence. Now, the lights no longer show you where people are, because people are everywhere. Now the lights on the map, the lights in London, the lights in Cairo, the lights in Tokyo, the lights on the Eastern Seaboard of the United States, the lights show you where people live who are so profligate with energy that they can afford to spend money powering lights to shine up into the sky, so satellites can draw an image like this. And the areas that are dark on the map are either areas where people do not have access to that much energy, or areas where people do, but they have learned to stop shining the light up into the sky. And if I could show you this map animated over time, you would see that Tokyo has actually become darker, because ever since the tsunami in Japan, Japan has had to rely on a quarter less electricity because it turned the nuclear power stations off. And the world didn't end. You just shone less light up into the sky.
E si sa anche cosa facciamo di così terribilmente sbagliato ora. Avrete visto prima questa mappa del mondo. Questa è la mappa realizzata prendendo le immmagini dai satelliti, se vi ricordate quei satelliti attorno al pianeta nella prima immagine che vi ho mostrato, e realizzando un'immagine di come la Terra appare di notte. Quando si vede di norma quella mappa, su una mappa normale, il tipo a cui molti di voi sono abituati, si pensa di vedere una mappa di dove vive la gente. Le luci brillano lì dove vive la gente. Ma qui, su questa immagine del mondo, abbiamo allungato di nuovo la mappa. In ogni luogo di questa mappa vi è la stessa densità di persone. Se in un'area non ci sono persone l'abbiamo ristretta in modo da farla sparire. Così stiamo dando a ciascuno la stessa importanza. Ora, le luci non vi mostrano più dove la gente sta, poichè è dovunque. Ora le luci sulla mappa, le luci di Londra, del Cairo, di Tokio, le luci della Costa Est degli USA, le luci mostrano dove vive la gente che è così sregolata con l'energia che può permettersi di spendere del denaro per illuminare con le luci il cielo, così che i satelliti possono produrre un'immagine come questa. Le aree scure sulla mappa sono sia quelle dove la gente non ha accesso a così tanta energia, o aree dove la gente può, ma ha imparato a smettere di illuminare con le luci il cielo. E se potessi mostrarvi questa mappa con un'animazione nel tempo, vedreste che Tokio è effettivamente diventata più scura, perchè da dopo lo tsunami, il Giappone ha dovuto fare a meno di un quarto di energia perché ha spento le centrali nucleari. E il mondo non è finito. Vedete solo brillare meno luce nel cielo.
There are a huge number of good news stories in the world. Infant mortality is falling and has been falling at an incredible rate. A few years ago, the number of babies dying in their first year of life in the world fell by five percent in just one year. More children are going to school and learning to read and write and getting connected to the Internet and going on to go to university than ever before at an incredible rate, and the highest number of young people going to university in the world are women, not men. I can give you good news story after good news story about what is getting better in the planet, but we tend to concentrate on the bad news that is immediate. Rebecca Solnit, I think, put it brilliantly, when she explained: "The accretion of incremental, imperceptible changes which can constitute progress and which render our era dramatically different from the past" -- the past was much more stable -- "a contrast obscured by the undramatic nature of gradual transformation, punctuated by occasional tumult." Occasionally, terrible things happen. You are shown those terrible things on the news every night of the week. You are not told about the population slowing down. You are not told about the world becoming more connected. You are not told about the incredible improvements in understanding. You are not told about how we are learning to begin to waste less and consume less.
Vi è un grande numero di buone notizie nel mondo. La mortalità infantile sta diminuendo e sta diminuendo in modo incredibilmente veloce. Qualche anno fa, il numero di bambini morti nel primo anno di vita nel mondo cadde del 5% in appena un anno. Sempre più bambini vanno a scuola e imparano a leggere e scrivere e a connettersi ad Internet e ad andare all'università rispetto a prima a un ritmo incredibile, e il più alto numero di giovani nel mondo che vanno all'università sono donne, non uomini. Vi posso dare buone notizie dopo buone notizie su cosa sta andando meglio sul pianeta, ma tendiamo a concentrarci sulle cattive notizie che sono immediate. Rebecca Solnit, credo, lo ha posto in modo brillante, quando ha spiegato: "La concrescenza di cambiamenti incrementali impercettibili che costituiscono il progresso e che rendono la nostra era marcatamente diversa dal passato" -- il passato era molto più stabile -- "un contrasto oscurato dalla natura poco evidente di una trasformazione graduale, punteggiata da sporadici tumulti." Saltuariamente, capitano cose terribili. Vi mostrano quelle cose terribili sui notiziari ogni sera della settimana. Non vi dicono che la popolazione sta decrescendo. Non vi dicono che il mondo sta diventando più connesso. Non vi dicono dell'incredibile crescita nel sapere. Non vi dicono di come stiamo imparando a iniziare a ridurre lo spreco e consumare meno.
This is my last map. On this map, we have taken the seas and the oceans out. Now you are just looking at about 7.4 billion people with the map drawn in proportion to those people. You're looking at over a billion in China, and you can see the largest city in the world in China, but you do not know its name. You can see that India is in the center of this world. You can see that Europe is on the edge. And we in Exeter today are on the far edge of the planet. We are on a tiny scrap of rock off Europe which contains less than one percent of the world's adults, and less than half a percent of the world's children. We are living in a stabilizing world, an urbanizing world, an aging world, a connecting world. There are many, many things to be frightened about, but there is no need for us to fear each other as much as we do, and we need to see that we are now living in a new world.
Questa è la mia ultima mappa. Su questa mappa abbiamo tolto mari ed oceani. State ora guardando a circa 7,4 miliardi di persone con la mappa disegnata in proporzione a quelle persone. Ne state guardando circa un miliardo in Cina, e vedete la più grande città del mondo in Cina, ma non sapete il suo nome. Vedete che l'India è al centro di questo mondo. Potete vedere che l'Europa è al limite. Oggi ad Exeter siamo sul limite lontano del pianeta. Siamo su un sottile pezzo di roccia fuori dell'Europa che contiene meno dell' 1% degli adulti del mondo, e meno dello 0,5% dei bambini del mondo. Stiamo vivendo in un mondo che si sta stabilizzando e urbanizzando, un mondo che sta invecchiando, un mondo in connessione. Vi sono moltissime cose di cui aver paura, ma non c'è bisogno di temerci l'un l'altro così tanto come facciamo, e abbiamo bisogno di vedere che ora stiamo vivendo in un nuovo mondo.
Thank you very much.
Molte grazie.
(Applause)
(Applausi)