I'd like you to imagine the world anew. I'd like to show you some maps, which have been drawn by Ben Hennig, of the planet in a way that most of you will never have seen the planet depicted before.
از شما میخواهم که دنیا را یکبار از نو تصور کنید میخواهم به شما چند نقشه نشان دهم، که توسط بن هنینگ از سیاره ما کشیده شده به نحوی که اکثر شما نمیتوانستید آن را به این شکل متصور شوید.
Here's an image that you're very familiar with. I'm old enough that I was actually born before we saw this image. Apparently some of my first words were "moona, moona," but I think that's my mom having a particular fantasy about what her baby boy could see on the flickering black and white TV screen. It's only been a few centuries since we've actually, most of us, thought of our planet as spherical. When we first saw these images in the 1960s, the world was changing at an incredible rate. In my own little discipline of human geography, a cartographer called Waldo Tobler was drawing new maps of the planet, and these maps have now spread, and I'm going to show you one of them now. This map is a map of the world, but it's a map which looks to you a little bit strange. It's a map in which we stretched places, so that those areas which contain many people are drawn larger, and those areas, like the Sahara and the Himalayas, in which there are few people, have been shrunk away. Everybody on the planet is given an equal amount of space. The cities are shown shining bright. The lines are showing you submarine cables and trade routes. And there's one particular line that goes from the Chinese port of Dalian through past Singapore, through the Suez Canal, through the Mediterranean and round to Rotterdam. And it's showing you the route of what was the world's largest ship just a year ago, a ship which was taking so many containers of goods that when they were unloaded, if the lorries had all gone in convoy, they would have been 100 kilometers long. This is how our world is now connected. This is the quantity of stuff we are now moving around the world, just on one ship, on one voyage, in five weeks.
این تصویری است که شما با آن خیلی آشنایید. من سنم بیش از قدمت این تصویر است. ظاهرا یکی از اولین کلماتی که گفتم «مونا، مونا» بوده، اما فکر میکنم این حاصل خیالپردازی مادرم است درباره آنچه پسرش روی تلویزیون سیاه و سفید میتوانست ببیند. فقط چندین قرن است که ما، بیشتر ما توانستهایم سیارهمان را کُرهای در نظر بگیریم. زمانی که در دهه ۶۰ میلادی برای اولین بار این تصاویر را دیدیم دنیا با سرعتی غیرقابل باور در حال تغییر بود. در رشته جغرافیای انسانی، یک نقشه بردار به نام والدو توبلر داشت نقشههای جدیدی از کره زمین میکشید، و این نقشهها حالا گسترده شدند و من میخوام یکی از آنها را به شما نشان دهم این نقشه جهان است اما این نقشهایست که کمی عجیب به نظرتان خواهد آمد. این نقشهایست که در آن مکانهایی که جمعیت بیشتری دارند، بزرگتر کشیده شدهاند، و آن مناطقی که جمعیت کمی دارند مثل صحرا و هیمالیا کوچکتر کشیده شدهاند. به هر فرد برروی کره زمین فضای مساویی اختصاص داده شده. شهرهای بزرگ نورانی نشان داده شده خطوط نقشه نشانه کابلهای زیردریایی و مسیرهای تجاری است. و یک خط به خصوص از بندر دالیان چین به سنگاپور به کانال سوئز به مدیترانه و از آنجا به روتردام میرود. و این مسیر بزرگترین کشتی جهان در سال پیش است کشتیای که حاوی کانتینرهای کالا بسیاری بود، که وقتی بارش خالی شد، کامیونهای حامل بار اگر پشت هم صف میشدند طولشان به ۱۰۰ کیلومتر میرسید. دنیای ما امروز اینگونه به هم متصل است. این حجم و کمیت کالاهایی است که امروزه در سراسر جهان در حال جابهجایی است، تنها در یک کشتی در یک سفرش، در پنج هفته.
We've lived in cities for a very long time, but most of us didn't live in cities. This is Çatalhöyük, one of the world's first cities. At its peak 9,000 years ago, people had to walk over the roofs of others' houses to get to their home. If you look carefully at the map of the city, you'll see it has no streets, because streets are something we invented. The world changes. It changes by trial and error. We work out slowly and gradually how to live in better ways. And the world has changed incredibly quickly most recently. It's only within the last six, seven, or eight generations that we have actually realized that we are a species. It's only within the last few decades that a map like this could be drawn. Again, the underlying map is the map of world population, but over it, you're seeing arrows showing how we spread out of Africa with dates showing you where we think we arrived at particular times. I have to redraw this map every few months, because somebody makes a discovery that a particular date was wrong. We are learning about ourselves at an incredible speed. And we're changing. A lot of change is gradual. It's accretion. We don't notice the change because we only have short lives, 70, 80, if you're lucky 90 years. This graph is showing you the annual rate of population growth in the world. It was very low until around about 1850, and then the rate of population growth began to rise so that around the time I was born, when we first saw those images from the moon of our planet, our global population was growing at two percent a year. If it had carried on growing at two percent a year for just another couple of centuries, the entire planet would be covered with a seething mass of human bodies all touching each other. And people were scared. They were scared of population growth and what they called "the population bomb" in 1968. But then, if you look at the end of the graph, the growth began to slow. The decade -- the '70s, the '80s, the '90s, the noughties, and in this decade, even faster -- our population growth is slowing. Our planet is stabilizing. We are heading towards nine, 10, or 11 billion people by the end of the century. Within that change, you can see tumult. You can see the Second World War. You can see the pandemic in 1918 from influenza. You can see the great Chinese famine. These are the events we tend to concentrate on. We tend to concentrate on the terrible events in the news. We don't tend to concentrate on the gradual change and the good news stories.
ما مدت طولانی است که در شهرها زندگی می کنیم، اما اکثر انسانها در شهرها زندگی نکردهاند. این شهر کاتالهویوک هست، یکی از اولین شهرهای جهان. در اوج خودش در ۹ هزار سال پیش، مردم باید روی سقف دیگران راه می رفتند تا به خانههایشان می رسیدند. اگر با دقت به نقشه شهر نگاه کنید، متوجه میشوید که اینجا هیچ خیابانی نداشت زیرا خیابان بعدا اختراع شد. دنیا در حال تغییر است. و بواسطه آزمون و خطای ما تغییر میکند. ما آهسته و به تدریج در مییابیم که چطور به شکلی بهتر زندگی کنیم. و دنیا با سرعت فوقالعاده زیادی این اواخر در حال تغییر است. تنها در شش، هفت یا هشت نسل اخیر است که ما متوجه شدیم که یک گونه زیستی هستیم. تنها در چند دهه اخیر توانسته ایم نقشهای مثل این را ترسیم کنیم. تکرار میکنم، مبنای این نقشه، نقشه جمیت جهان است، اما روی آن ما فلشهایی میبینیم که نشان میدهد ما چگونه از آفریقا پراکنده شدیم با تاریخهایی که نشان می دهد در چه زمانهایی به جایی که فکر میکنیم، رسیدیم. لازم است من این نقشه را هر چندماه یکبار از نو بکشم، زیرا یک نفر کشف میکند که یک تاریخ در آن اشتباه بوده است. ما با سرعتی باور نکردنی داریم درباره خودمان یاد میگیریم. و ما در حال تغییر کردنیم. بسیاری از تغییرات تدریجی هستند. این درحال افزایش است. ما تغییر را حس نمیکنیم چون عمر ما کوتاه است، ۷۰،۸۰ و اگر خوش شانس باشیم ۹۰ ساله میشویم این نمودار به شما نرخ سالیانه رشد جمعیت جهان را نشان می دهد. این نرخ تا حدود ۱۸۵۰ بسیار پایین است، و سپس نرخ رشد جمعیت شروع به رشد می کند تا اینکه نزدیک به زمان تولد من، زمانی که ما اولین بار تصاویر قمر سیارهمان را دیدیم، جمعیت جهان هر سال ۲ درصد افزوده میشد. اگر این رشد با همین ۲ درصد برای دو قرن ادامه پیدا میکرد، کل سیاره زمین پوشیده از انسانهایی میشد که فاصله ای میانشان نبود و همه با یکدیگر تماس داشتند. و مردم ترسیده بودند. آنها از رشد جمعیت ترسیده بودند چیزی که آنها در ۱۹۶۸ «بمب جمعیت» نامیده بودند. اما بعد، زمانی که به انتهای این نمودار نگاه میکنیم، سرعت رشد کم میشود. دههای -- ۷۰، ۸۰، و ۹۰، و دهه اول هزاره سوم، و در این دهه اخیر، حتی سریعتر، سرعت رشد جمعیت در حال کاهش است. سیاره ما در حالت تثبیت است ما به سمت جمعیت ۹، ۱۰ یا ۱۱ میلیارد نفری در حال حرکتیم تا آخر این قرن. در درون این تغییر هم آشوب نهفته است. جنگ جهانی دوم را به یاد بیاورید. میتوانید همه گیری آنفولانزای ۱۹۱۸ را در نظر بگیرید. یا گرسنگی عظیم در چین را. اینها حوادثی هستند که ما رویشان متمرکزیم. ما معمولا روی اخبار حوادث ناگوار تمرکز میکنیم. و نه بر روی تغییرات تدریجی و نه اخبار خوب.
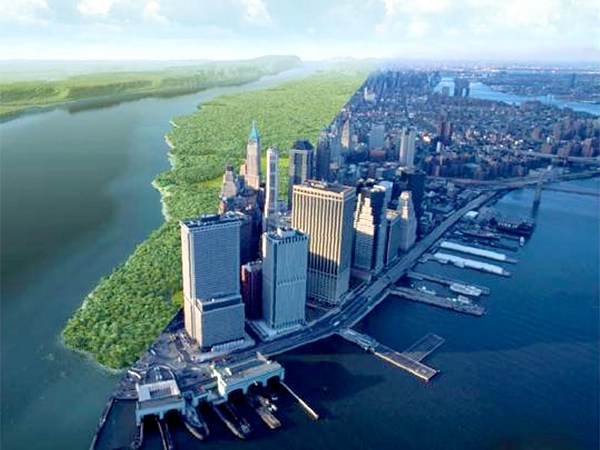
We worry about people. We worry about how many people there are. We worry about how you can get away from people. But this is the map of the world changed again to make area large, the further away people are from each area. So if you want to know where to go to get away from everybody, here's the best places to go. And every year, these areas get bigger, because every year, we are coming off the land globally. We are moving into the cities. We are packing in more densely. There are wolves again in Europe, and the wolves are moving west across the continent. Our world is changing.
ما برای انسانها نگرانیم. ما درباره جمعیت آدمها نگرانیم. ما نگرانیم درباره اینکه چطور از آدمها فرار کنیم. اما این نقشه جهان است که تغییرش داده ایم تا نقاطی را برجسته کنیم که مردم از آنها دورترند. پس اگر می خواهید از مردم دور شوید، اینها بهترین مکانها برای شما هستند. و هر سال این مناطق در حال بزرگتر شدن هستند. زیرا هرسال ما سرزمینهایمان را ترک می کنیم. به شهرها مهاجرت میکنیم. و به شکل متراکم تری زندگی می کنیم. دوباره در اروپا گرگها دیده میشوند، و گرگها به سمت غرب قاره در حال حرکتند. دنیای ما در حال تغییر است.
You have worries. This is a map showing where the water falls on our planet. We now know that. And you can look at where Çatalhöyük was, where three continents meet, Africa, Asia, and Europe, and you can see there are a large number of people living there in areas with very little water. And you can see areas in which there is a great deal of rainfall as well. And we can get a bit more sophisticated. Instead of making the map be shaped by people, we can shape the map by water, and then we can change it every month to show the amount of water falling on every small part of the globe. And you see the monsoons moving around the planet, and the planet almost appears to have a heartbeat. And all of this only became possible within my lifetime to see this is where we are living. We have enough water.
شما نگرانیهایی دارید. این نقشه ای است از مناطق پر آب سیاره ما. ما اکنون این را می دانیم. و شما می توانید ببینید کاتالهویوک قبلا کجا بوده، در نقطه تلاقی قاره آسیا، آفریقا و اروپا و می بینید که جمعیت زیادی در آنجا زندگی می کند در نواحیی با آب بسیار کم و شما مناطق دیگری را میبینید که بارندگی زیادی دارند. و می توانیم کمی از این پیچیدهتر شویم. به جای نقشه ای که براساس انسانها شکل گرفته می توانیم نقشه ای براساس آبها داشته باشیم، و بعد می توانیم هر ماه آن را تغییر دهیم تا مقدار آبی را نشان دهیم که در هر نقطه جهان در جریان است. و می بینید که مانسون ها هم در روی زمین در حرکتند، و به نظر میرسد که سیاره ما ضربان قلبی دارد. و همه اینها تنها در طول زندگی من ممکن شده است اینکه ببینیم داریم کجا زندگی می کنیم. ما آب کافی داریم.
This is a map of where we grow our food in the world. This is the areas that we will rely on most for rice and maize and corn. People worry that there won't be enough food, but we know, if we just ate less meat and fed less of the crops to animals, there is enough food for everybody as long as we think of ourselves as one group of people.
این نقشه ایست که نشان می دهد ما کجا غذایمان را تولید می کنیم. اینها مناطقی هستند که ما روی تولید برنج و غلاتشان تکیه داریم. آدمها نگرانند شاید غذای کافی برای همه نباشد اما ما می دانیم، اگر ما گوشت کمتری بخوریم و غلات کمتری را به عنوان غذای حیوانات مصرف کنیم غذای کافی برای همه ما وجود خواهد داشت تا وقتی که ما خودمان را به عنوان یک جامعه واحد انسانی در نظر بگیریم.
And we also know about what we do so terribly badly nowadays. You will have seen this map of the world before. This is the map produced by taking satellite images, if you remember those satellites around the planet in the very first slide I showed, and producing an image of what the Earth looks like at night. When you normally see that map, on a normal map, the kind of map that most of you will be used to, you think you are seeing a map of where people live. Where the lights are shining up is where people live. But here, on this image of the world, remember we've stretched the map again. Everywhere has the same density of people on this map. If an area doesn't have people, we've shrunk it away to make it disappear. So we're showing everybody with equal prominence. Now, the lights no longer show you where people are, because people are everywhere. Now the lights on the map, the lights in London, the lights in Cairo, the lights in Tokyo, the lights on the Eastern Seaboard of the United States, the lights show you where people live who are so profligate with energy that they can afford to spend money powering lights to shine up into the sky, so satellites can draw an image like this. And the areas that are dark on the map are either areas where people do not have access to that much energy, or areas where people do, but they have learned to stop shining the light up into the sky. And if I could show you this map animated over time, you would see that Tokyo has actually become darker, because ever since the tsunami in Japan, Japan has had to rely on a quarter less electricity because it turned the nuclear power stations off. And the world didn't end. You just shone less light up into the sky.
و ما آگاهیم از آنچه این روزها به طور بدی انجام می دهیم. شما احتمالا قبلتر این نقشه از زمین را دیدهاید. این نقشه ای است که از عکسهای ماهواره ای تهیه شده، اگر که این ماهواره ها را یادتان باشد، در اولین اسلایدی که نشان دادم، و تصویری که از شب کره زمین نشان ما می دهند. زمانی که آن نقشه را می بینید، روی یک نقشه معمولی، از آنهایی که اکثر ما به آنها عادت داریم، شما فکر میکنید دارید نقشه ای از محل زندگی انسانها را میبینید. نقاط پرنور جاهایی هستند که انسانها زندگی می کنند. اما در اینجا، روی این تصویر جهان، حواستان باشد ما باز نقشه را تغییر دادیم، هر نقطه تراکم یکسانی از جمعیت دارد. اگر نقطه ای فاقد جمعیت باشد، ما آنقدر کوچکش کردیم که ناپدید شده. پس ما همه را با یک درجه از اهمیت نشان می دهیم. در این نقشه دیگر نورها نیستند که نشان دهند مردم کجاها متمرکز شده اند، زیرا مردم همه جا هستند. حالا نقاط نورانی روی نقشه نورهای لندن، قاهره، توکیو، نورهای سواحل شرقی ایالات متحده، این نورها نشان می دهند که مردم کجا زندگی می کنند که انباشته از انرژی هستند که می توانند آنقدر پول خرج کنند تا از آسمان هم نورانی به نظر برسند، تا ماهواره ها تصاویر اینچنینی از آنها بگیرند. و نقاطی از نقشه که تاریک است، یا نقاطی است که مردم دسترسی به آنقدر انرژی ندارند، یا نقاطی هستند که مردم دسترسی به انرژي دارند اما یادگرفته اند که نورشان را صرف روشن کردن آسمان نکنند. و اگر میتوانستم این نقشه را به شکل متحرک و در طول زمان نشان بدهم، شما میدیدید که توکیو تاریکتر از قبل شده است زیرا بعد از سونامی ژاپن، ژاپن به سه چهارم الکتریسیته سابقش دسترسی دارد زیرا نیروگاههای هستهای اش را خاموش کرده است. و دنیا به آخر نرسید. شما تنها نور کمتری تولید میکنید و به آسمان میتابانید.
There are a huge number of good news stories in the world. Infant mortality is falling and has been falling at an incredible rate. A few years ago, the number of babies dying in their first year of life in the world fell by five percent in just one year. More children are going to school and learning to read and write and getting connected to the Internet and going on to go to university than ever before at an incredible rate, and the highest number of young people going to university in the world are women, not men. I can give you good news story after good news story about what is getting better in the planet, but we tend to concentrate on the bad news that is immediate. Rebecca Solnit, I think, put it brilliantly, when she explained: "The accretion of incremental, imperceptible changes which can constitute progress and which render our era dramatically different from the past" -- the past was much more stable -- "a contrast obscured by the undramatic nature of gradual transformation, punctuated by occasional tumult." Occasionally, terrible things happen. You are shown those terrible things on the news every night of the week. You are not told about the population slowing down. You are not told about the world becoming more connected. You are not told about the incredible improvements in understanding. You are not told about how we are learning to begin to waste less and consume less.
تعداد انبوهی از خبرهای خوشحال کننده در دنیا شنیده میشود مرگ نوزادان در حال کاهش است و با سرعت غیرقابل تصوری در حال کاهش است. چند سال پیش، تعداد نوزادانی که در سال اول زندگی شان میمردند در یک سال ۵ درصد کاهش یافت. کودکان بیشتری به مدرسه می روند و خواندن و نوشتن می آموزند و به اینترنت متصل می شوند و به دانشگاه می روند و این روندی رو به افزایش است، و بیشترین تعداد جوانانی که امروزه به دانشگاه می روند زنان هستند ، نه مردان من می توانم داستانهای خوشحال کننده بسیاری مثل این به شما بدهم درباره اتفاقات خوبی که در سیاره ما در حال رخ دادن است اما ما مستعد تمرکز بر اخبار بد و قریب الوقوع هستیم. ربکا سولنیت، به نظر این را به زیبایی بیان کرده است، زمانی که توضیح می دهد، «انباشتگی تدریجی تغییرات جزيي که دوران ما را به شکلی جدی نسبت به گذشته تغییر دادهاند»-- گذشته زمانی باثبات تر بوده -- «نادیده گرفته میشود بخاطر ماهیت غیردراماتیک تغییرات تدریجی و تمایز آن با حوادث شدید و گاه به گاه.» گاه گاه، اتفاقات ناگواری میافتد. شما این اتفاقات را هرشب هفته در اخبار می بینید. به شما درباره کاهش سرعت رشد جمعیت گفته نمیشود. به شما درباره یکپارچه شدن بیشتر جهان گفته نمی شود. به شما درباره بهبود غیرقابل تصور در شناخت انسان گفته نمی شود. به شما گفته نمی شود که ما در حال یاد گرفتن این هستیم که کمتر آشغال تولید کنیم و کمتر مصرف کنیم.
This is my last map. On this map, we have taken the seas and the oceans out. Now you are just looking at about 7.4 billion people with the map drawn in proportion to those people. You're looking at over a billion in China, and you can see the largest city in the world in China, but you do not know its name. You can see that India is in the center of this world. You can see that Europe is on the edge. And we in Exeter today are on the far edge of the planet. We are on a tiny scrap of rock off Europe which contains less than one percent of the world's adults, and less than half a percent of the world's children. We are living in a stabilizing world, an urbanizing world, an aging world, a connecting world. There are many, many things to be frightened about, but there is no need for us to fear each other as much as we do, and we need to see that we are now living in a new world.
این آخرین نقشه من است. در این نقشه، ما دریاها و اقیانوس ها را حذف کردیم. حالا فقط داریم به حدود ۷.۴ میلیادر جمعیت انسانی نگاه می کنیم با نقشه ای که متناسب با این افراد ترسیم شده است. شما به یک میلیارد جمعیت در چین نگاه می کنید. و میتوانید بزرگترین شهر دنیا را در چین ببینید، اما اسمش را نمی دانید. شما می بینید که هند مرکز این دنیاست. و میبینید که اروپا در حاشیه قرار گرفته. و ما در اکستر امروز نیز در حاشیه این سیاره قرار داریم. ما روی یک خرده سنگ کوچکیم خارج اروپا که حاوی کمتر از ۱ درصد از جمعیت بزرگسال جهان است، و کمتر از نیم درصد از جمعیت خردسال است. ما در دنیایی در حال ثبات یافتن و شهری شدن زندگی می کنیم، دنیای در حال پیر شدن، در حال به هم متصل شدن. مواردی بیشماری وجود دارد برای اینکه از آنها بترسیم، اما لازم نیست از همدیگر انقدر بترسیم، و لازم است که ما ببینیم که داریم در یک دنیای جدید زندگی می کنیم.
Thank you very much.
بسیار متشکرم.
(Applause)
(تشویق)