I'd like you to imagine the world anew. I'd like to show you some maps, which have been drawn by Ben Hennig, of the planet in a way that most of you will never have seen the planet depicted before.
Me gustaría que volviéramos a imaginar el mundo. Me gustaría mostrarles algunos mapas dibujados por Ben Hennig que representan a nuestro planeta de una manera que nadie ha imaginado.
Here's an image that you're very familiar with. I'm old enough that I was actually born before we saw this image. Apparently some of my first words were "moona, moona," but I think that's my mom having a particular fantasy about what her baby boy could see on the flickering black and white TV screen. It's only been a few centuries since we've actually, most of us, thought of our planet as spherical. When we first saw these images in the 1960s, the world was changing at an incredible rate. In my own little discipline of human geography, a cartographer called Waldo Tobler was drawing new maps of the planet, and these maps have now spread, and I'm going to show you one of them now. This map is a map of the world, but it's a map which looks to you a little bit strange. It's a map in which we stretched places, so that those areas which contain many people are drawn larger, and those areas, like the Sahara and the Himalayas, in which there are few people, have been shrunk away. Everybody on the planet is given an equal amount of space. The cities are shown shining bright. The lines are showing you submarine cables and trade routes. And there's one particular line that goes from the Chinese port of Dalian through past Singapore, through the Suez Canal, through the Mediterranean and round to Rotterdam. And it's showing you the route of what was the world's largest ship just a year ago, a ship which was taking so many containers of goods that when they were unloaded, if the lorries had all gone in convoy, they would have been 100 kilometers long. This is how our world is now connected. This is the quantity of stuff we are now moving around the world, just on one ship, on one voyage, in five weeks.
Aquí se ve una imagen que muchos conocen. Yo nací antes de que esta imagen sea pública. Al parecer, "moona, moona" fueron algunas de mis primeras palabras pero creo que es una fantasía en concreto de mi madre sobre lo que su pequeño niño podía ver en la pantalla de TV en blanco y negro. No hace mucho tiempo que imaginamos que nuestro planeta era esférico. Cuando vimos estas imágenes por primera vez en la década de 1960, el mundo estaba cambiando a un ritmo increíble. En mi pequeña disciplina, la geografía humana, un cartógrafo llamado Waldo Tobler estaba dibujando nuevos mapas del planeta, ahora muy usados, y les mostraré uno de ellos. Este es un mapamundi pero un tanto extraño. Es un mapa en el que se estiraron algunas superficies para que las áreas más pobladas se vean más grandes, y otras como el Sahara y el Himalaya menos pobladas, se han reducido. Todo el mundo cuenta con la misma superficie terrestre. Las ciudades se muestran en colores brillantes. Las líneas muestran la presencia de cables submarinos y rutas comerciales. Y hay una línea en particular que va desde el puerto chino de Dalian pasando por Singapur, a través del Canal de Suez, a través del Mediterráneo y de vuelta a Róterdam. Y está mostrando la ruta de lo que fue la nave más grande del mundo hace un año, un buque que estaba transportando tantos contenedores de mercancías que una vez descargados, si los camiones hubieran sido alineados, se hubiera formado una línea de 100 kilómetros de largo. Así es como nuestro mundo está ahora conectado. Esta es la cantidad de cosas que ahora estamos moviendo por el mundo, solo en un barco, en un viaje, en cinco semanas.
We've lived in cities for a very long time, but most of us didn't live in cities. This is Çatalhöyük, one of the world's first cities. At its peak 9,000 years ago, people had to walk over the roofs of others' houses to get to their home. If you look carefully at the map of the city, you'll see it has no streets, because streets are something we invented. The world changes. It changes by trial and error. We work out slowly and gradually how to live in better ways. And the world has changed incredibly quickly most recently. It's only within the last six, seven, or eight generations that we have actually realized that we are a species. It's only within the last few decades that a map like this could be drawn. Again, the underlying map is the map of world population, but over it, you're seeing arrows showing how we spread out of Africa with dates showing you where we think we arrived at particular times. I have to redraw this map every few months, because somebody makes a discovery that a particular date was wrong. We are learning about ourselves at an incredible speed. And we're changing. A lot of change is gradual. It's accretion. We don't notice the change because we only have short lives, 70, 80, if you're lucky 90 years. This graph is showing you the annual rate of population growth in the world. It was very low until around about 1850, and then the rate of population growth began to rise so that around the time I was born, when we first saw those images from the moon of our planet, our global population was growing at two percent a year. If it had carried on growing at two percent a year for just another couple of centuries, the entire planet would be covered with a seething mass of human bodies all touching each other. And people were scared. They were scared of population growth and what they called "the population bomb" in 1968. But then, if you look at the end of the graph, the growth began to slow. The decade -- the '70s, the '80s, the '90s, the noughties, and in this decade, even faster -- our population growth is slowing. Our planet is stabilizing. We are heading towards nine, 10, or 11 billion people by the end of the century. Within that change, you can see tumult. You can see the Second World War. You can see the pandemic in 1918 from influenza. You can see the great Chinese famine. These are the events we tend to concentrate on. We tend to concentrate on the terrible events in the news. We don't tend to concentrate on the gradual change and the good news stories.
Vivimos en ciudades desde hace mucho tiempo, pero la mayoría de nosotros no vivimos en ciudades. Esta es Çatalhöyük, una de las primeras ciudades del mundo. Hace 9000 años, en su apogeo, la gente tenía que caminar sobre los techos de las casas de otros para llegar a la suya. Si miramos con atención el mapa de la ciudad, veremos que no tiene calles, porque es una invención moderna. El mundo cambia. Cambia a base del método empírico. Nos damos cuenta despacio y poco a poco cómo vivir de la mejor manera. Y el mundo ha cambiado muy rápidamente recientemente. Solo en las últimas seis, siete u ocho generaciones, nos dimos cuenta de que en realidad somos una especie, y solo en las últimas décadas de que un mapa como este podría dibujarse. El mapa en el que se basa todo esto es el mapa de la población mundial, pero sobre él, están viendo flechas que indican cómo empezamos en África y fechas que muestran hasta dónde creemos que llegamos en ciertos momentos históricos. Tengo que volver a corregir este mapa cada pocos meses, porque siempre se descubren fechas que requieren una versión actualizada. Estamos aprendiendo sobre nosotros mismos a una velocidad increíble. Y estamos cambiando. Gran parte de este cambio es gradual. Es por acumulación. No notamos dicho cambio debido a que una vida humana es corta: vivimos 70, 80, y si tienes suerte, 90 años. Esta gráfica está mostrando la tasa anual de crecimiento de la población mundial. El ritmo fue muy bajo hasta alrededor de 1850, pero luego la tasa de crecimiento de la población comenzó a aumentar, de modo que en la época en la que nací, -- la primera vez que vimos esas imágenes desde la luna de nuestro planeta -- la población global estaba creciendo a un ritmo de 2 % al año. Si continuara creciendo a la misma velocidad durante solo un par de siglos, el planeta entero estaría ahora cubierto por un hervidero de cuerpos humanos todos amontonados. Y la gente estaba asustada. En 1968, temían este ritmo llamado "la bomba de población". No obstante, al final del gráfico se ve que esta tasa comenzó a disminuir. En la década de los años 70, 80,90, y la de 2000 a 2010 -- y en esta última, incluso más rápido -- nuestro crecimiento demográfico está desacelerando. Nuestro planeta se está estabilizando. Llegaremos a nueve, 10, u 11 000 millones de personas hasta el final del siglo. Y en medio de ese cambio, se puede ver el caos: la Segunda Guerra Mundial, la pandemia de la gripe del 1918, la gran hambruna china. Estos son los eventos en los que tendemos a fijarnos en las noticias en lugar de concentrarnos en el cambio gradual y las buenas noticias.
We worry about people. We worry about how many people there are. We worry about how you can get away from people. But this is the map of the world changed again to make area large, the further away people are from each area. So if you want to know where to go to get away from everybody, here's the best places to go. And every year, these areas get bigger, because every year, we are coming off the land globally. We are moving into the cities. We are packing in more densely. There are wolves again in Europe, and the wolves are moving west across the continent. Our world is changing.
Nos preocupamos por los números, por la población total, por cómo alejarse de la gente. Pero una vez más así se ve el mapamundi donde un área aumenta en su superficie cuanto más lejos se encuentra de otra. Así que si quieres saber a dónde ir si buscas lugares más aislados, aquí están reflejados los mejores. Y cada año, estas áreas aumentan en superficie, porque cada año estamos abandonando las zonas rurales. Nos estamos mudando a las ciudades, vivimos en zonas que tienen densidades altas de población. En Europa, ha subido la población de lobos que ahora atraviesan el continente hacia el oeste. Nuestro mundo está cambiando.
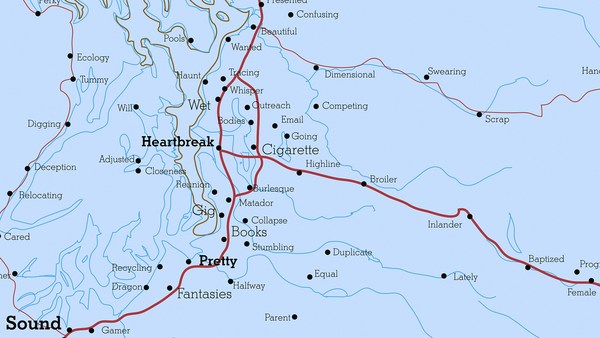
You have worries. This is a map showing where the water falls on our planet. We now know that. And you can look at where Çatalhöyük was, where three continents meet, Africa, Asia, and Europe, and you can see there are a large number of people living there in areas with very little water. And you can see areas in which there is a great deal of rainfall as well. And we can get a bit more sophisticated. Instead of making the map be shaped by people, we can shape the map by water, and then we can change it every month to show the amount of water falling on every small part of the globe. And you see the monsoons moving around the planet, and the planet almost appears to have a heartbeat. And all of this only became possible within my lifetime to see this is where we are living. We have enough water.
Hay cosas que nos preocupan. Este es un mapa que muestra donde llueve en nuestro planeta. Ahora lo sabemos. Si miramos dónde estaba ubicado Çatalhöyük, en la confluencia de tres continentes, África, Asia y Europa, se puede ver que hay muchas personas que viven allí en áreas con recursos escasos en agua. También se ven las áreas en las que hay una gran cantidad de precipitaciones. Y podemos ser un poco más sofisticados. En lugar de dibujar el mapa en función de la población, podemos hacerlo en base al agua y luego cambiarlo cada mes para mostrar la cantidad de las precipitaciones en cada rincón del globo. Podemos observar los monzones que se mueve por el planeta, y el planeta que parece ser un corazón que late. Y todo esto solo se volvió posible durante mi vida, y ver este lugar en el que vivimos. Tenemos suficiente agua.
This is a map of where we grow our food in the world. This is the areas that we will rely on most for rice and maize and corn. People worry that there won't be enough food, but we know, if we just ate less meat and fed less of the crops to animals, there is enough food for everybody as long as we think of ourselves as one group of people.
Este es un mapa según los cultivos, y vemos que las áreas en las que nos basaremos cada vez más son las de arroz y maíz. La gente teme que no habrá suficiente comida, pero sabemos que si comemos menos carne y reducimos las raciones para animales hay suficiente comida para todos siempre que pensemos en nosotros mismos como una comunidad.
And we also know about what we do so terribly badly nowadays. You will have seen this map of the world before. This is the map produced by taking satellite images, if you remember those satellites around the planet in the very first slide I showed, and producing an image of what the Earth looks like at night. When you normally see that map, on a normal map, the kind of map that most of you will be used to, you think you are seeing a map of where people live. Where the lights are shining up is where people live. But here, on this image of the world, remember we've stretched the map again. Everywhere has the same density of people on this map. If an area doesn't have people, we've shrunk it away to make it disappear. So we're showing everybody with equal prominence. Now, the lights no longer show you where people are, because people are everywhere. Now the lights on the map, the lights in London, the lights in Cairo, the lights in Tokyo, the lights on the Eastern Seaboard of the United States, the lights show you where people live who are so profligate with energy that they can afford to spend money powering lights to shine up into the sky, so satellites can draw an image like this. And the areas that are dark on the map are either areas where people do not have access to that much energy, or areas where people do, but they have learned to stop shining the light up into the sky. And if I could show you this map animated over time, you would see that Tokyo has actually become darker, because ever since the tsunami in Japan, Japan has had to rely on a quarter less electricity because it turned the nuclear power stations off. And the world didn't end. You just shone less light up into the sky.
Y también sabemos qué es lo que hacemos tan mal hoy en día. Habrán visto este mapamundi antes. Este es el mapa a base de imágenes satelitales -- si recuerdan a esos satélites alrededor del planeta de la primera diapositiva que mostré -- que producen una imagen del aspecto de la Tierra por la noche. Normalmente, al ver ese mapa -- en un mapa normal, el tipo de mapa al que estamos acostumbrados -- creemos que estamos viendo un mapa donde vive la gente, que donde hay luces brillando es donde vive la gente. Pero aquí, en esta imagen del mundo, recuerden que hemos estirado el mapa de nuevo. Todo en este mapa presenta la misma densidad de población. Si un área no está poblada, la disminuimos, la hicimos desaparecer. Así que mostramos a todos por igual. Ahora, las luces ya no muestran dónde hay gente, porque están en todas partes. Ahora las luces en el mapa, las luces en Londres, en El Cairo, en Tokio, las luces en la costa este de EE.UU. muestran dónde vive la gente que derrocha tanta energía que puede permitirse gastar dinero en iluminar el cielo para que los satélites puedan dibujar una imagen como esta. Y las áreas oscuras en el mapa son las áreas donde la gente no tienen acceso a tanta energía, o áreas donde la gente sí lo tiene, pero aprendieron a dejar de despilfarrar energía. Y si pudiera mostrarles este mapa animado en el tiempo, verían que Tokio se ha vuelto más oscuro, porque desde el tsunami en Japón, el país ha tenido que confiar en solo tres cuartos de su electricidad al apagar las centrales nucleares. Y no fue el fin del mundo. Solo es iluminar menos el cielo.
There are a huge number of good news stories in the world. Infant mortality is falling and has been falling at an incredible rate. A few years ago, the number of babies dying in their first year of life in the world fell by five percent in just one year. More children are going to school and learning to read and write and getting connected to the Internet and going on to go to university than ever before at an incredible rate, and the highest number of young people going to university in the world are women, not men. I can give you good news story after good news story about what is getting better in the planet, but we tend to concentrate on the bad news that is immediate. Rebecca Solnit, I think, put it brilliantly, when she explained: "The accretion of incremental, imperceptible changes which can constitute progress and which render our era dramatically different from the past" -- the past was much more stable -- "a contrast obscured by the undramatic nature of gradual transformation, punctuated by occasional tumult." Occasionally, terrible things happen. You are shown those terrible things on the news every night of the week. You are not told about the population slowing down. You are not told about the world becoming more connected. You are not told about the incredible improvements in understanding. You are not told about how we are learning to begin to waste less and consume less.
Hay muchas buenas historias para las noticias en el mundo. La mortalidad infantil está disminuyendo y ha ido haciéndolo a un ritmo increíble. Hace unos años, el número de bebés que morían en su primer año de vida en el mundo cayó un 5 % en solo un año. Más niños van a la escuela y aprenden a leer y escribir, se conectan a Internet, y van a la universidad más que nunca, a un ritmo increíble, y el mayor número de jóvenes que van a la universidad en el mundo son mujeres, no hombres. Les puedo dar una buena noticia tras otra acerca de lo que está mejorando en el mundo, pero tendemos a concentrarnos en las malas noticias que son inmediatas. Rebecca Solnit, creo, lo explicó de un modo brillante cuando dijo: "La acumulación de cambios graduales, imperceptibles que pueden contribuir al progreso y que hacen que nuestra era sea dramáticamente diferente del pasado" -- el pasado era mucho más estable -- un contraste eclipsado solo por la naturaleza poco dramática de la transformación gradual, y marcado por disturbios ocasionales". De vez en cuando, ocurren cosas terribles y estas se muestran en las noticias todas las noches de la semana. No nos dicen nada acerca de la disminución de la población. de que el mundo está cada vez más conectado, de las increíbles mejoras en la comprensión, acerca de cómo estamos aprendiendo a desperdiciar menos y consumir menos.
This is my last map. On this map, we have taken the seas and the oceans out. Now you are just looking at about 7.4 billion people with the map drawn in proportion to those people. You're looking at over a billion in China, and you can see the largest city in the world in China, but you do not know its name. You can see that India is in the center of this world. You can see that Europe is on the edge. And we in Exeter today are on the far edge of the planet. We are on a tiny scrap of rock off Europe which contains less than one percent of the world's adults, and less than half a percent of the world's children. We are living in a stabilizing world, an urbanizing world, an aging world, a connecting world. There are many, many things to be frightened about, but there is no need for us to fear each other as much as we do, and we need to see that we are now living in a new world.
Este es mi último mapa. En este mapa, faltan los mares y los océanos. Ahora solo están mirando a los 7400 millones de personas donde el mapa refleja la proporción entre ellas. Están viendo a los más de mil millones en China, y a la mayor ciudad china del mundo, pero no saben cómo se llama. Pueden ver que India está en el centro de este mundo, que Europa está en un extremo, y que nosotros, hoy aquí en Exeter, estamos en el extremo más alejado del planeta. Somos un pequeño fragmento de roca a las afueras europeas que contiene menos del 1 % de todos los adultos del mundo y menos de 0,5 % de todos los niños del mundo. Estamos viviendo en un mundo estable, urbano, que envejece, un mundo conectado. Hay muchas, muchas cosas que temer, pero no hace falta tener tanto miedo los unos de los otros como lo hacemos y tenemos que ver que ahora estamos viviendo en un mundo nuevo.
Thank you very much.
Muchas gracias.
(Applause)
(Aplausos)