Back in 2003, the UK government carried out a survey. And it was a survey that measured levels of numeracy in the population. And they were shocked to find out that for every 100 working age adults in the country, 47 of them lacked Level 1 numeracy skills. Now, Level 1 numeracy skills -- that's low-end GCSE score. It's the ability to deal with fractions, percentages and decimals. So this figure prompted a lot of hand-wringing in Whitehall. Policies were changed, investments were made, and then they ran the survey again in 2011. So can you guess what happened to this number? It went up to 49.
在2003年, 英國政府進行了一項調查。 主要是調查 國民的算數能力。 他們驚訝地發現, 該國的成年就業者當中, 平均100個裡面有47個 缺乏等級一的算數能力。 等級一算數能力, 相當於低階的國中數學能力。 這個等級代表你會計算 分數、百分比、小數點。 這個數據讓英國政府緊張地手心冒汗。 不但改變了政策、 也編訂了預算, 然後,在2011年他們再調查一遍。 各位猜猜,數字變到多少? 上升到49。
(Laughter)
(笑聲)
And in fact, when I reported this figure in the FT, one of our readers joked and said, "This figure is only shocking to 51 percent of the population."
事實上,當我把這數據 刊登在金融時報後, 我們其中一位讀者開玩笑地說, 「這個數據只嚇到 51% 的人。」
(Laughter)
(笑聲)
But I preferred, actually, the reaction of a schoolchild when I presented at a school this information, who raised their hand and said, "How do we know that the person who made that number isn't one of the 49 percent either?"
但我實際上更喜歡一個小學生的反應, 當我在他的學校演講提到這件事情時, 他舉手問說, 「我們如何知道,算出這個數據的人 會不會也是在 49% 裡面的人?」
(Laughter)
(笑聲)
So clearly, there's a numeracy issue, because these are important skills for life, and a lot of the changes that we want to introduce in this century involve us becoming more comfortable with numbers.
所以很明顯的,算術能力不足問題相當嚴重, 因為在我們人生中, 這些都是很重要的技能, 而且,我們想要介紹的這個世紀的許多變化 需要我們能夠更自在地面對數字。
Now, it's not just an English problem. OECD this year released some figures looking at numeracy in young people, and leading the way, the USA -- nearly 40 percent of young people in the US have low numeracy. Now, England is there too, but there are seven OECD countries with figures above 20 percent. That is a problem, because it doesn't have to be that way. If you look at the far end of this graph, you can see the Netherlands and Korea are in single figures. So there's definitely a numeracy problem that we want to address.
這不僅是英國的問題。 OECD(經濟合作與發展組織) 今年也發佈了一些年輕人的算數能力數據, 美國第一名, 他們將近有40%的年輕人算數能力有問題。 英國也差不多, 總共有七個OECD的會員國, 他們的數據都高於 20% 。 這問題很嚴重,因為不該如此。 如果你仔細看這張圖表的末端, 你可以看到荷蘭跟韓國的數據只有個位數。 所以我們必須解決這個有關數學程度的問題。
Now, as useful as studies like these are, I think we risk herding people inadvertently into one of two categories; that there are two kinds of people: those people that are comfortable with numbers, that can do numbers, and the people who can't. And what I'm trying to talk about here today is to say that I believe that is a false dichotomy. It's not an immutable pairing. I think you don't have to have tremendously high levels of numeracy to be inspired by numbers, and that should be the starting point to the journey ahead.
然而,就算這些報告很有用, 我認為我們把人類分成這兩類是有風險的; 就只是這兩類: 一類是能自在地面對數字的人,會算數的人, 另一類是不會算數的人。 而我今天要談的是, 我認為這樣的兩分法是錯誤的。 這兩類人不會永遠都如此。 我認為你不需要懂高階數學, 也能被數字所啟發, 而且,這應該是未來旅程的起點。
And one of the ways in which we can begin that journey, for me, is looking at statistics. Now, I am the first to acknowledge that statistics has got somewhat of an image problem.
開啟這趟旅程的其中一個方法, 對我而言, 就是觀察統計數據。 我應該是第一個說 統計比較像是個圖像問題的人。
(Laughter)
(笑聲)
It's the part of mathematics that even mathematicians don't particularly like, because whereas the rest of maths is all about precision and certainty, statistics is almost the reverse of that. But actually, I was a late convert to the world of statistics myself. If you'd asked my undergraduate professors what two subjects would I be least likely to excel in after university, they'd have told you statistics and computer programming, and yet here I am, about to show you some statistical graphics that I programmed.
它是數學的一部分, 但是數學家並不特別喜歡統計, 因為其它的數學講究的是 精準性及確定性, 而統計幾乎是相反的。 但實際上,我自己是比較晚愛上統計的。 如果你問我的大學教授 我畢業後兩個最不可能會 成為我日後強項的科目, 他們會告訴你,是統計及電腦編程, 但我今天來這邊,是要向各位展示一些 我編程的統計資料圖表。
So what inspired that change in me? What made me think that statistics was actually an interesting thing? It's really because statistics are about us. If you look at the etymology of the word statistics, it's the science of dealing with data about the state or the community that we live in. So statistics are about us as a group, not us as individuals. And I think as social animals, we share this fascination about how we as individuals relate to our groups, to our peers. And statistics in this way are at their most powerful when they surprise us.
那到底是什麼改變了我? 是什麼事讓我覺得統計真的很有趣? 那是因為統計跟我們有關。 如果你有去查「統計」這個詞的詞源意義, 它是一門有關 我們生活周遭的數據科學。 所以統計是有關我們群體, 而不是我們個人。 我認為身為群居動物的我們, 我們每個人都很想知道, 我們個人與團體、同儕之間 有什麼關聯性。 而這也是統計在這些方面最有力, 那麼另人驚訝。
And there's been some really wonderful surveys carried out recently by Ipsos MORI in the last few years. They did a survey of over 1,000 adults in the UK, and said, for every 100 people in England and Wales, how many of them are Muslim? Now the average answer from this survey, which was supposed to be representative of the total population, was 24. That's what people thought. British people think 24 out of every 100 people in the country are Muslim. Now, official figures reveal that figure to be about five. So there's this big variation between what we think, our perception, and the reality as given by statistics. And I think that's interesting. What could possibly be causing that misperception?
最近有一些很棒的調查, 是由 Ipsos MORI(英國的市場調查公司) 近幾年所進行的調查。 他們對一千多位英國民眾進行了訪問, 問他們說,「你認為住在英格蘭及威爾斯的 每一百個人中,平均有多少人是穆斯林(回教徒)?」 在這次的調查中, 這些可以代表大多數人的受訪民眾, 他們認為應該有 24% 。 這是人們的想法。 英國人認為每一百個人當中 有 24 個是穆斯林。 但官方的統計數字大約只有 5 。 所以我們認為的觀念與 實際上的統計有著很大的差距。 所以我認為這很有趣, 到底是什麼原因造成這樣的認知差距?
And I was so thrilled with this study, I started to take questions out in presentations. I was referring to it. Now, I did a presentation at St. Paul's School for Girls in Hammersmith, and I had an audience rather like this, except it was comprised entirely of sixth-form girls. And I said, "Girls, how many teenage girls do you think the British public think get pregnant every year?" And the girls were apoplectic when I said the British public think that 15 out of every 100 teenage girls get pregnant in the year. And they had every right to be angry, because in fact, I'd have to have closer to 200 dots before I could color one in, in terms of what the official figures tell us.
我對這樣的研究相當感興趣。 我在每次的演講中, 都會提出類似的相關問題。 之前,我到阿姆斯特丹的聖保羅學校, 向學校的女同學做了一次演講, 聽眾人數和在座的差不多, 除了他們都是六年級的女學生。 我問她們,「女孩子們, 你們猜一下,英國大眾認為 英國的未成年女生每年懷孕的人數有多少?」 那些女孩子們聽到我的回答,幾乎要中風了, 我說,「英國大眾認為你們平均每年 100 個人裡面有 15 個人會懷孕。」 她們的確有權力表達她們的憤怒, 因為事實上, 根據官方的數據, 我必須有將近200個圓點 [官方數據:每一百人中有0.6人] 才能在其中一個上色。
And rather like numeracy, this is not just an English problem. Ipsos MORI expanded the survey in recent years to go across the world. And so, they asked Saudi Arabians, for every 100 adults in your country, how many of them are overweight or obese? And the average answer from the Saudis was just over a quarter. That's what they thought. Just over a quarter of adults are overweight or obese. The official figures show, actually, it's nearer to three-quarters.
算術能力不是只有英國才有的問題。 MORI市場調查公司,最近這幾年, 也到全世界進行其它調查。 他們去問沙烏地阿拉伯人: 在你們國家的成年人當中, 平均每100人有多少人是 體重過重或肥胖的? 那些沙烏地阿拉伯人回答: 平均應該比四分之一多一點, 這是他們自己認為的數字, 只有 28% 的人是有體重過重或肥胖的問題。 實際上,官方數據是將近四分之三,
(Laughter)
(笑聲)
So again, a big variation.
所以你看,差距很大。
And I love this one: they asked in Japan, they asked the Japanese, for every 100 Japanese people, how many of them live in rural areas? The average was about a 50-50 split, just over halfway. They thought 56 out of every 100 Japanese people lived in rural areas. The official figure is seven.
我喜歡這一個,他們問日本人說: 「每100個日本人中, 有多少人住在農村地區?」 他們說大概 50-50 ,差不多剛過半。 他們認為每 100 個人中, 有 56 個人住在農村地區。 但官方數據只有 7 。
So extraordinary variations, and surprising to some, but not surprising to people who have read the work of Daniel Kahneman, for example, the Nobel-winning economist. He and his colleague, Amos Tversky, spent years researching this disjoint between what people perceive and the reality, the fact that people are actually pretty poor intuitive statisticians. And there are many reasons for this. Individual experiences, certainly, can influence our perceptions, but so, too, can things like the media reporting things by exception, rather than what's normal. Kahneman had a nice way of referring to that. He said, "We can be blind to the obvious" -- so we've got the numbers wrong -- "but we can be blind to our blindness about it." And that has enormous repercussions for decision making.
如此大的差距,讓有些人很驚訝, 但有些人看到這個數據時並會不感到驚訝, 像是,諾貝爾獎經濟得主,丹尼爾·卡尼曼。 他和他的同事,阿姆斯·特爾斯基, 花了好幾年的時間研究 人們的主觀與實際上的差距, 他們發現, 人們在對統計方面的直覺度相當薄弱。 這有很多原因。 個人經歷,肯定會影響我們的觀念, 同時,媒體對於例外事件的報導, 而不是平常的事, 也會影響我們的觀念。 關於這一點,卡尼曼有一個很好的比喻。 他說,「我們經常無視於明顯的事情—— 所以,我們都猜錯了數字—— 但我們若對我們的無知也一無所知, 那就真的太瞎了。」 而且這對你做決定,會有很大的影響。
So at the statistics office while this was all going on, I thought this was really interesting. I said, this is clearly a global problem, but maybe geography is the issue here. These were questions that were all about, how well do you know your country? So in this case, it's how well do you know 64 million people? Not very well, it turns out. I can't do that. So I had an idea, which was to think about this same sort of approach but to think about it in a very local sense. Is this a local? If we reframe the questions and say, how well do you know your local area, would your answers be any more accurate?
所以,我在統計辦公室 面對這樣的事情時, 我心想,這真的很有趣。 我是說,這是個全球性的問題, 但也許只是因為地理性的問題。 這些問題是不是 與你對國家的認知有關? 像是測驗你對6400萬人口的認識? 很難,其實,我也辦不到。 所以,我想到了一個辦法, 跟這些問題的問法有點像, 但會要你去思考比較當地的問題。 會不會當地的問題就比較好回答? 如果我們把問題改成,比如說, 你對當地的認識有多深, 你會不會回答地比較精準?
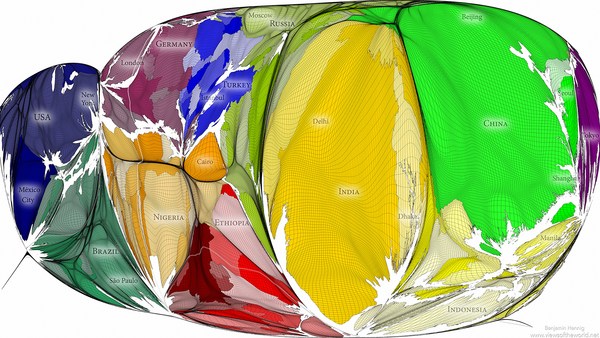
So I devised a quiz: How well do you know your area? It's a simple Web app. You put in a post code and then it will ask you questions based on census data for your local area. And I was very conscious in designing this. I wanted to make it open to the widest possible range of people, not just the 49 percent who can get the numbers. I wanted everyone to engage with it. So for the design of the quiz, I was inspired by the isotypes of Otto Neurath from the 1920s and '30s. Now, these are methods for representing numbers using repeating icons. And the numbers are there, but they sit in the background. So it's a great way of representing quantity without resorting to using terms like "percentage," "fractions" and "ratios."
所以,我設計了這樣的測試: 你對你所在的區域認識有多深? 這是一個很簡單的網路 App 應用程式。 你只要輸入郵遞區號, 然後程式就會問你一些 當地資料調查出來的問題。 我很小心地設計這個應用程式。 我希望對吸引絕大部分人, 而不是只有 49% 的人會回答而已。 我希望每個人都能參與回答。 所以,為了設計這個測試, 我被奧圖·紐拉特 在1920~1930年所用的圖像符號所啟發。 他的方法是利用重複的圖像 代表不同的數字。 數字就隱藏在圖像的背後, 所以用這樣的方式表達數量, 是一個很好的方式, 不須要用「百分比」、 「分數」、「比例」來表示。
So here's the quiz. The layout of the quiz is, you have your repeating icons on the left-hand side there, and a map showing you the area we're asking you questions about on the right-hand side. There are seven questions. Each question, there's a possible answer between zero and a hundred, and at the end of the quiz, you get an overall score between zero and a hundred. And so because this is TEDxExeter, I thought we would have a quick look at the quiz for the first few questions of Exeter. And so the first question is: For every 100 people, how many are aged under 16? Now, I don't know Exeter very well at all, so I had a guess at this, but it gives you an idea of how this quiz works. You drag the slider to highlight your icons, and then just click "Submit" to answer, and we animate away the difference between your answer and reality. And it turns out, I was a pretty terrible guess: five.
這裡是這個測試, 測試展現的方式是這樣的: 你的左邊會有一些重複的圖像, 題目中地區的地圖 顯示在你的右手邊。 一共有七個問題。 每一個問題的答案是零到100 回答完題目後, 你會得到一個零到100的分數。 因為我們這一場在埃克塞特舉辦的 TEDx演講, 我想,我們可以很快的看一下 有關埃克塞特的一些問題。 第一題: 每100人中,有多少人是未滿16歲的? 我對埃克塞特也不是很了解, 所以我也只能用猜的, 但你可以透過這個考試來了解。 你可以拖曳這個滑標來標示圖像, 然後點選「提交」傳送答案, 我們就會將你的答案與實際的差距 用動畫方式表示出來。 結果,我猜的答案(24)差很多, 答案是5。
How about the next question? This is asking about what the average age is, so the age at which half the population are younger and half the population are older. And I thought 35 -- that sounds middle-aged to me.
下一問題呢? 這一題問平均年齡是多少, 哪一半的人口較年輕, 另一半較老。 我猜是35歲, 因為我覺得那是中年人的年紀。
(Laughter)
(笑聲)
Actually, in Exeter, it's incredibly young, and I had underestimated the impact of the university in this area. The questions get harder as you go through. So this one's now asking about homeownership: For every 100 households, how many are owned with a mortgage or loan? And I hedged my bets here, because I didn't want to be more than 50 out on the answer.
實際上,埃克塞特的人口相當年輕(20), 我低估了這個區域裡的大學的影響。 接下來的題目越來越難。 這一題是關於擁有房產的人口比例: 每100人中,有多少人有設定或揹貸款? 保險起見,我猜高一點, 因為我不想一半的答案都是錯的。
(Laughter)
(笑聲) [實際:25,你猜:50]
And actually, these get harder, these questions, because when you're in an area, when you're in a community, things like age -- there are clues to whether a population is old or young. Just by looking around the area, you can see it. Something like homeownership is much more difficult to see, so we revert to our own heuristics, our own biases about how many people we think own their own homes.
實際上,這些題目越來越難, 因為如果你是在地的,你身處當地的社區, 像年齡這種問題...人口的老、少 多少還有點線索可尋, 只要稍微觀察一下你的生活周遭即可。 但像是有多少人擁有房產, 這就很難看得出來, 所以我們會採用我們個人的「啟發法」, 也就是我們對「有多少人擁有房產」 這件事情上的個人偏見。
Now the truth is, when we published this quiz, the census data that it's based on was already a few years old. We've had online applications that allow you to put in a post code and get statistics back for years. So in some senses, this was all a little bit old and not necessarily new. But I was interested to see what reaction we might get by gamifying the data in the way that we have, by using animation and playing on the fact that people have their own preconceptions.
事實上,當我們公佈這些問題後, 調查的結果是基於幾年前的資料。 我們的線上應用程式 讓你可以在輸入郵遞區號後, 取得數年之前的統計資料。 所以在某些方面, 有些資料已經有點老舊、還沒有更新。 但我當時比較有興趣的是, 如果把這些問題變得比較遊戲化, 大家會有什麼樣的反應, 藉由動畫, 和娛樂方式來看看大家對自己偏見的反應。
It turns out, the reaction was, um ... was more than I could have hoped for. It was a long-held ambition of mine to bring down a statistics website due to public demand.
結果,反應...相當...嗯... 比我想像的還熱烈。 長久以來的我的一個野心就是, 因應大眾的要求, 設立一個統計網站。
(Laughter)
(笑聲)
This URL contains the words "statistics," "gov" and "UK," which are three of people's least favorite words in a URL. And the amazing thing about this was that the website came down at quarter to 10 at night, because people were actually engaging with this data of their own free will, using their own personal time. I was very interested to see that we got something like a quarter of a million people playing the quiz within the space of 48 hours of launching it. And it sparked an enormous discussion online, on social media, which was largely dominated by people having fun with their misconceptions, which is something that I couldn't have hoped for any better, in some respects. I also liked the fact that people started sending it to politicians. How well do you know the area you claim to represent?
這個連結包括了「統計」、 「政府」、「英國」這些字眼, 它在連結上有三個字是人們最不喜歡的。 令人驚訝的是, 網站在當天晚上9點50分上架後, 因為這個時段,人們比較會想要 利用自己的時間, 自在地參與這項資料的問答。 我很驚訝, 差不多有將近25萬人 在網站發佈後的48小時內, 玩了這些問題的遊戲。 它在網路、社群媒體上 引起了熱烈的討論, 那些討論的人大多數 對自己的錯覺感到相當驚喜, 這個結果在某些方面, 遠遠超出我的意料之外。 我也因為有人開始把這個遊戲寄給政治人物 覺得很開心。 讓這些民意代表考考 他們對自己所代表的區域是否熟悉?
(Laughter)
(笑聲)
And then just to finish, going back to the two kinds of people, I thought it would be really interesting to see how people who are good with numbers would do on this quiz. The national statistician of England and Wales, John Pullinger, you would expect he would be pretty good. He got 44 for his own area.
做為總結, 回到之前把人分成兩種的問題上, 我在想, 如果可以請那些對數字很懂的人 來回答這些題目,應該會很有趣。 英格蘭威爾斯國家統計學者,約翰·普林爾, 你可能會認為他應該會表現不錯。 他在他自己的區域才得到44分。
(Laughter)
(笑聲)
Jeremy Paxman -- admittedly, after a glass of wine -- 36. Even worse. It just shows you that the numbers can inspire us all. They can surprise us all.
傑諾米·帕斯曼,他自己承認, 在小酌一杯酒後,得到了36分, 還更差。 這僅僅是告訴我們,數字可以啟發我們所有人。 也可以讓我們所有人感到驚訝。
So very often, we talk about statistics as being the science of uncertainty. My parting thought for today is: actually, statistics is the science of us. And that's why we should be fascinated by numbers.
所以,每當我們提到統計, 想到的都是科學與不確定性。 我今天要告訴大家的是: 實際上,統計是與我們生活 息息相關的科學, 而這也是為什麼 我們應該要對數字感到有趣的原因。
Thank you very much.
非常感謝各位。
(Applause)
(掌聲)