Back in 2003, the UK government carried out a survey. And it was a survey that measured levels of numeracy in the population. And they were shocked to find out that for every 100 working age adults in the country, 47 of them lacked Level 1 numeracy skills. Now, Level 1 numeracy skills -- that's low-end GCSE score. It's the ability to deal with fractions, percentages and decimals. So this figure prompted a lot of hand-wringing in Whitehall. Policies were changed, investments were made, and then they ran the survey again in 2011. So can you guess what happened to this number? It went up to 49.
2003 yılında, İngiliz hükumeti bir anket gerçekleştirdi. Toplumun sayısal becerilerini ölçen bir anketti bu. Ve sonuç oldukça şaşırtıcıydı. Buna göre, ülkede çalışma yaşındaki her 100 kişiden 47’si temel seviye sayısal bilgilerden yoksundu. Düşük bir GCSE puanına karşılık gelen bu seviye, kesirler, yüzdeler ve ondalık sayıları içeren bir eksikliğin göstergesiydi. Ve bu kötü sonuç hükümette ciddi endişelere yol açtı. Politikalar değişti, yatırımlar yapıldı. Ve sonra, 2011 yılında anket tekrarlandı. Peki tahmin edin sonuç ne oldu? 49’a çıktı.
(Laughter)
(Gülüşmeler)
And in fact, when I reported this figure in the FT, one of our readers joked and said, "This figure is only shocking to 51 percent of the population."
Doğrusu bu raporu Financial Times’a sunduğumda, okuyuculardan biri espiriyle şöyle dedi; “Anlaşılan bu durum, ülkenin sadece yüzde 51'ini şaşırtıyor.”
(Laughter)
(Gülüşmeler)
But I preferred, actually, the reaction of a schoolchild when I presented at a school this information, who raised their hand and said, "How do we know that the person who made that number isn't one of the 49 percent either?"
Ama en dikkat çeken yanıt ise aslında bir öğrenciden gelmişti. Yaptığım bir sunum esnasında elini kaldırdı ve şöyle dedi; “Bu sonuca ulaşan kişinin de yüzde 49’dan biri olmadığına emin miyiz?" (Gülüşmeler)
(Laughter)
So clearly, there's a numeracy issue, because these are important skills for life, and a lot of the changes that we want to introduce in this century involve us becoming more comfortable with numbers.
Yani bu konuda bazı sıkıntılar yaşadığımız ortada. Çünkü bunların yaşantımıza etkileri oldukça fazla ve çağımıza kazandırdığımız çoğu değişime sayılarla olan bağımızı ilerleterek ortak oluyoruz.
Now, it's not just an English problem. OECD this year released some figures looking at numeracy in young people, and leading the way, the USA -- nearly 40 percent of young people in the US have low numeracy. Now, England is there too, but there are seven OECD countries with figures above 20 percent. That is a problem, because it doesn't have to be that way. If you look at the far end of this graph, you can see the Netherlands and Korea are in single figures. So there's definitely a numeracy problem that we want to address.
Bu sorun sadece İngiltere'ye özgü değil. OECD bu yıl, gençlerin sayısal yeteneklerini gösteren bazı sonuçlar yayınladı. Buna göre, ilk sırada Amerika var ve buradaki gençlerin yaklaşık yüzde 40'ı sayısal yönden düşük seviyede. İngiltere de aynı durumda, hatta bu tabloda, yüzde 20’nin üzerinde bir kitlenin düşük seviyede olduğu 7 OECD ülkesi var. Bu bir sorun, çünkü bu şekilde olmaması gerekiyor. Grafiğin sonuna baktığınızda, bu oranı sadece Hollanda ve Kore için tek haneli seviyelerde görürsünüz. Bunları bir takım sayısal sıkıntılara dikkat çekmek için anlattım.
Now, as useful as studies like these are, I think we risk herding people inadvertently into one of two categories; that there are two kinds of people: those people that are comfortable with numbers, that can do numbers, and the people who can't. And what I'm trying to talk about here today is to say that I believe that is a false dichotomy. It's not an immutable pairing. I think you don't have to have tremendously high levels of numeracy to be inspired by numbers, and that should be the starting point to the journey ahead.
Aslında bu çalışmalar faydalı olmalarının yanı sıra, bence istemeden de olsa insanları iki gruba ayırarak, bir anlamda risk taşıyor. Yani ortaya iki grup insan çıkıyor. Sayılarla arası iyi olup, bu alanda yeteneği olanlar ve olmayanlar. Bugün söylemeye çalıştığım şey, ben bu ayrımın yanlış olduğuna inanıyorum. Yani bir sınıflandırma şart değil. Bana göre sayılarla harikalar yaratacak düzeyde bir sayısal yeteneğiniz olmak zorunda değil. Ve şimdi anlatacaklarımın çıkış noktası da aslında bu konu.
And one of the ways in which we can begin that journey, for me, is looking at statistics. Now, I am the first to acknowledge that statistics has got somewhat of an image problem.
Bunu biraz daha açmak istersek, bence istatistiklere göz atmamız gerekir. Öncelikle şunu kabul ediyorum, istatistikler zihninizde canlanmakta biraz direniyor olabilir.
(Laughter)
(Gülüşmeler)
It's the part of mathematics that even mathematicians don't particularly like, because whereas the rest of maths is all about precision and certainty, statistics is almost the reverse of that. But actually, I was a late convert to the world of statistics myself. If you'd asked my undergraduate professors what two subjects would I be least likely to excel in after university, they'd have told you statistics and computer programming, and yet here I am, about to show you some statistical graphics that I programmed.
İstatistik matematiğin bir parçası olsa da matematikçiler tam anlamıyla sevmezler. Çünkü matematiğin kalanı tamamen hassasiyet ve kesinlik üzerinedir. İstatistik ise çoğunlukla buna terstir. Buna rağmen aslında ben istatistik dünyasına biraz geç katıldım. Eğer lisans hocalarıma okuldan sonra hangi iki konuda ilerleyeceğimi sorsaydınız istatistik ve bilgisayar programcılığını size muhtemelen en son sayacaklardı. Ama birazdan size kendi programladığım bazı istatistiksel verileri göstereceğim.
So what inspired that change in me? What made me think that statistics was actually an interesting thing? It's really because statistics are about us. If you look at the etymology of the word statistics, it's the science of dealing with data about the state or the community that we live in. So statistics are about us as a group, not us as individuals. And I think as social animals, we share this fascination about how we as individuals relate to our groups, to our peers. And statistics in this way are at their most powerful when they surprise us.
Peki beni bu değişime sürükleyen neydi? İstatistiğin aslında ilginç bir şey olduğunu bana ne düşündürdü? Aslında nedeni istatistiğin bizi konu almasıydı. İstatistiğin kökenine bakarsak, yaşadığımız ülkenin veya toplumun verileriyle ilgilenen ve onları konu alan bir bilim olduğunu görürüz. Yani istatistik bizi bir grup olarak ele alır, kişisel değil. Ve sosyal varlıklar olarak, bireysellikten toplum hayatına uzanan bu ilişkinin büyüsünü beraber yaşıyoruz. Bu anlamda istatistik bilimi, asıl gücünü bizi şaşırttığı anda göstermiş oluyor.
And there's been some really wonderful surveys carried out recently by Ipsos MORI in the last few years. They did a survey of over 1,000 adults in the UK, and said, for every 100 people in England and Wales, how many of them are Muslim? Now the average answer from this survey, which was supposed to be representative of the total population, was 24. That's what people thought. British people think 24 out of every 100 people in the country are Muslim. Now, official figures reveal that figure to be about five. So there's this big variation between what we think, our perception, and the reality as given by statistics. And I think that's interesting. What could possibly be causing that misperception?
Ipsos MORI organizasyonu, son birkaç yılda gerçekten harika anketler gerçekleştirdi. Britanya’da 1000'den fazla katılımcıyla bir anket yaptılar ve bu kişilere İngiltere ve Galler’de yaşayan her 100 kişiden kaçı müslümandır diye sordular. Buradan çıkacak sonucun da, toplumun bu konudaki düşüncesini yansıtması bekleniyordu. Ve sonuç 24 çıktı. İnsanlar böyle düşünüyordu. Yani İngilizlere göre, ülkelerindeki her 100 kişiden 24’ü Müslümandı. Ama resmi sonuçlar, bu rakamın yüzde 5 olduğunu gösteriyor. Bu da gösteriyor ki, algılarımız sonucu oluşan düşünce ile istatistiklerin ortaya koyduğu gerçekler arasında büyük farklılıklar var. Ve bu çok ilginç. Peki bizdeki bu yanlış algıya sebep olan şey ne olabilir?
And I was so thrilled with this study, I started to take questions out in presentations. I was referring to it. Now, I did a presentation at St. Paul's School for Girls in Hammersmith, and I had an audience rather like this, except it was comprised entirely of sixth-form girls. And I said, "Girls, how many teenage girls do you think the British public think get pregnant every year?" And the girls were apoplectic when I said the British public think that 15 out of every 100 teenage girls get pregnant in the year. And they had every right to be angry, because in fact, I'd have to have closer to 200 dots before I could color one in, in terms of what the official figures tell us.
Bu beni oldukça heyecanlandırmıştı. Bu sebeple sunumlarda bazı sorulara cevaplar aramaya başladım. Hammersmith’te bulunan St.Paul kız lisesinde bir sunum yaptım. Buna benzer bir izleyici grubu vardı fakat tamamıyla kız öğrencilerden oluşuyordu. Ve kızlara şöyle dedim, "Sizce İngiliz Toplumu, her yıl kaç genç kızın hamile kaldığını düşünüyordur? " Cevabı duyan kızların suratı asıldı. İngilizler her yıl bu kızların yaklaşık %15'inin hamile kaldığını düşünüyordu. Kızlar bu duruma kızmakta sonuna kadar haklıydılar. Çünkü resmi sonuçlara göre bu rakam yalnızca yüzde 0.6. Yani tek bir nokta bile tam dolu olmuyor bu sonuca göre. Sayısal sıkıntılarda olduğu gibi, bu da yine İngilizlere özgü değildi.
And rather like numeracy, this is not just an English problem. Ipsos MORI expanded the survey in recent years to go across the world. And so, they asked Saudi Arabians, for every 100 adults in your country, how many of them are overweight or obese? And the average answer from the Saudis was just over a quarter. That's what they thought. Just over a quarter of adults are overweight or obese. The official figures show, actually, it's nearer to three-quarters.
Ipsos MORI son yıllarda bu anketlerini dünya çapında genişletti. Böylece Suudi Arabistanlılara şunu sordular; Ülkenizdeki her 100 kişiden kaçı aşırı kilolu veya obezdir? Bu soruya karşılık, Suudilerden gelen cevap yüzde 25’in biraz üstüydü. Öyle sanıyorlardı. Yani obeziteyi yüzde 25 seviyesinde görüyorlardı. Ama resmi rakamlar gerçek sonucun aslında, tahminlerinin yaklaşık 3 katı olduğunu gösteriyor.
(Laughter)
(Gülüşmeler)
So again, a big variation.
Yani yine büyük bir fark var.
And I love this one: they asked in Japan, they asked the Japanese, for every 100 Japanese people, how many of them live in rural areas? The average was about a 50-50 split, just over halfway. They thought 56 out of every 100 Japanese people lived in rural areas. The official figure is seven.
Şu da ilginç bir örnek. Japonya’da soruluyor bu kez, Japonlara ülkelerindeki kırsal kesim nüfusu yüzde kaçtır diye sorulmuş. Ve bu soruya verdikleri cevap yüzde 50’nin biraz üzerinde. Yani Japonlar yüzde 56’lık bir kesimin kırsal bölgede yaşadığını düşünüyordu. Oysaki resmi sonuç yüzde 7.
So extraordinary variations, and surprising to some, but not surprising to people who have read the work of Daniel Kahneman, for example, the Nobel-winning economist. He and his colleague, Amos Tversky, spent years researching this disjoint between what people perceive and the reality, the fact that people are actually pretty poor intuitive statisticians. And there are many reasons for this. Individual experiences, certainly, can influence our perceptions, but so, too, can things like the media reporting things by exception, rather than what's normal. Kahneman had a nice way of referring to that. He said, "We can be blind to the obvious" -- so we've got the numbers wrong -- "but we can be blind to our blindness about it." And that has enormous repercussions for decision making.
Aradaki beklenmeyen bu fark, bazıları için şaşırtıcı olurken, bazıları için değildir. Daniel Kahneman’ın çalışmasını okuyanlar bunu normal karşılıyor. Kendisi Nobel Ödüllü bir ekonomist. Kahneman ve arkadaşı Amos Tversky, uzun yıllarını algılarımız ve gerçekler arasındaki bu farkı araştırmakla harcadı. Ve gerçek şu ki, aslında istatistiksel konulardaki sezgilerimiz oldukça zayıf. Bunun bir çok sebebi var. Kişisel deneyimler şüphesiz ki gerçekler üzerindeki algılarımızı etkileyebiliyor, hatta bazı durumlarda bunu, medya üzerinde bile görebiliyoruz. Kahneman bu durumu, şöyle açıklıyor; “Gerçeği göremediğimizden yanlış sonuçlara ulaşabiliriz. Ama aynı zamanda bunun farkında da değiliz." Ve bu durum kararlarımız üzerinde büyük sonuçlar doğuruyor. İstatistik ofisinde oturup tüm bunları düşünürken,
So at the statistics office while this was all going on, I thought this was really interesting. I said, this is clearly a global problem, but maybe geography is the issue here. These were questions that were all about, how well do you know your country? So in this case, it's how well do you know 64 million people? Not very well, it turns out. I can't do that. So I had an idea, which was to think about this same sort of approach but to think about it in a very local sense. Is this a local? If we reframe the questions and say, how well do you know your local area, would your answers be any more accurate?
aklıma ilginç bir şey geldi. Bunun dünya çapında bir problem olduğu kesindi, ama belki de sorun yaşadığımız coğrafyadaydı. Tüm bunlar akıllara şunu getiriyor; Ülkenizi ne kadar iyi tanıyorsunuz? Peki bu durumda, 64 milyon insanı ne kadar tanıyabilirsiniz? Çok fazla değildi elbette. Ben yapamazdım. Ve sonra aklıma bu yaklaşım tarzını daha yerel bir biçimde düşünme fikri geldi. Şunu yapsak peki? Soruyu düzenleyip şöyle soralım; Bulunduğunuz çevreyi ne kadar tanıyorsunuz? Bu şekilde cevabınız daha gerçekçi olur muydu?
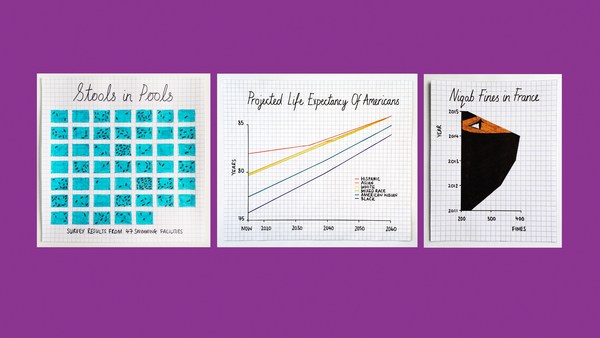
So I devised a quiz: How well do you know your area? It's a simple Web app. You put in a post code and then it will ask you questions based on census data for your local area. And I was very conscious in designing this. I wanted to make it open to the widest possible range of people, not just the 49 percent who can get the numbers. I wanted everyone to engage with it. So for the design of the quiz, I was inspired by the isotypes of Otto Neurath from the 1920s and '30s. Now, these are methods for representing numbers using repeating icons. And the numbers are there, but they sit in the background. So it's a great way of representing quantity without resorting to using terms like "percentage," "fractions" and "ratios."
Bunun için bir test hazırladım. Çevrenizi ne kadar tanıyorsunuz? Basit bir web uygulaması. Posta kodununuzu girdikten sonra size bulunduğunuz yer hakkında, nüfus verilerini baz alarak sorular soruyor. Bu testi çok dikkatle hazırladım. Çünkü mümkün olan en geniş insan kitlesine ulaşmasını istiyordum. Yani sadece yüzde 49'un değil, herkesin uğraşmasını istedim. Ve bu testi tasarlarken, Şunu kullandım. 1920’lerden 1930’lara Otto Neurath’ın izotiplerinden esinlendim. Bu yönteme göre sayılar, ard arda gelen tekrarlı şekillerle temsil ediliyordu. Böylece sayılar işlevlerini geri planda kalarak sürdürecekti. Yani miktar göstermeniz gerektiğinde yüzde kesir veya oran kavramına ihtiyaç duymayan harika bir yöntem kullanmış olacaktınız.
So here's the quiz. The layout of the quiz is, you have your repeating icons on the left-hand side there, and a map showing you the area we're asking you questions about on the right-hand side. There are seven questions. Each question, there's a possible answer between zero and a hundred, and at the end of the quiz, you get an overall score between zero and a hundred. And so because this is TEDxExeter, I thought we would have a quick look at the quiz for the first few questions of Exeter. And so the first question is: For every 100 people, how many are aged under 16? Now, I don't know Exeter very well at all, so I had a guess at this, but it gives you an idea of how this quiz works. You drag the slider to highlight your icons, and then just click "Submit" to answer, and we animate away the difference between your answer and reality. And it turns out, I was a pretty terrible guess: five.
Ve işte test. Ana hatlarıyla ele alırsak, sol tarafınızda tekrar eden şekiller bulunuyor. Sağ tarafınızda ise bir harita var ve size soru sorulan bölgeyi gösteriyor. 7 soru var. Her soru için 0-100 aralığında tek bir cevap var. Testin sonunda ise toplamda 0-100 aralığında bir puan kazanıyorsunuz. Şuanda TEDx Exeter'da olduğumuzdan, Exeter için, testimizdeki ilk birkaç soruya hızlıca bakabiliriz diye düşündüm. İlk soru şöyle, buradaki her 100 kişiden kaçı 16 yaşın altındadır? Ben aslında Exeter’i çok bilmiyorum, ama bir tahminim var. Tabi bu size test hakkında fikir verecektir. Şekilleri aktifleştirmek için kaydıracı sürüklüyorsunuz. Cevabınız için ise “Onay” a basmanız yeterli. Böylece verdiğiniz yanıt ile gerçek sonuç arasındaki fark ortaya çıkıyor. Ve işte sonuç. Ben baya kötü tahmin etmişim, cevap beş.
How about the next question? This is asking about what the average age is, so the age at which half the population are younger and half the population are older. And I thought 35 -- that sounds middle-aged to me.
Sıradakine bakalım. Bu seferki soru ise yaş ortalaması kaçtır diye soruyor. Buna göre nüfusu yarısı genç, yarısı yaşlı olarak düşündüm ve 35 gibi geldi bana. Biraz orta yaş gibi düşünmüşüm.
(Laughter)
(Gülüşmeler)
Actually, in Exeter, it's incredibly young, and I had underestimated the impact of the university in this area. The questions get harder as you go through. So this one's now asking about homeownership: For every 100 households, how many are owned with a mortgage or loan? And I hedged my bets here, because I didn't want to be more than 50 out on the answer.
Aslında Exeter'in nüfusu baya genç, ben bu bölgede Üniversitenin buna etkisini yeterince dikkate almamışım. Devam ettikçe sorular zorlaşıyor. Bu soru ise ev sahipleri ile ilgili. Kredi veya Mortgage ile ev sahibi olanların oranı yüzde kaçtır? Ama burada iyi düşündüm, çünkü bu kez sonuçla aramdaki farkın 50'yi geçmesini istemiyordum.
(Laughter)
(Gülüşmeler)
And actually, these get harder, these questions, because when you're in an area, when you're in a community, things like age -- there are clues to whether a population is old or young. Just by looking around the area, you can see it. Something like homeownership is much more difficult to see, so we revert to our own heuristics, our own biases about how many people we think own their own homes.
Gördüğünüz gibi sorular zorlaşıyor. Çünkü bir çevrede yaşıyor ve o toplumun bir parçasıysanız, bu gibi konularda, yani bir nüfusun yaşlı veya genç olup olmadığı konusunda ipuçları vardır. Sadece çevrenize bakarak bunu görebilirsiniz. Ama ev sahiplerinin oranı gibi konularda tahminde bulunmak daha zor olduğundan, sezgilerimize ve öngörülerimize ihtiyaç duyarız. Yani ev sahibi olabilecek insan sayısı hakkında zihnimizi yoklarız.
Now the truth is, when we published this quiz, the census data that it's based on was already a few years old. We've had online applications that allow you to put in a post code and get statistics back for years. So in some senses, this was all a little bit old and not necessarily new. But I was interested to see what reaction we might get by gamifying the data in the way that we have, by using animation and playing on the fact that people have their own preconceptions.
Doğrusu bu testi insanlara sunduğumuzda, dayandığı veriler birkaç yıl öncesinindi. Yıllarca bir posta kodu girdiğimizde bize sadece istatistiksel veriler sunan internet uygulamaları kullandık. Aslında bunlar bir bakıma biraz eskiydi, ya da pek yeni sayılmazdı. Ama ben burada şunu istedim, verileri bu şekilde eğlenceli bir hale dönüştürüp, animasyonlar kullandığımızda ve bu şekliyle insanlara sunduğumuzda toplumun ilgisi nasıl olacaktı.
It turns out, the reaction was, um ... was more than I could have hoped for. It was a long-held ambition of mine to bring down a statistics website due to public demand.
Şöyle ki, aslında bu ilgi-- Beklentimin çok üstünde oldu. Bir istatistik sitesinin yoğun ilgi nedeniyle çökmesini çok beklemiştim. (Gülüşmeler)
(Laughter)
This URL contains the words "statistics," "gov" and "UK," which are three of people's least favorite words in a URL. And the amazing thing about this was that the website came down at quarter to 10 at night, because people were actually engaging with this data of their own free will, using their own personal time. I was very interested to see that we got something like a quarter of a million people playing the quiz within the space of 48 hours of launching it. And it sparked an enormous discussion online, on social media, which was largely dominated by people having fun with their misconceptions, which is something that I couldn't have hoped for any better, in some respects. I also liked the fact that people started sending it to politicians. How well do you know the area you claim to represent?
Üstelik bu URL adresi “İstatistik”, “gov” ve “UK” kelimelerini içeriyordu ve bunlar internette en az ilgi duyulabilecek 3 kelimeydi. İşin ilginç yanı ise sitemiz çöktüğünde saat, gece 9:44 gibiydi. Çünkü insanlar kendi fikirlerini ifade edebildikleri bu teste ancak gece boş zamanlarında bakabiliyorlardı. 48 saatlik bir zaman dilimi içerisinde, bu teste katılan çeyrek milyon insana ulaşmış olmak beni fazlasıyla heyecanlandırdı. Ve üstüne bu durum İnternette ve sosyal medyada büyük ses getirdi. Yanlış cevaplar üzerine eğlence yaratan birçok insan büyük bir akım başlattı. Sanırım benim için de bundan iyisi olamazdı. Bir başka eğlenceli yanı ise insanlar bunu politikacılara göndermeye başladı. Seçim bölgeni ne kadar tanıyorsun? (Gülüşmeler)
(Laughter)
Ve son olarak,
And then just to finish, going back to the two kinds of people, I thought it would be really interesting to see how people who are good with numbers would do on this quiz. The national statistician of England and Wales, John Pullinger, you would expect he would be pretty good. He got 44 for his own area.
insanları ikiye ayırmıştık hatırlarsanız. Peki bu testte sayılarla arası iyi olanlar ne kadar iyiydi, biraz da onlara bakalım. İngiltere ve Galler'den ulusal istatistikçi, John Pullinger kendisinden oldukça iyi bir sonuç bekliyorsunuzdur. Ama 44 aldı,
(Laughter)
üstelik kendi çevresi içinde.
(Gülüşmeler)
Jeremy Paxman -- admittedly, after a glass of wine -- 36. Even worse. It just shows you that the numbers can inspire us all. They can surprise us all.
Jeremy Paxman, muhtemelen bir kadeh şarap ve ardından sonuç, 36. Hatta daha kötü. Bu sadece şunu gösteriyor, sayılar hepimize ilham verebilirler. Ve hepimizi şaşırtabilirler.
So very often, we talk about statistics as being the science of uncertainty. My parting thought for today is: actually, statistics is the science of us. And that's why we should be fascinated by numbers.
İstatistiklerden belirsizlikler bilimi diyerek sık sık bahsediyoruz. Bugün dikkat çekmeye çalıştığım şey, istatistiğin aslında hepimizin, yani insanlığın bilimi olması. Ve sayılara hayranlık duymamızın nedeni de, işte tam olarak bu.
Thank you very much.
Çok teşekkürler.
(Applause)
(Alkışlar)