Back in 2003, the UK government carried out a survey. And it was a survey that measured levels of numeracy in the population. And they were shocked to find out that for every 100 working age adults in the country, 47 of them lacked Level 1 numeracy skills. Now, Level 1 numeracy skills -- that's low-end GCSE score. It's the ability to deal with fractions, percentages and decimals. So this figure prompted a lot of hand-wringing in Whitehall. Policies were changed, investments were made, and then they ran the survey again in 2011. So can you guess what happened to this number? It went up to 49.
V roku 2003 vláda Veľkej Británie urobila prieskum. Bol to prieskum, ktorý hodnotil úroveň matematickej gramotnosti v rámci populácie. A ich zistenie ich prekvapilo. Zistili, že z každých 100 ľudí v produktívnom veku v krajine 47 nemalo matematickú gramotnosť ani základnej úrovne. Matematická gramotnosť základnej úrovne, to je ako maturita s najhoršou známkou. Je to schopnosť pracovať so zlomkami, percentami a desatinnými číslami. Tieto čísla spôsobili v parlamente veľa nervozity. Zmenili sa postupy, investovalo sa a potom sa v roku 2011 prieskum opakoval. Uhádnete, čo sa s tým číslom stalo? Zvýšilo sa na 49.
(Laughter)
(smiech)
And in fact, when I reported this figure in the FT, one of our readers joked and said, "This figure is only shocking to 51 percent of the population."
Keď som to číslo publikoval vo Financial Times jeden z čitateľov takto žartoval: „To číslo je šokujúce iba pre 51 % populácie.“
(Laughter)
(smiech)
But I preferred, actually, the reaction of a schoolchild when I presented at a school this information, who raised their hand and said, "How do we know that the person who made that number isn't one of the 49 percent either?"
Mne sa ale viac páčila reakcia školáka, ktorý, keď som im o tom v škole povedal, zdvihol ruku a povedal: „Ako vieme, že tá osoba, čo nám dala to číslo nie je tiež z tých 49 %?“
(Laughter)
(smiech)
So clearly, there's a numeracy issue, because these are important skills for life, and a lot of the changes that we want to introduce in this century involve us becoming more comfortable with numbers.
Je zjavné, že s počítaním je problém, pretože sú to dôležité životné schopnosti a veľa zmien, ktoré chceme v tomto storočí zaviesť, zahŕňa ľudí, ktorí sa neboja čísel.
Now, it's not just an English problem. OECD this year released some figures looking at numeracy in young people, and leading the way, the USA -- nearly 40 percent of young people in the US have low numeracy. Now, England is there too, but there are seven OECD countries with figures above 20 percent. That is a problem, because it doesn't have to be that way. If you look at the far end of this graph, you can see the Netherlands and Korea are in single figures. So there's definitely a numeracy problem that we want to address.
Nie je to len problém Angličanov. OECD tento rok zverejnila čísla, keď sa pozreli na matematickú gramotnosť mladých a na vrchole rebríčka je USA, kde takmer 40 % mladých ľudí má nízku matematickú gramotnosť. Anglicko tam bolo tiež, ale existuje sedem krajín OECD s číslami nad 20 %. To je problém, pretože to tak nemusí byť. Ak sa pozriete na koniec tohto grafu, zbadáte Holandsko a Kóreu s jednociferným číslom. Takže naozaj máme problém s touto gramotnosťou, ktorý chceme napraviť.
Now, as useful as studies like these are, I think we risk herding people inadvertently into one of two categories; that there are two kinds of people: those people that are comfortable with numbers, that can do numbers, and the people who can't. And what I'm trying to talk about here today is to say that I believe that is a false dichotomy. It's not an immutable pairing. I think you don't have to have tremendously high levels of numeracy to be inspired by numbers, and that should be the starting point to the journey ahead.
Hoci sú tieto štúdie užitočné, myslím, že podvedome riskujeme rozdelenie ľudí do dvoch kategórií, že sú dva typy ľudí: tí, ktorí sa čísel neboja a vedia s nimi pracovať a ľudia, ktorí takí nie sú. Dnes, sa tu snažím povedať, že verím, že je to chybné delenie. Nie je to nemenný fakt. Myslím, že nemusíte mať veľmi vysokú úroveň matematickej gramotnosti, aby vás čísla inšpirovali, a to by mal byť začiatok našej cesty vpred.
And one of the ways in which we can begin that journey, for me, is looking at statistics. Now, I am the first to acknowledge that statistics has got somewhat of an image problem.
Podľa mňa jeden zo spôsobov, ako začať túto cestu, je pozeranie sa na štatistiky. Ako prvý chcem uznať, že štatistiky majú niečo ako problém s imidžom.
(Laughter)
(smiech)
It's the part of mathematics that even mathematicians don't particularly like, because whereas the rest of maths is all about precision and certainty, statistics is almost the reverse of that. But actually, I was a late convert to the world of statistics myself. If you'd asked my undergraduate professors what two subjects would I be least likely to excel in after university, they'd have told you statistics and computer programming, and yet here I am, about to show you some statistical graphics that I programmed.
Je to časť matematiky, ktorú nemajú príliš radi ani matematici, pretože hoci zvyšok matematiky je o presnosti a určitosti, štatistiky sú takmer opakom. Ale aj ja som sa do sveta štatistík dostal až neskôr. Ak by ste sa opýtali mojich profesorov na bakalára, v ktorých dvoch predmetoch mám najmenej šancí na úspech po univerzite, povedali by vám, že štatistiky a programovanie počítačov. No a teraz som tu a idem vám ukázať štatistické grafy, ktoré som naprogramoval.
So what inspired that change in me? What made me think that statistics was actually an interesting thing? It's really because statistics are about us. If you look at the etymology of the word statistics, it's the science of dealing with data about the state or the community that we live in. So statistics are about us as a group, not us as individuals. And I think as social animals, we share this fascination about how we as individuals relate to our groups, to our peers. And statistics in this way are at their most powerful when they surprise us.
Takže čo vo mne vyvolalo tú zmenu? Čo ma donútilo pomyslieť si, že štatistiky sú vlastne zaujímavé? To preto, že štatistiky sú o nás. Ak sa pozriete na pôvod slova štatistika, tak je to veda, ktorá sa zaoberá údajmi o stave komunity, v ktorej žijeme. Takže štatistiky sú o nás ako o skupine, nie ako jednotlivcoch. A myslím si, že ako sociálne tvory, aj my zdieľame tú fascináciu tým, ako my-jednotlivci súvisíme so skupinami, s rovesníkmi. A práve preto sú štatistiky najmocnejšie, keď nás prekvapia.
And there's been some really wonderful surveys carried out recently by Ipsos MORI in the last few years. They did a survey of over 1,000 adults in the UK, and said, for every 100 people in England and Wales, how many of them are Muslim? Now the average answer from this survey, which was supposed to be representative of the total population, was 24. That's what people thought. British people think 24 out of every 100 people in the country are Muslim. Now, official figures reveal that figure to be about five. So there's this big variation between what we think, our perception, and the reality as given by statistics. And I think that's interesting. What could possibly be causing that misperception?
Nedávno tu bol naozaj úžasný prieskum vydaný spoločnosťou Ipsos MORI. Spravili prieskum na viac ako 1000 dospelých v Británii a pýtali sa, že na každých 100 ľudí v Anglicku a Walese koľkí z nich sú moslimovia? Nuž priemerná odpoveď z dotazníka, ktorý mal predstavovať model celkovej populácie, bola 24. To si ľudia mysleli. Briti si myslia, že 24 z každých 100 ľudí v krajine sú moslimovia. Oficiálne čísla hovoria, že hodnota sa hýbe okolo piatich. Takže je naozaj rozdiel medzi tým, čo si myslíme, naším pohľadom, a realitou danou štatistikami. A myslím si, že je to zaujímavé. Čo asi môže za ten chybný pohľad?
And I was so thrilled with this study, I started to take questions out in presentations. I was referring to it. Now, I did a presentation at St. Paul's School for Girls in Hammersmith, and I had an audience rather like this, except it was comprised entirely of sixth-form girls. And I said, "Girls, how many teenage girls do you think the British public think get pregnant every year?" And the girls were apoplectic when I said the British public think that 15 out of every 100 teenage girls get pregnant in the year. And they had every right to be angry, because in fact, I'd have to have closer to 200 dots before I could color one in, in terms of what the official figures tell us.
Táto štúdia ma tak nadchla, že som si začal vyberať otázky na prezentácie. Odkazoval som na štúdiu. Prezentoval som na škole sv. Paula pre dievčatá v Hammersmithe a mal som asi takéto publikum, až na to, že bolo celé zložené zo stredoškoláčok. A povedal som: „Dievčatá, čo si myslíte, čo si Briti myslia, koľko dospievajúcich dievčat otehotnie každý rok?“ A dievčatá boli na mŕtvicu, keď som povedal, že Briti si myslia, že 15 z každých 100 dospievajúcich dievčat otehotnie každý rok. A mali právo byť naštvané, pretože v skutočnosti by som musel mať takmer 200 bodiek aby som mohol jednu vyfarbiť; podľa toho, čo nám hovoria oficiálne čísla.
And rather like numeracy, this is not just an English problem. Ipsos MORI expanded the survey in recent years to go across the world. And so, they asked Saudi Arabians, for every 100 adults in your country, how many of them are overweight or obese? And the average answer from the Saudis was just over a quarter. That's what they thought. Just over a quarter of adults are overweight or obese. The official figures show, actually, it's nearer to three-quarters.
A tak ako matematická gramotnosť, nie je to len problém Angličanov. Ipsos MORI rozšírili nedávno prieskum na celý svet. Takže sa opýtali Arabov, že na každých 100 dospelých v krajine, koľkí z nich majú nadváhu alebo obezitu? A priemerná odpoveď Arabov bola len niečo cez štvrtinu. To si myslia. Len viac ako štvrtina dospelých má nadváhu alebo obezitu. Oficiálne hodnoty ukazujú, že je to vlastne skôr tri štvrtiny.
(Laughter)
(smiech)
So again, a big variation.
Takže znova veľký rozdiel.
And I love this one: they asked in Japan, they asked the Japanese, for every 100 Japanese people, how many of them live in rural areas? The average was about a 50-50 split, just over halfway. They thought 56 out of every 100 Japanese people lived in rural areas. The official figure is seven.
A toto milujem: v Japonsku sa opýtali, opýtali sa Japoncov, že koľkí z každých 100 Japoncov býva v odľahlých oblastiach? Priemer bol okolo 50 na 50, niečo cez polovicu. Mysleli si, že 56 z každých 100 Japoncov býva v odľahlých oblastiach. Oficiálne čísla hovoria sedem.
So extraordinary variations, and surprising to some, but not surprising to people who have read the work of Daniel Kahneman, for example, the Nobel-winning economist. He and his colleague, Amos Tversky, spent years researching this disjoint between what people perceive and the reality, the fact that people are actually pretty poor intuitive statisticians. And there are many reasons for this. Individual experiences, certainly, can influence our perceptions, but so, too, can things like the media reporting things by exception, rather than what's normal. Kahneman had a nice way of referring to that. He said, "We can be blind to the obvious" -- so we've got the numbers wrong -- "but we can be blind to our blindness about it." And that has enormous repercussions for decision making.
Tak neobyčajné rozdiely a pre niekoho prekvapujúce, no neprekvapia ľudí, ktorí čítali napríklad prácu Daniela Kahnemana, ekonóma oceneného Nobelovou cenou. On a jeho kolega Amos Tversky strávili roky skúmaním tohto rozdielu medzi tým, čo ľudia vnímajú a realitou, faktom, že ľudia sú vlastne dosť mizerní intuitívni štatisti. A je na to veľa dôvodov. Vlastné skúsenosti môžu určite ovplyvniť naše vnímanie ale to tiež môžu aj médiá, ktoré robia reportáže o výnimkách a nie tom, čo je normálne. Kahneman to spomenul pekne. Povedal: „Môžeme byť slepí k očividnému,“ preto máme zlé hodnoty, „ale môžeme byť slepí k tej sleposti.“ A to má obrovskú odozvu na tom, ako sa rozhodujeme.
So at the statistics office while this was all going on, I thought this was really interesting. I said, this is clearly a global problem, but maybe geography is the issue here. These were questions that were all about, how well do you know your country? So in this case, it's how well do you know 64 million people? Not very well, it turns out. I can't do that. So I had an idea, which was to think about this same sort of approach but to think about it in a very local sense. Is this a local? If we reframe the questions and say, how well do you know your local area, would your answers be any more accurate?
V kancelárii štatistikov, kým sa toto preberalo, myslel som si, že je to naozaj zaujímavé. Povedal som, že je to zjavne globálny problém, no možno problémom je tu geografia. Boli to všetko otázky na to, ako dobre poznáte svoju krajinu. V tomto prípade ako dobre poznáte 64 miliónov ľudí. Vysvitlo, že nie veľmi dobre. Ja to neviem. Takže som mal nápad, že by sme mali zvoliť rovnaký postup, ale uvažovať o tom by sme mali v lokálnom zmysle. Je toto lokálne? Ak prerobíme otázky a opýtame sa ako dobre poznáte svoje okolie, odpovedali by ste presnejšie?
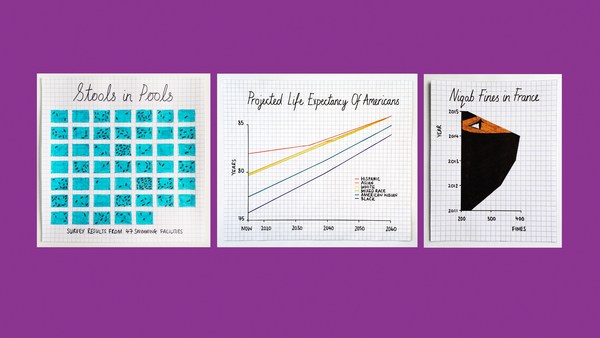
So I devised a quiz: How well do you know your area? It's a simple Web app. You put in a post code and then it will ask you questions based on census data for your local area. And I was very conscious in designing this. I wanted to make it open to the widest possible range of people, not just the 49 percent who can get the numbers. I wanted everyone to engage with it. So for the design of the quiz, I was inspired by the isotypes of Otto Neurath from the 1920s and '30s. Now, these are methods for representing numbers using repeating icons. And the numbers are there, but they sit in the background. So it's a great way of representing quantity without resorting to using terms like "percentage," "fractions" and "ratios."
Vymyslel som teda kvíz: Ako dobre poznáte svoje okolie? Je to jednoduchá internetová aplikácia. Vložíte PSČ a potom vám položí otázky založené na dátach zo sčítania ľudu pre vaše okolie. A pri dizajnovaní som nad tým veľa uvažoval. Chcel som, aby to bolo prístupné pre najširší záber ľudí, nielen 49 %, ktorí chápu čísla. Chcel som zapojiť všetkých. Takže ohľadne dizajnu kvízu ma inšpirovali obrazy Otta Neuratha z 20. a 30. rokov 20. storočia. Toto sú metódy, ktoré reprezentujú čísla použitím opakujúcich sa ikoniek. Tie čísla tam sú, ale sú skryté v pozadí. Takže je to skvelý spôsob, ako ukázať kvantitu bez uchýlenia sa k použitiu výrazov ako „percentá“, „zlomky“ a „pomery“.
So here's the quiz. The layout of the quiz is, you have your repeating icons on the left-hand side there, and a map showing you the area we're asking you questions about on the right-hand side. There are seven questions. Each question, there's a possible answer between zero and a hundred, and at the end of the quiz, you get an overall score between zero and a hundred. And so because this is TEDxExeter, I thought we would have a quick look at the quiz for the first few questions of Exeter. And so the first question is: For every 100 people, how many are aged under 16? Now, I don't know Exeter very well at all, so I had a guess at this, but it gives you an idea of how this quiz works. You drag the slider to highlight your icons, and then just click "Submit" to answer, and we animate away the difference between your answer and reality. And it turns out, I was a pretty terrible guess: five.
A tu je kvíz. Tu je ukážka kvízu, máte tu opakujúce sa ikonky na ľavej strane a mapu ukazujúcu vaše okolie, o ktorom sa pýtame otázky, na pravej strane. Kvíz má sedem otázok. Pre každú je možná odpoveď medzi nulou a stovkou a na konci kvízu dostanete celkové skóre medzi nulou a stovkou. A pretože toto je TEDxExeter, pomyslel som si, že by sme sa mohli rýchlo pozrieť aspoň na prvých pár otázok o Exeteri. Tak prvá otázka je: Z každých 100 ľudí, koľkí z nich majú menej ako 16 rokov? Až tak dobre Exeter nepoznám, takže som si tu tipol ale aspoň tušíte, ako kvíz funguje. Kliknete a potiahnete kurzor, aby ste označili vaše ikonky a potom kliknete len „Odoslať“, aby ste odpovedali a my animujeme rozdiel medzi vašou odpoveďou a skutočnosťou. A zdá sa, že som mal dosť zlý odhad: päť.
How about the next question? This is asking about what the average age is, so the age at which half the population are younger and half the population are older. And I thought 35 -- that sounds middle-aged to me.
Čo ďalšia otázka? Tá sa pýta, aký je priemerný vek, čiže vek, podľa ktorého je polovica populácie mladšia a polovica populácie staršia. Podľa mňa 35, to mi znie ako taký stredný vek.
(Laughter)
(smiech)
Actually, in Exeter, it's incredibly young, and I had underestimated the impact of the university in this area. The questions get harder as you go through. So this one's now asking about homeownership: For every 100 households, how many are owned with a mortgage or loan? And I hedged my bets here, because I didn't want to be more than 50 out on the answer.
V skutočnosti v Exeteri je neuveriteľne mladý priemer. a podcenil som dopad univerzity v tejto oblasti. Otázky sú postupne ťažšie, keď idete ďalej. Táto sa pýta o vlastníctve domov: Na každých 100 domácností, koľko z nich je vlastnených na hypotéku alebo pôžičku? A tu som si ochránil stávku lebo som nechcel byť mimo o viac ako 50 od správnej odpovede.
(Laughter)
(smiech)
And actually, these get harder, these questions, because when you're in an area, when you're in a community, things like age -- there are clues to whether a population is old or young. Just by looking around the area, you can see it. Something like homeownership is much more difficult to see, so we revert to our own heuristics, our own biases about how many people we think own their own homes.
A naozaj, je to čoraz ťažšie, tie otázky, pretože ak ste v okolí, ak ste v komunite, veci ako vek, sú to nápovedy či je populácia stará alebo mladá. Uvidíte to, stačí sa obzrieť okolo seba. Niečo ako vlastníctvo domov je oveľa ťažšie zbadať, takže sa vrátime k vlastným nálezom, vlastným pohľadom na to, koľko ľudí si myslíme, že vlastní svoje domovy.
Now the truth is, when we published this quiz, the census data that it's based on was already a few years old. We've had online applications that allow you to put in a post code and get statistics back for years. So in some senses, this was all a little bit old and not necessarily new. But I was interested to see what reaction we might get by gamifying the data in the way that we have, by using animation and playing on the fact that people have their own preconceptions.
Pravdou je, že keď som publikoval tento kvíz, údaje sčítania ľudu, na ktorých je založený, boli už staré pár rokov. Mali sme aplikácie, ktoré vám umožnia zadať poštové číslo a získate štatistiky za rôzne roky. Takže v istom zmysle toto tu je trochu staré a nie vyslovene nové. Ale zaujímalo ma, akú reakciu asi dostaneme tým, že sa pohráme s údajmi tak, ako sme to spravili my, použitím animácie a spoľahnutím sa na fakt, že ľudia majú vlastné predpojatosti.
It turns out, the reaction was, um ... was more than I could have hoped for. It was a long-held ambition of mine to bring down a statistics website due to public demand.
Zdá sa, že reakcia bola, hm... väčšia, než v akú som mohol dúfať. Mojou dlhoročnou ambíciou bolo zhodiť webstránku so štatistikami vďaka dopytu ľudí.
(Laughter)
(smiech)
This URL contains the words "statistics," "gov" and "UK," which are three of people's least favorite words in a URL. And the amazing thing about this was that the website came down at quarter to 10 at night, because people were actually engaging with this data of their own free will, using their own personal time. I was very interested to see that we got something like a quarter of a million people playing the quiz within the space of 48 hours of launching it. And it sparked an enormous discussion online, on social media, which was largely dominated by people having fun with their misconceptions, which is something that I couldn't have hoped for any better, in some respects. I also liked the fact that people started sending it to politicians. How well do you know the area you claim to represent?
Táto URL obsahuje slová „štatistiky“, „vláda“ a „UK“, čo sú tri najneobľúbenejšie slová ľudí čo sa týka URL. A čo je na tomto úžasné je, že webstránka padla o trištvrte na 10 v noci, pretože ľudia sa ozaj zaujímali o tieto údaje na základe vlastnej vôle, využívajúc svoj osobný čas. Bolo pre mňa zaujímavé vidieť, že sme mali asi štvrť milióna ľudí, ktorí robili kvíz v priebehu 48 hodín po vydaní. A spôsobilo to obrovskú diskusiu online, na sociálnych sieťach, ktoré sú väčšinou obývané ľuďmi, ktorí sa bavia na svojich chybných názoroch a ja som nemohol dúfať v nič lepšie, v určitom zmysle. Tiež sa mi páčil fakt, že to ľudia začali posielať politikom. Ako dobre poznáte vy svoje okolie, ktoré tvrdíte, že zastupujete?
(Laughter)
(smiech)
And then just to finish, going back to the two kinds of people, I thought it would be really interesting to see how people who are good with numbers would do on this quiz. The national statistician of England and Wales, John Pullinger, you would expect he would be pretty good. He got 44 for his own area.
No a aby som to ukončil, vrátim sa späť k tým dvom typom ľudí. Pomyslel som si, že by bolo ozaj zaujímavé vidieť, ako dopadnú ľudia, ktorým ide práca s číslami. Od národného štatistika Anglicka a Walesu Johna Pullingera by ste čakali, že dopadne dosť dobre. Dostal 44 za jeho vlastné okolie.
(Laughter)
(smiech)
Jeremy Paxman -- admittedly, after a glass of wine -- 36. Even worse. It just shows you that the numbers can inspire us all. They can surprise us all.
Jeremy Paxman, pravdu povediac po pohári vína, 36. Ešte horšie. Iba vám to ukazuje, že čísla môžu inšpirovať nás všetkých. Môžu prekvapiť nás všetkých.
So very often, we talk about statistics as being the science of uncertainty. My parting thought for today is: actually, statistics is the science of us. And that's why we should be fascinated by numbers.
Často hovoríme o štatistike ako o vede neurčitosti. Dnes sa rozlúčim touto myšlienkou: v skutočnosti je štatistika veda o nás. A preto by sme mali byť fascinovaní číslami.
Thank you very much.
Ďakujem vám veľmi pekne.
(Applause)
(potlesk)