Back in 2003, the UK government carried out a survey. And it was a survey that measured levels of numeracy in the population. And they were shocked to find out that for every 100 working age adults in the country, 47 of them lacked Level 1 numeracy skills. Now, Level 1 numeracy skills -- that's low-end GCSE score. It's the ability to deal with fractions, percentages and decimals. So this figure prompted a lot of hand-wringing in Whitehall. Policies were changed, investments were made, and then they ran the survey again in 2011. So can you guess what happened to this number? It went up to 49.
Em 2003, o governo do Reino Unido realizou um inquérito. Era um inquérito que media os níveis de numeracia da população. Ficaram chocados ao descobrir que, por cada 100 adultos que fazem parte da população ativa do país, 47 deles não obteve o primeiro nível de capacidades numéricas. É o nível mais baixo da classificação General Certificate of Secondary Education e refere-se a saber trabalhar com frações, percentagens e decimais. Como devem imaginar, estes resultados preocuparam muito o governo inglês. Foram alteradas políticas, foram feitos investimentos e, em 2011, voltaram a fazer o mesmo inquérito. Adivinham o que aconteceu? O número aumentou para 49.
(Laughter)
(Risos)
And in fact, when I reported this figure in the FT, one of our readers joked and said, "This figure is only shocking to 51 percent of the population."
Quando escrevi sobre a situação no Financial Times, um leitor riu-se e disse: "Estes números só chocam 51% da população."
(Laughter)
(Risos)
But I preferred, actually, the reaction of a schoolchild when I presented at a school this information, who raised their hand and said, "How do we know that the person who made that number isn't one of the 49 percent either?"
Mas, pessoalmente, preferi a reação de uma criança quando fiz uma apresentação sobre esta situação numa escola, que levantou a mão e disse: "Como sabemos se a pessoa que concluiu este resultado "não é uma dos 49%?"
(Laughter)
(Risos)
So clearly, there's a numeracy issue, because these are important skills for life, and a lot of the changes that we want to introduce in this century involve us becoming more comfortable with numbers.
Estamos perante, claramente, um problema de numeracia, pois são capacidades cruciais no dia-a-dia e muitas das mudanças que queremos introduzir neste século pedem que sejamos melhores com números.
Now, it's not just an English problem. OECD this year released some figures looking at numeracy in young people, and leading the way, the USA -- nearly 40 percent of young people in the US have low numeracy. Now, England is there too, but there are seven OECD countries with figures above 20 percent. That is a problem, because it doesn't have to be that way. If you look at the far end of this graph, you can see the Netherlands and Korea are in single figures. So there's definitely a numeracy problem that we want to address.
Mas este não é só um problema inglês. Este ano, a OCDE publicou alguns números sobre a numeracia nos jovens e, à frente, vão os EUA. Quase 40% dos jovens norte-americanos apresenta uma numeracia reduzida. A Inglaterra também aparece, mas há sete países da OCDE com resultados acima dos 20%. Isto é um problema, porque há maneira de o resolver. Se olharem para o fim deste gráfico, vemos a Holanda e a Coreia com números mais reduzidos. Portanto, há, efetivamente, um problema de numeracia para resolver.
Now, as useful as studies like these are, I think we risk herding people inadvertently into one of two categories; that there are two kinds of people: those people that are comfortable with numbers, that can do numbers, and the people who can't. And what I'm trying to talk about here today is to say that I believe that is a false dichotomy. It's not an immutable pairing. I think you don't have to have tremendously high levels of numeracy to be inspired by numbers, and that should be the starting point to the journey ahead.
Agora, por mais útil que seja este tipo de estudos, penso que caímos no risco de criarmos, ingenuamente, duas categorias, que existem dos tipos de pessoas as que estão à vontade com os números e com a matemática, e as que não estão. O que estou a tentar dizer aqui hoje é que eu penso que isto é uma falsa dicotomia. Não é uma divisão imutável. Penso que não temos de ter níveis elevadíssimos de numeracia para nos inspirarmos com os números, e esse deve ser o nosso ponto de partida.
And one of the ways in which we can begin that journey, for me, is looking at statistics. Now, I am the first to acknowledge that statistics has got somewhat of an image problem.
Uma das maneiras que temos para começar esta aventura é olhar para as estatísticas. Sou o primeiro a constatar que a estatística tem um problema visual.
(Laughter)
(Risos)
It's the part of mathematics that even mathematicians don't particularly like, because whereas the rest of maths is all about precision and certainty, statistics is almost the reverse of that. But actually, I was a late convert to the world of statistics myself. If you'd asked my undergraduate professors what two subjects would I be least likely to excel in after university, they'd have told you statistics and computer programming, and yet here I am, about to show you some statistical graphics that I programmed.
É a parte da matemática de que até os matemáticos não gostam muito, porque, enquanto o restante se foca na precisão e na certeza, a estatística é quase o contrário disso. Na verdade, sou um convertido tardio ao mundo da estatística. Se perguntassem aos meus professores quais as duas áreas em que eu teria menos sucesso após a universidade, eles responderiam: estatística e programação. Apesar disso, estou prestes a mostrar-vos alguns gráficos programados por mim.
So what inspired that change in me? What made me think that statistics was actually an interesting thing? It's really because statistics are about us. If you look at the etymology of the word statistics, it's the science of dealing with data about the state or the community that we live in. So statistics are about us as a group, not us as individuals. And I think as social animals, we share this fascination about how we as individuals relate to our groups, to our peers. And statistics in this way are at their most powerful when they surprise us.
O que inspirou essa mudança em mim? O que me fez ver que a estatística era interessante? O facto de ser sobre nós. Se olharmos para a etimologia da palavra "estatística", vemos que se traduz por "a ciência que utiliza dados "sobre o Estado ou a comunidade em que vivemos". Portanto, as estatísticas são a nossa vida em grupo, não como pessoas individuais. E, como animais sociais, partilhamos o fascínio de como nos relacionamos em grupo, com os nossos iguais. E a estatística é o elemento mais poderoso quando nos surpreende.
And there's been some really wonderful surveys carried out recently by Ipsos MORI in the last few years. They did a survey of over 1,000 adults in the UK, and said, for every 100 people in England and Wales, how many of them are Muslim? Now the average answer from this survey, which was supposed to be representative of the total population, was 24. That's what people thought. British people think 24 out of every 100 people in the country are Muslim. Now, official figures reveal that figure to be about five. So there's this big variation between what we think, our perception, and the reality as given by statistics. And I think that's interesting. What could possibly be causing that misperception?
Há inquéritos muito bons, levados a cabo recentemente pela empresa Ipsos MORI. Realizaram um inquérito a mais de 1000 adultos no Reino Unido, e perguntaram: "Em Inglaterra e País de Gales, quantos muçulmanos há "em cada 100 pessoas?" A resposta média a esta pergunta, que deveria ser um número representativo da população total, foi 24. Isto era o que as pessoas pensavam. Os britânicos achavam que 24 em cada 100 pessoas eram muçulmanas. Os números oficiais revelaram que eram 5 pessoas em cada 100. Portanto, existe uma grande diferença entre o que achamos, a nossa perceção, e a realidade dada pelas estatísticas. Eu acho isso interessante. O que poderá estar a causar esta perceção errada?
And I was so thrilled with this study, I started to take questions out in presentations. I was referring to it. Now, I did a presentation at St. Paul's School for Girls in Hammersmith, and I had an audience rather like this, except it was comprised entirely of sixth-form girls. And I said, "Girls, how many teenage girls do you think the British public think get pregnant every year?" And the girls were apoplectic when I said the British public think that 15 out of every 100 teenage girls get pregnant in the year. And they had every right to be angry, because in fact, I'd have to have closer to 200 dots before I could color one in, in terms of what the official figures tell us.
Estava tão entusiasmado com esta pergunta, que comecei a questionar isso nas minhas apresentações. Fiz uma palestra na escola St. Paul's for Girls, em Hammersmith, e tinha uma audiência semelhante a esta, com a exceção de serem todas raparigas entre os 16 e os 18 anos. E eu disse-lhes: "Meninas, "quantas adolescentes vocês pensam que o povo britânico acha "que engravidam todos os anos?" Todas elas ficaram pasmadas quando eu lhes disse que o povo britânico achava que eram 15 em cada 100 raparigas a engravidar a cada ano. E tinham todo o direito de estar zangadas, porque, de facto, eu tinha de ter perto de 200 círculos antes de pintar o interior de um, para conseguir representar o resultado oficial.
And rather like numeracy, this is not just an English problem. Ipsos MORI expanded the survey in recent years to go across the world. And so, they asked Saudi Arabians, for every 100 adults in your country, how many of them are overweight or obese? And the average answer from the Saudis was just over a quarter. That's what they thought. Just over a quarter of adults are overweight or obese. The official figures show, actually, it's nearer to three-quarters.
À semelhança da numeracia, este não é um problema só inglês. Há poucos anos, a Ipsos MORI expandiu o inquérito pelo mundo. Então, perguntaram aos árabes sauditas: "Por cada 100 adultos no seu país, "quantos estão acima do peso ideal ou são obesos?" A resposta média foi de, apenas, um pouco mais de um quarto deles. Era o que eles pensavam. Um quarto dos adultos estão com problemas de peso. Os números reais mostram que são cerca de três quartos.
(Laughter)
(Risos)
So again, a big variation.
Novamente, uma grande variação.
And I love this one: they asked in Japan, they asked the Japanese, for every 100 Japanese people, how many of them live in rural areas? The average was about a 50-50 split, just over halfway. They thought 56 out of every 100 Japanese people lived in rural areas. The official figure is seven.
E adoro este: perguntaram no Japão: "Por cada 100 japoneses, "quantos vivem em zonas rurais?" A média foi perto de 50%, cerca de metade. Achavam que 56 pessoas em 100, viviam em áreas rurais. O resultado real é sete.
So extraordinary variations, and surprising to some, but not surprising to people who have read the work of Daniel Kahneman, for example, the Nobel-winning economist. He and his colleague, Amos Tversky, spent years researching this disjoint between what people perceive and the reality, the fact that people are actually pretty poor intuitive statisticians. And there are many reasons for this. Individual experiences, certainly, can influence our perceptions, but so, too, can things like the media reporting things by exception, rather than what's normal. Kahneman had a nice way of referring to that. He said, "We can be blind to the obvious" -- so we've got the numbers wrong -- "but we can be blind to our blindness about it." And that has enormous repercussions for decision making.
Variações extraordinárias, e surpreendentes para alguns, mas não tão surpreendentes para quem leu o trabalho de Daniel Kahneman, por exemplo, o economista vencedor de um Nobel. O seu colega Amos Tversky e ele passaram anos a investigar esta diferença entre o que as pessoas percebem e a realidade, o facto de as pessoas serem muito más com estatísticas intuitivas. E existem várias razões. As experiências individuais influenciam as nossas perceções, bem como o facto de os "media" apresentarem as coisas excecionais, ao invés do que as normais. Kahneman tinha uma expressão engraçada. Ele dizia: "Podemos ser cegos ao óbvio..." — termos os números errados — "... mas também somos cegos à nossa cegueira." Isso tem repercussões enormes na tomada de decisões.
So at the statistics office while this was all going on, I thought this was really interesting. I said, this is clearly a global problem, but maybe geography is the issue here. These were questions that were all about, how well do you know your country? So in this case, it's how well do you know 64 million people? Not very well, it turns out. I can't do that. So I had an idea, which was to think about this same sort of approach but to think about it in a very local sense. Is this a local? If we reframe the questions and say, how well do you know your local area, would your answers be any more accurate?
Portanto, no meu escritório, enquanto tudo isto acontecia, eu pensei no quanto isto era interessante. Era claramente um problema global, mas talvez a geografia fosse o problema. Todas as perguntas que vimos eram sobre o quão bem conhecemos o nosso país. Neste caso, quão bem conhecemos 64 milhões de pessoas? Parece que não muito bem. É impossível. Então, tive uma ideia, que foi pensar neste tipo de abordagem, mas usá-lo com um sentido mais local. É uma localidade? Se mudarmos as perguntas e dissermos "Quão bem conhece a sua localidade?", estariam as respostas mais perto da verdade?
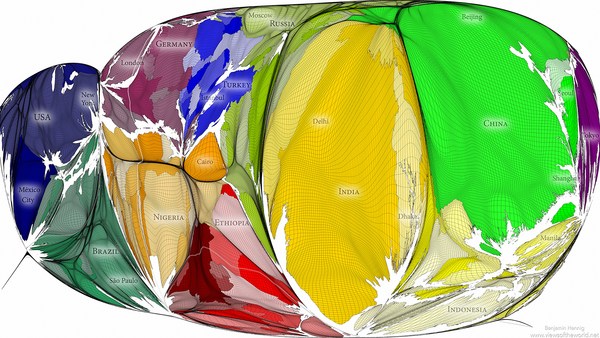
So I devised a quiz: How well do you know your area? It's a simple Web app. You put in a post code and then it will ask you questions based on census data for your local area. And I was very conscious in designing this. I wanted to make it open to the widest possible range of people, not just the 49 percent who can get the numbers. I wanted everyone to engage with it. So for the design of the quiz, I was inspired by the isotypes of Otto Neurath from the 1920s and '30s. Now, these are methods for representing numbers using repeating icons. And the numbers are there, but they sit in the background. So it's a great way of representing quantity without resorting to using terms like "percentage," "fractions" and "ratios."
Então, criei um questionário: Quão bem conhece a sua localidade? É uma simples aplicação web. Inserem um código postal e conseguem responder a perguntas, baseadas nos censos, sobre a área em questão. Fui muito consciencioso ao concebê-lo. Quis torná-lo o mais acessível possível, não apenas para os 49% que entendem os números. Quis que todos pudessem usá-lo. Então, para a sua conceção, inspirei-me nos isótipos de Otto Neurath, das décadas de 20 e 30 do século XX. São métodos de representação de números que usam ícones repetidos. Os números estão lá, mas em segundo plano. É uma excelente maneira de representar quantidades sem usar palavras como "percentagem", "frações" e "rácios".
So here's the quiz. The layout of the quiz is, you have your repeating icons on the left-hand side there, and a map showing you the area we're asking you questions about on the right-hand side. There are seven questions. Each question, there's a possible answer between zero and a hundred, and at the end of the quiz, you get an overall score between zero and a hundred. And so because this is TEDxExeter, I thought we would have a quick look at the quiz for the first few questions of Exeter. And so the first question is: For every 100 people, how many are aged under 16? Now, I don't know Exeter very well at all, so I had a guess at this, but it gives you an idea of how this quiz works. You drag the slider to highlight your icons, and then just click "Submit" to answer, and we animate away the difference between your answer and reality. And it turns out, I was a pretty terrible guess: five.
Então, aqui está o questionário. A disposição é a seguinte: têm, do vosso lado esquerdo, os ícones repetidos, e depois um mapa que mostra a região sobre a qual se fazem as perguntas, do lado direito. São sete perguntas. Em cada uma, existe a possibilidade de responderem entre zero e 100. No final do questionário, têm um resultado total entre zero e 100. E porque estamos no TEDxExeter, pensei que podíamos responder, rapidamente, às primeiras perguntas sobre Exeter. A primeira pergunta é: "Para cada 100 pessoas, quantas têm menos de 16 anos de idade?" Eu não conheço Exeter tão bem, pelo que vou dar um palpite, para vos dar uma ideia de como tudo funciona. Vocês arrastam o cursor para realçar os ícones, carregam no botão "Submit" para responder, e nós tratamos da animação entre a vossa resposta e a realidade. Vemos agora que não tive muito jeito para adivinhar... Eram cinco.
How about the next question? This is asking about what the average age is, so the age at which half the population are younger and half the population are older. And I thought 35 -- that sounds middle-aged to me.
E a próxima pergunta? Pergunta-nos qual a idade média, ou seja, qual a idade que divide os mais novos dos mais velhos da população. E eu pensei em 35. Parece-me ser o meio-termo.
(Laughter)
(Risos)
Actually, in Exeter, it's incredibly young, and I had underestimated the impact of the university in this area. The questions get harder as you go through. So this one's now asking about homeownership: For every 100 households, how many are owned with a mortgage or loan? And I hedged my bets here, because I didn't want to be more than 50 out on the answer.
Na verdade, Exeter é incrivelmente jovem e acabei por subestimar o impacto da universidade nesta região. As perguntas tornam-se mais difíceis à medida que avançamos. Esta pergunta fala-nos de casas próprias: "Em cada 100 casas, quantas foram compradas com uma hipoteca ou um empréstimo?" Eu limitei a minha aposta, pois não quis que a diferença fosse acima de 50.
(Laughter)
(Risos)
And actually, these get harder, these questions, because when you're in an area, when you're in a community, things like age -- there are clues to whether a population is old or young. Just by looking around the area, you can see it. Something like homeownership is much more difficult to see, so we revert to our own heuristics, our own biases about how many people we think own their own homes.
O nível de dificuldade vai aumentando, porque quando se trata de uma localidade, de uma comunidade, há pistas para temas como a idade, se a população é envelhecida ou não. Se olharmos à nossa volta, encontramos a resposta. Temas como a compra de habitação são mais difíceis de ver, pelo que voltamos aos nossos palpites, às nossas ideias sobre quantas pessoas achamos que compraram a sua casa.
Now the truth is, when we published this quiz, the census data that it's based on was already a few years old. We've had online applications that allow you to put in a post code and get statistics back for years. So in some senses, this was all a little bit old and not necessarily new. But I was interested to see what reaction we might get by gamifying the data in the way that we have, by using animation and playing on the fact that people have their own preconceptions.
Mas a verdade é que, quando publicámos esta página, os dados dos censos que usámos já tinham uns anos. Tínhamos aplicações na Internet que permitiam colocar um código postal e iam buscar estatísticas de anos anteriores. Estas aplicações permitiam conhecer o velho mas não o novo. Mas eu estava interessado em ver a reação que conseguiríamos ao brincar com os dados, utilizando animações e aproveitando o facto de as pessoas terem as suas ideias pré-concebidas..
It turns out, the reaction was, um ... was more than I could have hoped for. It was a long-held ambition of mine to bring down a statistics website due to public demand.
Acontece que a reação foi... mais do que estava à espera. Há muito que eu tinha a ambição de deitar abaixo um "site" de estatística devido a uma grande procura.
(Laughter)
(Risos)
This URL contains the words "statistics," "gov" and "UK," which are three of people's least favorite words in a URL. And the amazing thing about this was that the website came down at quarter to 10 at night, because people were actually engaging with this data of their own free will, using their own personal time. I was very interested to see that we got something like a quarter of a million people playing the quiz within the space of 48 hours of launching it. And it sparked an enormous discussion online, on social media, which was largely dominated by people having fun with their misconceptions, which is something that I couldn't have hoped for any better, in some respects. I also liked the fact that people started sending it to politicians. How well do you know the area you claim to represent?
Este "site" contém as palavras "estatística", "governo" e "Reino Unido", que são as três palavras menos favoritas num "site". O mais fascinante é que o "site" foi-se abaixo por volta das 21:45 da noite, porque as pessoas foram cativadas pelos dados e ficaram de livre vontade, usando o seu tempo pessoal. Deixou-me intrigado o facto de termos qualquer coisa como 250 mil pessoas a divertirem-se na página, durante 48 horas após o lançamento. Esta situação acendeu uma discussão enorme nas redes sociais, que foi dominada, sobretudo, por pessoas que se estavam a divertir-se com as suas ideias erradas, que foi algo que me surpreendeu pela positiva nalguns aspetos. Também gostei do facto de terem enviado o "link" para os políticos. "Quão bem conhece a zona que representa?"
(Laughter)
(Risos)
And then just to finish, going back to the two kinds of people, I thought it would be really interesting to see how people who are good with numbers would do on this quiz. The national statistician of England and Wales, John Pullinger, you would expect he would be pretty good. He got 44 for his own area.
E para terminar, voltando atrás, aos dois tipos de pessoas, achei que seria muito interessante ver as respostas de pessoas boas com números. John Pullinger, o estatístico nacional de Inglaterra e do País de Gales, devia ter um resultado notável. Sobre a sua localidade, teve 44 pontos finais.
(Laughter)
(Risos)
Jeremy Paxman -- admittedly, after a glass of wine -- 36. Even worse. It just shows you that the numbers can inspire us all. They can surprise us all.
Jeremy Paxman, que admitiu ter respondido depois de um copo de vinho, teve 36. Pior ainda. Isto demonstra que os números podem inspirar qualquer um de nós. Podem surpreender-nos.
So very often, we talk about statistics as being the science of uncertainty. My parting thought for today is: actually, statistics is the science of us. And that's why we should be fascinated by numbers.
Muitas vezes referimo-nos à estatística como a ciência da incerteza. O pensamento que vos deixo hoje é: na verdade, a estatística é a ciência sobre nós. É por isso que nos devíamos deixar fascinar pelos números.
Thank you very much.
Muito obrigado.
(Applause)
(Aplausos)