Back in 2003, the UK government carried out a survey. And it was a survey that measured levels of numeracy in the population. And they were shocked to find out that for every 100 working age adults in the country, 47 of them lacked Level 1 numeracy skills. Now, Level 1 numeracy skills -- that's low-end GCSE score. It's the ability to deal with fractions, percentages and decimals. So this figure prompted a lot of hand-wringing in Whitehall. Policies were changed, investments were made, and then they ran the survey again in 2011. So can you guess what happened to this number? It went up to 49.
In 2003 voerde de Britse regering een enquête uit. Die enquête mat de rekenvaardigheden van de bevolking. Ze waren geschokt toen ze ontdekten dat van elke 100 volwassenen in de beroepsbevolking er 47 nog niet de eenvoudigste rekenvaardigheden hadden. 'Level 1'-rekenvaardigheden in het VK zijn niet echt gevorderd. Het gaat om breuken, percentages en decimalen. Dus dit cijfer baarde de regering zorgen. Het beleid werd veranderd, er werden investeringen gedaan en in 2011 voerden ze de enquête opnieuw uit. Raad eens wat er met dat cijfer gebeurde? Het was gegroeid naar 49.
(Laughter)
(Gelach)
And in fact, when I reported this figure in the FT, one of our readers joked and said, "This figure is only shocking to 51 percent of the population."
Toen ik dit cijfer noemde in een financieel dagblad, grapte één van onze lezers: "Dit cijfer is alleen een schok voor 51 procent van de bevolking."
(Laughter)
(Gelach)
But I preferred, actually, the reaction of a schoolchild when I presented at a school this information, who raised their hand and said, "How do we know that the person who made that number isn't one of the 49 percent either?"
Maar ik geef de voorkeur aan de reactie van een leerling toen ik deze informatie op een school presenteerde. Ze stak haar hand op en zei: "Hoe weten we dat degene die dat cijfer heeft bedacht niet bij die 49 procent hoort?"
(Laughter)
(Gelach)
So clearly, there's a numeracy issue, because these are important skills for life, and a lot of the changes that we want to introduce in this century involve us becoming more comfortable with numbers.
Er is dus een probleem met rekenen, want dit zijn belangrijke levensvaardigheden en voor veel van de veranderingen die we deze eeuw willen inbrengen, moeten we beter kunnen omgaan met nummers.
Now, it's not just an English problem. OECD this year released some figures looking at numeracy in young people, and leading the way, the USA -- nearly 40 percent of young people in the US have low numeracy. Now, England is there too, but there are seven OECD countries with figures above 20 percent. That is a problem, because it doesn't have to be that way. If you look at the far end of this graph, you can see the Netherlands and Korea are in single figures. So there's definitely a numeracy problem that we want to address.
Dit is niet alleen een Engels probleem. De OESO publiceerde dit jaar cijfers over rekenvaardigheden onder jongeren en bovenaan stonden de Verenigde Staten: bijna 40 procent van de jongeren in de VS hebben slechte rekenvaardigheden. Engeland staat er ook bij, maar er zijn zeven OESO landen met cijfers boven de 20 procent. Dat is een probleem, omdat het niet zo hoeft te zijn. Als je helemaal rechts in de grafiek kijkt, zie je Nederland en Korea onder de 10 procent. Dus er is zeker een probleem met rekenvaardigheden om op te lossen.
Now, as useful as studies like these are, I think we risk herding people inadvertently into one of two categories; that there are two kinds of people: those people that are comfortable with numbers, that can do numbers, and the people who can't. And what I'm trying to talk about here today is to say that I believe that is a false dichotomy. It's not an immutable pairing. I think you don't have to have tremendously high levels of numeracy to be inspired by numbers, and that should be the starting point to the journey ahead.
Dit zijn nuttige onderzoeken, maar we lopen het risico mensen in te delen in twee categorieën, in twee soorten mensen: zij die goed zijn met cijfers, die ermee om kunnen gaan, en zij die dat niet zijn. Wat ik hier vandaag wil zeggen is dat dit een verkeerd onderscheid is. Het is geen onveranderlijk paar. Je hoeft geen fantastische rekenvaardigheden te hebben om te genieten van cijfers, en dat moet het uitgangspunt zijn van onze reis.
And one of the ways in which we can begin that journey, for me, is looking at statistics. Now, I am the first to acknowledge that statistics has got somewhat of an image problem.
En volgens mij kan je aan die reis beginnen door te kijken naar statistiek. Ik zal meteen toegeven dat de statistiek een imagoprobleem heeft.
(Laughter)
(Gelach)
It's the part of mathematics that even mathematicians don't particularly like, because whereas the rest of maths is all about precision and certainty, statistics is almost the reverse of that. But actually, I was a late convert to the world of statistics myself. If you'd asked my undergraduate professors what two subjects would I be least likely to excel in after university, they'd have told you statistics and computer programming, and yet here I am, about to show you some statistical graphics that I programmed.
Het is het wiskundeonderdeel dat zelfs wiskundigen niet echt leuk vinden. Als de rest van de wiskunde over precisie en zekerheid gaat, is statistiek het tegenovergestelde. Ik ben zelf ook pas later bekeerd tot de wereld van statistiek. Als je aan mijn docenten zou vragen in welke twee vakgebieden ik het minste zou gaan uitblinken, hadden ze gezegd: statistiek en programmeren. En toch sta ik hier, met statistische grafieken, zelf geprogrammeerd.
So what inspired that change in me? What made me think that statistics was actually an interesting thing? It's really because statistics are about us. If you look at the etymology of the word statistics, it's the science of dealing with data about the state or the community that we live in. So statistics are about us as a group, not us as individuals. And I think as social animals, we share this fascination about how we as individuals relate to our groups, to our peers. And statistics in this way are at their most powerful when they surprise us.
Waardoor ben ik zo veranderd? Waarom vond ik statistiek ineens interessant? Het komt omdat statistiek echt over ons gaat. Als je naar de etymologie van 'statistiek' kijkt, is het de wetenschap van de gegevens van de staat of de gemeenschap waar wij in leven. Dus statistiek gaat over ons als groep, niet over ons als individuen. Omdat we sociale dieren zijn, delen we deze fascinatie voor hoe we in de groep passen, hoe we met anderen omgaan. En statistiek is het krachtigst als het verrassend is.
And there's been some really wonderful surveys carried out recently by Ipsos MORI in the last few years. They did a survey of over 1,000 adults in the UK, and said, for every 100 people in England and Wales, how many of them are Muslim? Now the average answer from this survey, which was supposed to be representative of the total population, was 24. That's what people thought. British people think 24 out of every 100 people in the country are Muslim. Now, official figures reveal that figure to be about five. So there's this big variation between what we think, our perception, and the reality as given by statistics. And I think that's interesting. What could possibly be causing that misperception?
En er zijn meerdere fantastische enquêtes uitgevoerd door Ipsos MORI, de afgelopen jaren. Één enquête onder 1.000 volwassenen in het VK stelde de vraag: "Van elke 100 mensen in Engeland en Wales, hoeveel daarvan zijn moslim?" Het gemiddelde antwoord in deze enquête, wat representatief zou moeten zijn voor de hele bevolking, was 24. Dat dachten mensen. Britse mensen denken dat 24 van elke 100 mensen moslim zijn. Officiële cijfers laten zien dat het er ongeveer 5 zijn. Er is dus een groot verschil tussen wat we denken, onze perceptie, en de statistische realiteit. Ik vind dat interessant. Waar komt deze misvatting vandaan?
And I was so thrilled with this study, I started to take questions out in presentations. I was referring to it. Now, I did a presentation at St. Paul's School for Girls in Hammersmith, and I had an audience rather like this, except it was comprised entirely of sixth-form girls. And I said, "Girls, how many teenage girls do you think the British public think get pregnant every year?" And the girls were apoplectic when I said the British public think that 15 out of every 100 teenage girls get pregnant in the year. And they had every right to be angry, because in fact, I'd have to have closer to 200 dots before I could color one in, in terms of what the official figures tell us.
Ik was zo blij met deze enquête dat ik ze gebruikte in presentaties. Ik verwees er constant naar. Ik gaf een presentatie op St. Paul's School for Girls in Hammersmith, en ik had net zo'n publiek als nu, behalve dat het bestond uit meisjes uit de bovenbouw. En ik zei: "Meiden, hoeveel tienermeisjes denken jullie dat het Britse volk denkt dat er elk jaar zwanger worden?" En de meisjes kregen bijna een beroerte toen ik zei dat het Britse volk denkt dat 15 van elke 100 tienermeisjes elk jaar zwanger worden. En ze hadden het recht om boos te zijn, want eigenlijk zou ik bijna 200 rondjes moeten hebben om er één in te kleuren, gebaseerd op de officiële cijfers.
And rather like numeracy, this is not just an English problem. Ipsos MORI expanded the survey in recent years to go across the world. And so, they asked Saudi Arabians, for every 100 adults in your country, how many of them are overweight or obese? And the average answer from the Saudis was just over a quarter. That's what they thought. Just over a quarter of adults are overweight or obese. The official figures show, actually, it's nearer to three-quarters.
En net als rekenvaardigheden, is dit niet alleen een Engels probleem. Ipsos MORI heeft dit onderzoek ook in andere landen uitgevoerd. Zo vroegen ze Saudiërs: "Van elke 100 volwassenen in het land, hoeveel van hen zijn er te dik?" En het gemiddelde antwoord van de Saudiërs was meer dan een kwart. Dat dachten ze. Meer dan een kwart van de volwassenen is te dik. De officiële cijfers, echter, laten zien dat het eerder driekwart is.
(Laughter)
(Gelach)
So again, a big variation.
Dus weer een groot verschil.
And I love this one: they asked in Japan, they asked the Japanese, for every 100 Japanese people, how many of them live in rural areas? The average was about a 50-50 split, just over halfway. They thought 56 out of every 100 Japanese people lived in rural areas. The official figure is seven.
De volgende vind ik leuk. Ze vroegen in Japan: "Van elke 100 Japanners, hoeveel van hen wonen op het platteland?" Het gemiddelde antwoord was net iets meer dan de helft. Ze dachten dat 56 van elke 100 Japanners op het platteland woonden. Het officiële cijfer is 7.
So extraordinary variations, and surprising to some, but not surprising to people who have read the work of Daniel Kahneman, for example, the Nobel-winning economist. He and his colleague, Amos Tversky, spent years researching this disjoint between what people perceive and the reality, the fact that people are actually pretty poor intuitive statisticians. And there are many reasons for this. Individual experiences, certainly, can influence our perceptions, but so, too, can things like the media reporting things by exception, rather than what's normal. Kahneman had a nice way of referring to that. He said, "We can be blind to the obvious" -- so we've got the numbers wrong -- "but we can be blind to our blindness about it." And that has enormous repercussions for decision making.
Er zijn dus grote verschillen, wat sommigen verrassend vinden, maar niet verrassend voor hen die bekend zijn met het werk van Daniel Kahneman, de Nobelprijs-winnende econoom. Hij en zijn collega, Amos Tversky, deden jarenlang onderzoek naar het verschil tussen wat mensen denken en de realiteit, het feit dat mensen eigenlijk slecht zijn in intuïtieve statistiek. Dat komt door verschillende dingen. Individuele ervaringen kunnen onze ideeën beïnvloeden, net als het feit dat de media alleen bijzondere dingen rapporteren en niet de normale dingen. Kahneman zei dat heel leuk: "Soms zien we het overduidelijke niet" - dus onze cijfers kloppen niet - "maar soms zien we onze eigen blindheid niet." En dat heeft enorme gevolgen voor het maken van beslissingen.
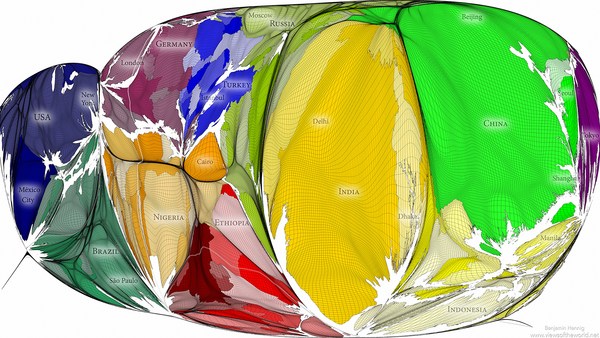
So at the statistics office while this was all going on, I thought this was really interesting. I said, this is clearly a global problem, but maybe geography is the issue here. These were questions that were all about, how well do you know your country? So in this case, it's how well do you know 64 million people? Not very well, it turns out. I can't do that. So I had an idea, which was to think about this same sort of approach but to think about it in a very local sense. Is this a local? If we reframe the questions and say, how well do you know your local area, would your answers be any more accurate?
Ik zat ondertussen op het statistiekbureau en ik vond dit erg interessant. Ik zei dat dit een wereldwijd probleem is, maar misschien is geografie wel het punt. Al deze vragen gingen over hoe goed je je land kende. In ons geval: hoe goed ken je 64 miljoen mensen? Niet erg goed, blijkt. Ik ben daar niet goed in. Dus ik kreeg een idee: ik zou deze aanpak overnemen en toepassen op een lokale manier. Is dit lokaal? Als we de vraag anders stellen: 'Hoe goed ken je je eigen gebied?', zouden de antwoorden dan beter kloppen?
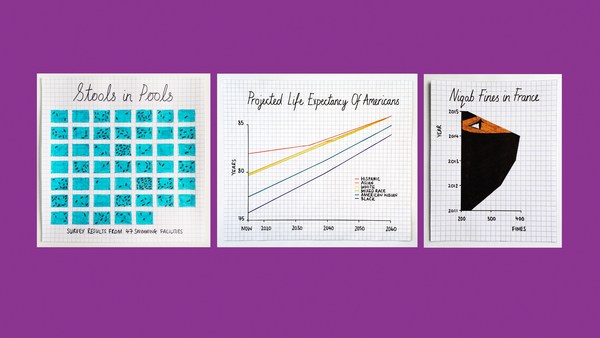
So I devised a quiz: How well do you know your area? It's a simple Web app. You put in a post code and then it will ask you questions based on census data for your local area. And I was very conscious in designing this. I wanted to make it open to the widest possible range of people, not just the 49 percent who can get the numbers. I wanted everyone to engage with it. So for the design of the quiz, I was inspired by the isotypes of Otto Neurath from the 1920s and '30s. Now, these are methods for representing numbers using repeating icons. And the numbers are there, but they sit in the background. So it's a great way of representing quantity without resorting to using terms like "percentage," "fractions" and "ratios."
Dus ik maakte een quiz: hoe goed ken je je buurt? Het is een simpele app. Je typt een postcode in en dan krijg je vragen gebaseerd op steekproefdata van jouw buurt. Ik heb tijdens het maken bewust geprobeerd om het toegankelijk te maken voor zoveel mogelijk mensen, niet alleen voor de 49 procent die goed zijn met cijfers. Ik wilde dat iedereen meedeed. Voor het ontwerp van de quiz was ik geïnspireerd door de isotypen van Otto Neurath uit de jaren 20 en 30. Dit zijn manieren om cijfers weer te geven met de herhaling van iconen. De cijfers zijn er wel, maar op de achtergrond. Het is dus een handige manier om kwantiteit weer te geven zonder gebruik te maken van termen als percentage, fracties en verhoudingen.
So here's the quiz. The layout of the quiz is, you have your repeating icons on the left-hand side there, and a map showing you the area we're asking you questions about on the right-hand side. There are seven questions. Each question, there's a possible answer between zero and a hundred, and at the end of the quiz, you get an overall score between zero and a hundred. And so because this is TEDxExeter, I thought we would have a quick look at the quiz for the first few questions of Exeter. And so the first question is: For every 100 people, how many are aged under 16? Now, I don't know Exeter very well at all, so I had a guess at this, but it gives you an idea of how this quiz works. You drag the slider to highlight your icons, and then just click "Submit" to answer, and we animate away the difference between your answer and reality. And it turns out, I was a pretty terrible guess: five.
Hier is de quiz. Het is zo ontworpen: je ziet hier links de herhaalde iconen, en een kaart met het gebied waar we je vragen over stellen aan de rechterkant. Er zijn zeven vragen. Elke vraag kan beantwoord worden met een cijfer tussen nul en honderd en aan het einde van de quiz krijg je een totale score tussen de nul en de honderd. Omdat dit TEDxExeter is, dacht ik dat we de quiz even konden bekijken met de eerste paar vragen over Exeter. De eerste vraag is: "Van elke 100 mensen, hoeveel zijn er jonger dan 16?" Ik ken Exeter niet zo goed, dus ik moest raden, maar je krijgt nu een idee van hoe de quiz werkt. Je sleept het schuifje om de icoontjes te markeren en je klikt op 'Inleveren' om te antwoorden, en dan animeren we het verschil tussen jouw antwoord en de realiteit. Het blijkt dat ik slecht geraden heb: vijf.
How about the next question? This is asking about what the average age is, so the age at which half the population are younger and half the population are older. And I thought 35 -- that sounds middle-aged to me.
Wat is de volgende vraag? Deze vraagt wat de gemiddelde leeftijd is, zodat de helft van de mensen jonger is en de andere helft ouder. En ik dacht 35 - dat klinkt als middelbare leeftijd.
(Laughter)
(Gelach)
Actually, in Exeter, it's incredibly young, and I had underestimated the impact of the university in this area. The questions get harder as you go through. So this one's now asking about homeownership: For every 100 households, how many are owned with a mortgage or loan? And I hedged my bets here, because I didn't want to be more than 50 out on the answer.
Maar eigenlijk is Exeter ongelofelijk jong, en ik had de impact van de universiteit onderschat. De vragen worden steeds moeilijker. Deze vraagt naar eigenwoningbezit. Van elke 100 huishoudens, hoeveel hebben er een hypotheek of lening? Ik heb me hier ingedekt, want ik wilde er niet meer dan 50 naast zitten.
(Laughter)
(Gelach)
And actually, these get harder, these questions, because when you're in an area, when you're in a community, things like age -- there are clues to whether a population is old or young. Just by looking around the area, you can see it. Something like homeownership is much more difficult to see, so we revert to our own heuristics, our own biases about how many people we think own their own homes.
En ze worden moeilijker, deze vragen, want in je eigen gebied, als je in een gemeenschap bent, met dingen als leeftijd -- je kan de leeftijd van mensen nog aflezen. Als je gewoon om je heenkijkt, dan zie je dat wel. Iets als eigenwoningbezit is veel moeilijker te zien, dus vallen we terug op onze eigen heuristiek, onze eigen vooroordelen over hoeveel mensen een huis hebben.
Now the truth is, when we published this quiz, the census data that it's based on was already a few years old. We've had online applications that allow you to put in a post code and get statistics back for years. So in some senses, this was all a little bit old and not necessarily new. But I was interested to see what reaction we might get by gamifying the data in the way that we have, by using animation and playing on the fact that people have their own preconceptions.
Toen we deze quiz publiceerden, waren de data van de steekproeven alweer een aantal jaar oud. Er waren al apps waarin je een postcode kon invullen en de statistieken van jaren terug kon zien. Dus eigenlijk was dit allemaal wat gedateerd, niet per se nieuw. Maar ik wilde graag weten wat voor reactie we zouden krijgen door een spel te maken van de data die we hebben, met animaties en door in te spelen op de vooroordelen van de mensen.
It turns out, the reaction was, um ... was more than I could have hoped for. It was a long-held ambition of mine to bring down a statistics website due to public demand.
Hun reacties blijken, ehm... talrijker dan ik had verwacht. Ik had al heel lang de wens om een statistiekwebsite te doen crashen door vraag van het publiek.
(Laughter)
(Gelach)
This URL contains the words "statistics," "gov" and "UK," which are three of people's least favorite words in a URL. And the amazing thing about this was that the website came down at quarter to 10 at night, because people were actually engaging with this data of their own free will, using their own personal time. I was very interested to see that we got something like a quarter of a million people playing the quiz within the space of 48 hours of launching it. And it sparked an enormous discussion online, on social media, which was largely dominated by people having fun with their misconceptions, which is something that I couldn't have hoped for any better, in some respects. I also liked the fact that people started sending it to politicians. How well do you know the area you claim to represent?
Deze URL bevat de woorden 'statistiek', 'gov' en 'UK', de drie minst populaire woorden in een URL. En het frappante feit is dat de website crashte om kwart voor 10 's avonds, want mensen waren echt met deze data bezig uit eigen vrije wil, in hun eigen vrije tijd. Ik vond het interessant om te zien dat er ongeveer een kwart miljoen mensen waren die de quiz binnen 48 uur na lancering speelden. Er kwam een enorme discussie op gang, online, op sociale media, waar vooral duidelijk werd dat mensen het leuk vonden om hun eigen vooroordelen te zien, en ik had eigenlijk niet op beter kunnen hopen, op een bepaalde manier. Ik vond het ook leuk dat mensen het naar politici stuurden. Hoe goed ken je het gebied dat je vertegenwoordigt?
(Laughter)
(Gelach)
And then just to finish, going back to the two kinds of people, I thought it would be really interesting to see how people who are good with numbers would do on this quiz. The national statistician of England and Wales, John Pullinger, you would expect he would be pretty good. He got 44 for his own area.
En om het af te maken, als we teruggaan naar die twee soorten mensen, dacht ik dat het interessant zou zijn om te zien hoe mensen die goed zijn met cijfers deze quiz zouden maken. De nationale statisticus van Engeland en Wales, John Pullinger, van hem zou je een goede score verwachten. Hij scoorde 44 voor zijn eigen gebied.
(Laughter)
(Gelach)
Jeremy Paxman -- admittedly, after a glass of wine -- 36. Even worse. It just shows you that the numbers can inspire us all. They can surprise us all.
Jeremy Paxman - toegegeven, met een glas wijn - 36. Nog slechter. Het laat zien dat cijfers ons allemaal kunnen inspireren. Ze kunnen ons verrassen.
So very often, we talk about statistics as being the science of uncertainty. My parting thought for today is: actually, statistics is the science of us. And that's why we should be fascinated by numbers.
We praten zo vaak over statistiek als de wetenschap van onzekerheid. Mijn laatste gedachte van vandaag is: statistiek is de wetenschap van ons. En daarom zouden we gefascineerd moeten zijn door cijfers.
Thank you very much.
Dankjewel.
(Applause)
(Applaus)